Solana tumbled below the $20 and $15 levels against the US Dollar. SOL price is now recovering, but upsides might be limited above $15 and $17.
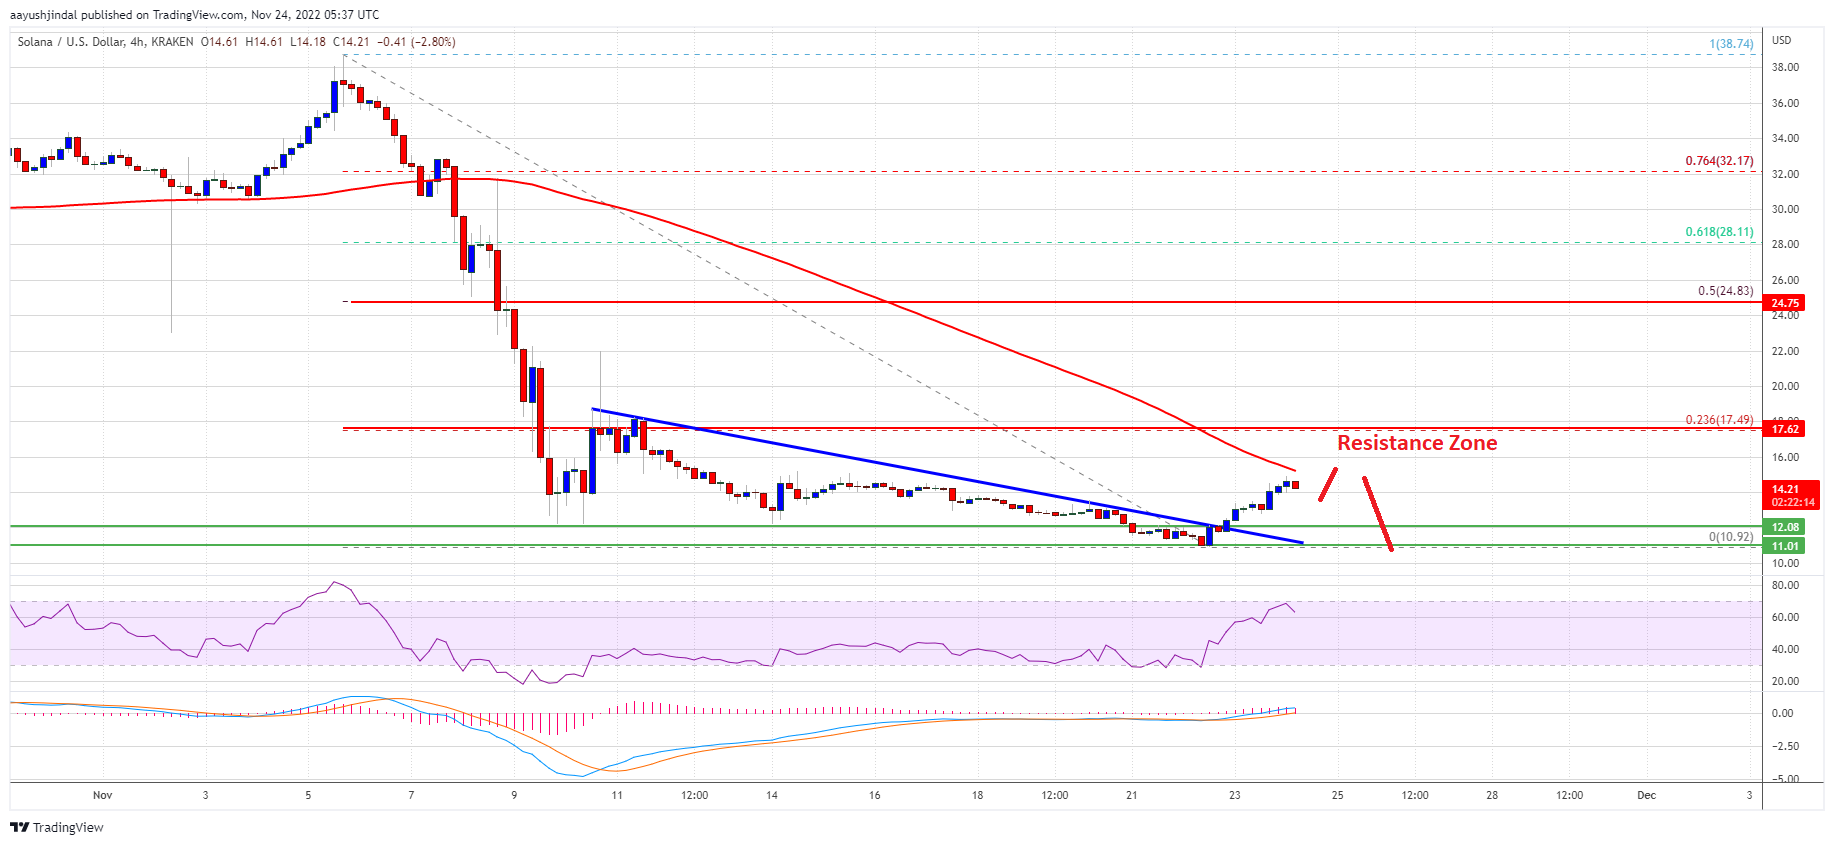
Sol price traded as low as $10.92 before it recovered a few points against the US Dollar.
The price is now trading below $15 and the 100 simple moving average (4-hours).
There was a break above a major bearish trend line with resistance near $12.45 on the 4-hours chart of the SOL/USD pair (data source from Kraken).
The pair could face a strong selling interest near $15 and $17 in the coming days.
Solana Price Starts Short-Term Recovery
This month, solana price saw a strong downward move below the $30 level. There was a strong move below the $25 and $20 support levels.
Sol price even dumped below the $15 level. Finally, it found support near $11 and traded as low as $10.92. Recently, there was a minor upside correction similar to bitcoin and ethereum. The price was able to climb above the $11.50 and $11.85 levels.
Besides, there was a break above a major bearish trend line with resistance near $12.45 on the 4-hours chart of the SOL/USD pair. However, the pair is still trading below $15 and the 100 simple moving average (4-hours).
On the upside, an immediate resistance is near the $15 level and the 100 simple moving average (4-hours). The next major resistance is near the $17 zone. It is close to the 23.6% Fib retracement level of the main drop from the $38.75 swing high to $10.92 low.
A close above the $17 zone might send the price towards the $20 level in the near term. Any more gains might send the price towards the $25 level.
Fresh Decline in SOL?
If SOL fails to clear the $15 resistance, it could start a fresh decline. An initial support on the downside is near the $13.00 level.
The first major support is near the $12 level. The next major support is near the $11 level or the recent low. If there is a downside break below the $11 support, the bears might even push the price below $10.
Technical Indicators
4-Hours MACD – The MACD for BNB/USD is losing pace in the bearish zone.
4-Hours RSI (Relative Strength Index) – The RSI for BNB/USD is currently above the 50 level.
Major Support Levels – $13, $12 and $11.
Major Resistance Levels – $15, $17 and $20.