Odaily Invited Market Analyst Conaldo, Master of Financial Statistics from Columbia University, USA, focused on quantitative trading of US stocks during university and gradually expanded to digital assets such as Bitcoin, building a systematic quantitative trading model and risk control system through practical experience; possesses keen data insight into market fluctuations and is committed to continuous development in the professional trading field, pursuing stable returns; will delve into BTC technical, macro, and capital changes weekly, review and showcase practical strategies, and preview major upcoming events for reference.

Core Summary of Trading Weekly Report:
- Strategy Execution (Short-term) Effectiveness Verification: Last week's trading strictly followed the established strategy, successfully completed two operations, achieving a cumulative return of 3.62%.
- Core View (Short-term) Verification: Our core view proposed last week that "the market will show wide-range fluctuations" has been perfectly verified by the market movement. The defined core observation range of $89,500~$91,000 and the support area below of $86,500~$87,500 were repeatedly tested by the market. Particularly key is that last week's high of $90,598 was only $402 away from the upper edge of our core area ($91,000); the low during the week ($86,400) was only $100 away from the lower edge of the support area ($86,500), fully confirming the accuracy of our point prediction.
- From a macro-technical perspective, Bitcoin has been in adjustment for 82 days since hitting its all-time high of $126,200 on October 6, with a maximum decline of about 36%, confirming a medium-term bearish trend. However, observing multiple technical indicators, it has now entered a low area, and the time and space of the adjustment are gradually approaching historical common oversold conditions. Since November 22, the price has continued to consolidate in a low range, showing a relative balance between bullish and bearish forces, with momentum for a directional breakthrough gathering. Although there are increasing calls for a rise in the market, we believe that, excluding interference from sudden news, there is still one key possibility for the subsequent trend: if the market is dominated by main funds, a better strategy for the bears might be to break down first, piercing the key psychological barrier of $80,000, using panic to clear the remaining long positions, thus completing the final bottoming. After that, funds can顺势 achieve a "short to long" shift, quickly pulling the price away from the cost area, and then start a relatively strong technical correction. It must be emphasized that the above trend is only a deduction based on market behavior logic, not an inevitable path. No matter how the market evolves, remember: "The market is always right." Before the choice of direction, maintaining observation and flexible response remains key at this stage.
1. Review of Last Week's Trading Results: (12.22~12.28)
1. Short-term Trading Review (No Leverage):

• First Trade (Profit 2.27%): Based on the "rebound to core pressure area encounters resistance and goes short" pattern. When the price冲击 the $89,500~$91,000 area and encountered resistance,叠加 the spread trading model simultaneously发出 a top signal, a 30% short position was established, and finally closed for profit when the price fell near the support area.
• Second Trade (Profit 1.35%): The logic of this trade is the same as above. When the price冲击 the $89,500~$91,000 area and encountered resistance,叠加 two models发出 resonance signals, successfully completing this trade.
2. Last Week's Trend Prediction and Operation Strategy Review:
Last week's前瞻 analysis clearly stated: It is expected that the market will mainly present a wide-range fluctuation pattern. The core observation range is $89,500~$91,000, and the outcome of the struggle in this area will determine the short-term direction. The following is the strategy review and analysis.
1. Market Trend Prediction Review:
• Core Pressure Level: First pressure looks at the $89,500~$91,000 area; second pressure looks at the $93,000~$94,500 area.
• Core Support Level: First support looks at the $86,500~$87,500 area; second support looks at the $83,500~$84,500 area.
2. Operation Strategy Review:
• Midline Strategy: Maintain about 65% midline position (short).
• Short-term Strategy: Last week we initially drafted A/B two sets of short-term operation plans. Combined with the actual market movement, we finally used Plan B as the core strategy and executed it.
(Plan B: Rebound verification, the $89,500~$91,000 core area has been effectively broken)
• Open Position: When encountering resistance signals during the rebound verification process, a 30% short position can be established.
• Risk Control: Stop loss set above $92,000.
• Close Position: When the price探 to the $83,500~$84,500 area shows resistance, consider partially or fully closing the position to take profit.
2. Technical Analysis: Bitcoin Medium-term Trend Judgment
Combining last week's market operation, the author will use multi-dimensional analysis models to conduct an in-depth analysis of the evolution of Bitcoin's internal structure and trend.
Bitcoin Weekly K-line Chart: (Momentum Quantitative Model + Sentiment Quantitative Model)
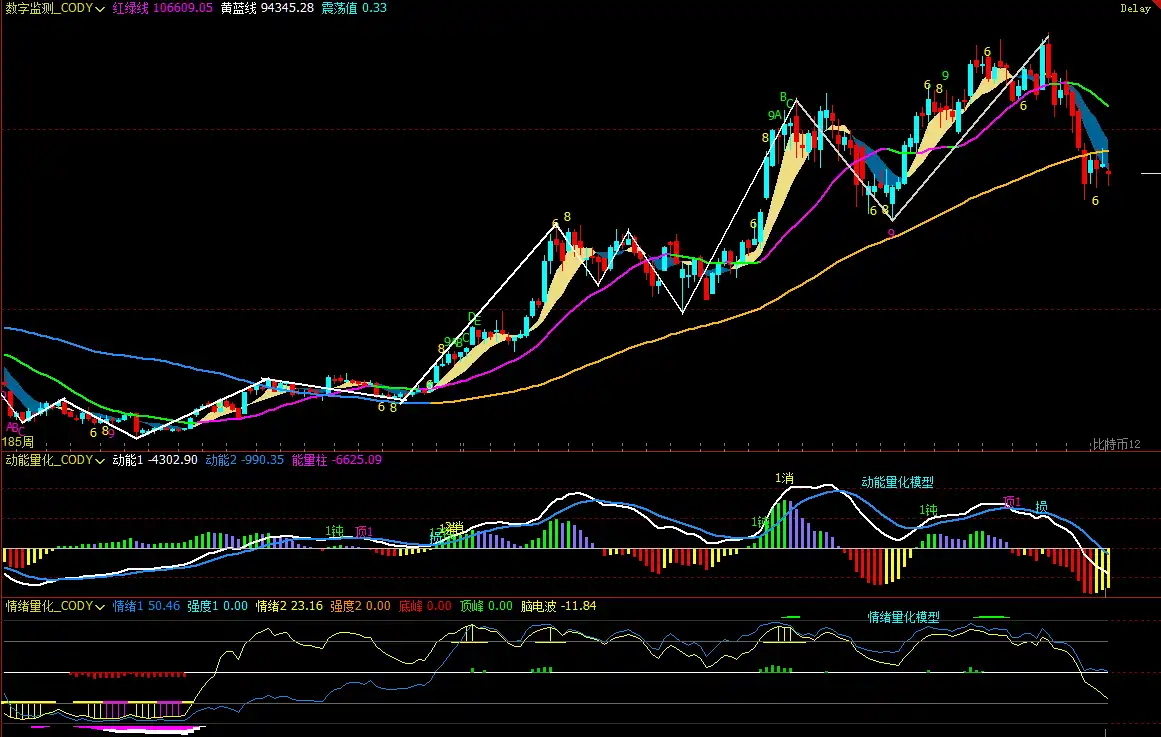
Figure 2
1. As shown in (Figure 2), analysis from the weekly chart:
• Momentum Quantitative Model: After last week's adjustment, the two momentum indicator lines are still running below the zero axis, and the negative energy柱 is gradually shortening. This indicates that although the weekly line has entered a bear market, the bearish momentum has not been fully released.
Momentum Quantitative Model Predicts: Price decline index: High
• Sentiment Quantitative Model: Blue sentiment line value 49.74, strength zero; yellow sentiment line value 19.99 (close to the low threshold), strength zero, peak value is 0.
Sentiment Quantitative Model Predicts: Price pressure and support index: Neutral
• Digital Monitoring Model: The price has broken below the bull-bear (yellow-blue line)分界线 for 6 weeks; short-term bottom digital signal (above 9) has not yet appeared.
The above data预示: Bitcoin's weekly chart has established a bearish trend, be wary of subsequent release of bearish力量.
Bitcoin Daily K-line Chart:
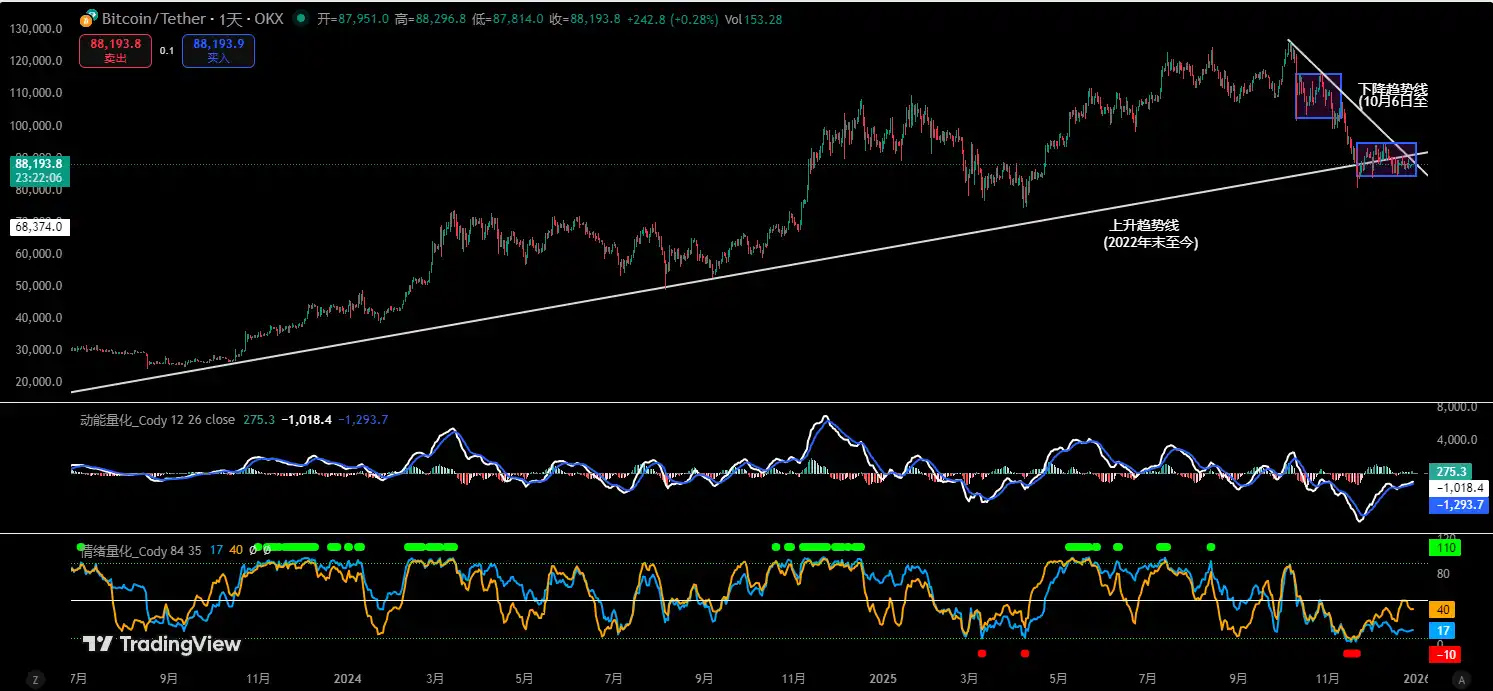
Figure 3
2. As shown in (Figure 3), analysis from the daily chart:
• Momentum Quantitative Model: In last week's movement, the two momentum lines were almost粘合 together, slowly rising below the zero axis and gradually approaching the zero axis. Affected by the holiday, daily trading volume continued to萎缩, and the positive energy柱 change was not obvious.
Momentum Quantitative Model Predicts: Buying momentum is weak, the energy柱 has contracted to a "starlight" shape, indicating a temporary balance between bullish and bearish forces.
• Sentiment Quantitative Model: After last week's daily close, the blue sentiment line value is 16 (close to the low threshold), strength zero; yellow sentiment line value is 40, strength zero.
Sentiment Quantitative Model Predicts: Pressure and support index: Neutral
The above data提示: The daily level is in a bear market, and the short-term market is about to choose a direction.
3. This Week's Bitcoin Market Prediction: (12.29~01.04)
1. It is highly likely that the market will mainly fluctuate and探底 this week, with the core observation range at $86,000~$86,500.
• If effectively broken below: The price may continue to探, testing the support area below of $83,500~$84,500.
• If effectively站稳: The market may延续 the current $86,500~$91,000 range fluctuation pattern.
2. Core Pressure Levels:
• First Pressure Area: $89,500~$91,000 area
• Second Pressure Area: $93,000~$94,500 area
• Important Pressure Area: Near $97,000
3. Core Support Levels:
• First Support Level: $86,000~$86,500 area
• Second Support Level: $83,500~$84,500 area
• Important Support Level: Near $80,000.
4. This Week's Bitcoin Operation Strategy (Excluding Sudden News Impact): (12.29~01.04)
1. Midline Strategy: Maintain about 65% midline position (short).
2. Short-term Strategy: Use 30% of the position, set stop loss points, and look for "spread" opportunities based on support and pressure levels. (Using 30 minutes as the operation cycle).
3. Focus on observing the struggle between bulls and bears over the $86,000~$86,500 area. To cope with market evolution, we have drafted A/B two sets of short-term operation plans:
• Plan A: If effectively站稳 the $86,000~$86,500 area:
• Open Position: When the price rebounds to the $89,500~$91,000 area and shows resistance signals, a 30% short position can be established.
• Risk Control: Short stop loss set above $92,500.
• Close Position: When the price falls to the $86,000~$86,500 area and shows stabilization signals, close all short positions to take profit.
• Plan B: If effectively跌破 the $86,000~$86,500 area:
• Open Position: If the price effectively breaks below, a 30% short position can be established.
• Risk Control: Stop loss set above $88,000.
• Close Position: When the price探 to the $83,500~$84,500 area shows stabilization signals, gradually close the position to take profit.
5. Special Tips:
1. When opening a position: Immediately set the initial stop loss level.
2. When profit reaches 1%: Move the stop loss to the opening cost price (break-even point) to ensure principal safety.
3. When profit reaches 2%: Move the stop loss to the position of 1% profit.
4. Continuous tracking: Thereafter, for every additional 1% profit, move the stop loss同步 by 1%, dynamically protecting and locking in existing profits.
(Note: The above 1% profit trigger threshold can be flexibly adjusted by investors according to their own risk preference and标的 volatility.)
6. This Week's Key Events前瞻: (12.29~01.04)
1. Fed Meeting Minutes Release "Real Divergence" Signal
Wednesday 03:00, the Fed will release the latest monetary policy meeting minutes. Compared to the interest rate decision itself, the minutes are more critical regarding the degree of divergence among internal members on the "timing, magnitude, and sustainability of rate cuts."
If the minutes show increased confidence among officials in the decline of inflation and discuss an earlier or faster easing path, it will strengthen the market's expectation of "declining real interest rates," constituting a medium-term positive for Bitcoin; conversely, if the minutes emphasize concerns about inflation recurring or financial conditions easing too quickly, it may阶段性 lift the US dollar and US bond yields, forming emotional suppression on BTC.
For Bitcoin, this is not a short-term directional signal but an important node affecting the mid-term capital pricing anchor.
2. Initial Jobless Claims: Thermometer of Liquidity Expectations
Wednesday 21:30, the US will announce the initial jobless claims for the week ending December 27.
The current market is more concerned with "whether the labor market is showing structural cooling" rather than fluctuations in a single data point.
If initial claims持续 above trend levels, it will further verify the economic cooling logic, strengthening the market's expectation of continued宽松 policy, which is beneficial for the valuation repair of non-yielding assets like Bitcoin; if the data falls again, it may strengthen the judgment that "the economy is still resilient," which is not conducive to the expansion of risk appetite for BTC in the short term.
The impact of this indicator on Bitcoin is mainly reflected in interest rate expectations rather than fundamentals itself.
3. Final Manufacturing PMI Verifies Real Economy Direction
Friday 22:45, the US December S&P Global Manufacturing PMI final value will be announced.
As a leading indicator, the PMI will help the market judge whether "soft landing" is still on track.
If the final value confirms that manufacturing is stabilizing or even improving, the overall sentiment of risk assets is expected to be maintained, with limited systemic pressure on BTC; if the PMI is revised down again, it may trigger repricing of economic downturn, short-term bearish for risk assets, but medium to long term may反而 strengthen expectations for monetary easing.
Financial markets are changing rapidly, all market analysis and trading strategies need to be dynamically adjusted. All views, analysis models, and operation strategies involved in this article are derived from personal technical analysis, for personal trading log use only, and do not constitute any investment advice or operation basis. The market has risks, investment needs caution, DYOR.