Geopolitical Risks Persist, Bitcoin Becomes a Key Barometer?

marsbitОпубликовано 2026-04-20Обновлено 2026-04-20

Введение

Amid escalating geopolitical tensions in the Middle East, particularly around Iran and the Strait of Hormuz, and a sudden injection of nearly $200 billion in liquidity by the Federal Reserve and the U.S. Treasury, financial markets are caught in a tug-of-war between liquidity-driven gains and risk-off sentiment. Bitcoin is emerging as a key indicator in this environment due to its high sensitivity to liquidity shifts. It has historically acted as a leading signal—declining ahead of equity downturns and recovering before broader markets. Currently, its ability to break above the $80,000–$85,000 resistance level will test whether recent liquidity injections can outweigh geopolitical uncertainties. Failure to do so may signal underlying weaknesses, potentially in private credit or fading liquidity impact. Other indicators show mixed signals: The CNN Fear & Greed Index reflects greed, volatility indices are relatively calm, and major equity indices like the S&P 500 and Nasdaq have hit new highs. However, the situation remains fragile, with Iran-related risks capable of swiftly reversing sentiment. The key question is whether liquidity or geopolitical risk will dominate market pricing in the near term.

Editor's Note: Just as the market regained upward momentum driven by liquidity, new uncertainties have begun to accumulate on the other end. The situation in Iran has reversed again, and the risks in the Strait of Hormuz are emerging, bringing geopolitical conflicts back to the core variable of asset pricing. Within just a few days, the market has shifted from the single logic of "fund-driven" to a dual game of "liquidity vs. risk events."

The current market is in a tug-of-war between "liquidity-driven gains" and "risk shocks from the escalation of the Iran situation." On one hand, the Federal Reserve and the U.S. Treasury injected nearly $200 billion in liquidity into the financial system in a short period, driving a rapid rebound in stocks and risk assets; on the other hand, geopolitical uncertainty, private credit risks, and overheated sentiment continue to make the market fragile.

In this structure, Bitcoin's role is beginning to change. Unlike traditional risk assets, it is more sensitive to changes in liquidity and often gives signals first when the funding environment shifts. Historical experience shows that whether it was the early decline in October 2025 or the率先 stabilization in this round of rebound, Bitcoin has, to some extent, played the role of a "leading indicator."

Therefore, the question is no longer just "will the market rise," but—as liquidity continues to be released and war risks resurface, which force will dominate pricing? If funds cannot continuously hedge external shocks, the current gains may only be a temporary mismatch; if liquidity persists, the market may continue to rise amid fluctuations.

What matters next is not a single variable, but their relative strength. And Bitcoin may once again be the asset that provides the earliest answer.

Below is the original text:

"Oh, think twice, 'cause it's another day for you and me in paradise." —Phil Collins

For traders and investors, Friday was an unusual trading day. But Monday is still some time away, and the market is already brewing new variables—as early as Saturday morning, reports indicated that Iran's stance on the Strait of Hormuz issue had reversed, which could once again trigger market turbulence.

Additionally, Friday's rebound has pushed market sentiment indicators (see below) to a relatively fragile level, making the market more prone to corrections. This has plunged the market into a "tug-of-war": on one side is the massive liquidity injection discussed below, and on the other is the uncertainty brought by the potential reversal of the Iran war situation.

What Just Happened?

The impact of liquidity on the market is facing a test—against the potential further escalation of Iran war volatility.

Q: What happens when approximately $200 billion floods into the financial system almost simultaneously?

A: Asset prices experience a sharp "melt-up."

Lately, I've been focusing on four factors collectively suppressing the stock market: the Iran war, the liquidity crunch in the financial system that has persisted since January this year, widespread market pessimism, and insufficient understanding of the true state of the private credit market.

But last week, these factors were almost "all overturned": the liquidity crunch reversed, the Iran situation seemed to ease, and market pessimism once again proved to be—as it often is—a leading indicator of a potential stock market rebound.

Are we out of the woods? No one can be sure, as the Iran situation is heating up again. Moreover, if investors re-enter "panic mode," liquidity could dry up again. And we still lack a clear understanding of what is happening in the private credit market.

For now, however, let's focus on a relatively observable variable: liquidity.

Dual "Liquidity Tsunamis"

If you're wondering where the money driving the stock market rally over the past two weeks came from—think again: the answer is the Federal Reserve and the U.S. Treasury. Around April 15, the two injected approximately $200 billion into the financial system combined, providing traders with a "Tax Day buffer."

First, the first "barrel"—the Federal Reserve.

On April 15, the Fed injected nearly $110 billion into the market through repo operations (via Treasury bonds and mortgage-backed securities). This alone is not insignificant, but more crucially, the Fed is still injecting about $40 billion per month into the market through its Reserve Management Purchase (RMP) program.

The real focus is on the second "barrel"—the U.S. Treasury.

Drawing on Garret Baldwin's analysis, the U.S. Treasury injected approximately $140 billion to $200 billion into the market during the same period. That is, roughly speaking, without any formal quantitative easing (QE) announcement, the Fed and the Treasury quietly injected close to $240 billion in liquidity into the market.

It's not hard to understand why the stock market experienced an explosive rally.

The More Subtle Part: The Treasury's Operations

How did the Treasury accomplish this "covert operation"?

The key lies in an account—the "U.S. Treasury General Account" (TGA) held at the Fed. When the balance of this account rises, it usually signals tightening liquidity; when the balance falls, it means liquidity is being released.

According to Garret's calculations, around Tax Day, the balance of this "checking account" of the U.S. government at the Fed dropped from about $837 billion to about $697 billion. And on April 15, it rose back to about $924 billion.

The key is that about $140 billion of this had already flowed into the banking system before Tax Day, meaning the financial system was actually in a "liquidity-abundant" state before April 15.

Even more interestingly, the U.S. National Financial Conditions Index (NFCI, tracked weekly in this report) reversed its previous tightening trend in the latest data (April 10).

We pointed out this change in the daily report of "Smart Money Passport": "The Fed injected about $10.5 billion into the financial system that day, while the NFCI index fell for the first time since January 23, 2026. The combination of these two signals may indicate that the Fed has adjusted its liquidity-tightening stance."

The biggest suspense now is: will liquidity take the lead, or will a new round of escalation in the Iran war once again become the core variable for the market.

Bitcoin Starts to "Act": Why It's a Barometer of Liquidity

Bitcoin's performance next is crucial.

Because compared to stocks, Bitcoin is more sensitive to liquidity. Therefore, its performance after recently breaking through $75,000, and whether it can challenge the $80,000–$85,000 range, deserves close attention.

From a technical perspective, the resistance in the $80,000–$85,000 range is not strong. The volume-by-price (VBP) distribution in this range is relatively thin, indicating that no effective support was formed during the previous decline. Therefore, under normal circumstances, this level should not pose strong resistance during a price recovery.

If the rally fails here, it implies two things: first, the market lacks confidence in this rebound; second, there may be issues with liquidity itself. More importantly, if Bitcoin cannot break through this key range, it may also mean that the "liquidity tsunami" created by the Fed and the Treasury is rapidly receding.

If $200 billion in bank reserves are digested by the market in just a few weeks, it would be a dangerous signal. This could mean that risks are accumulating in the private credit market or elsewhere.

Don't forget, Bitcoin's decline in October 2025 accurately predicted the stock market's troubles in 2026. At the same time, Bitcoin stabilized weeks before the stock market bottomed and rallied ahead of time when the Fed and the Treasury released liquidity.

Against the backdrop of the evolving Iran situation and unresolved global risks, any weakness in Bitcoin should not be ignored.

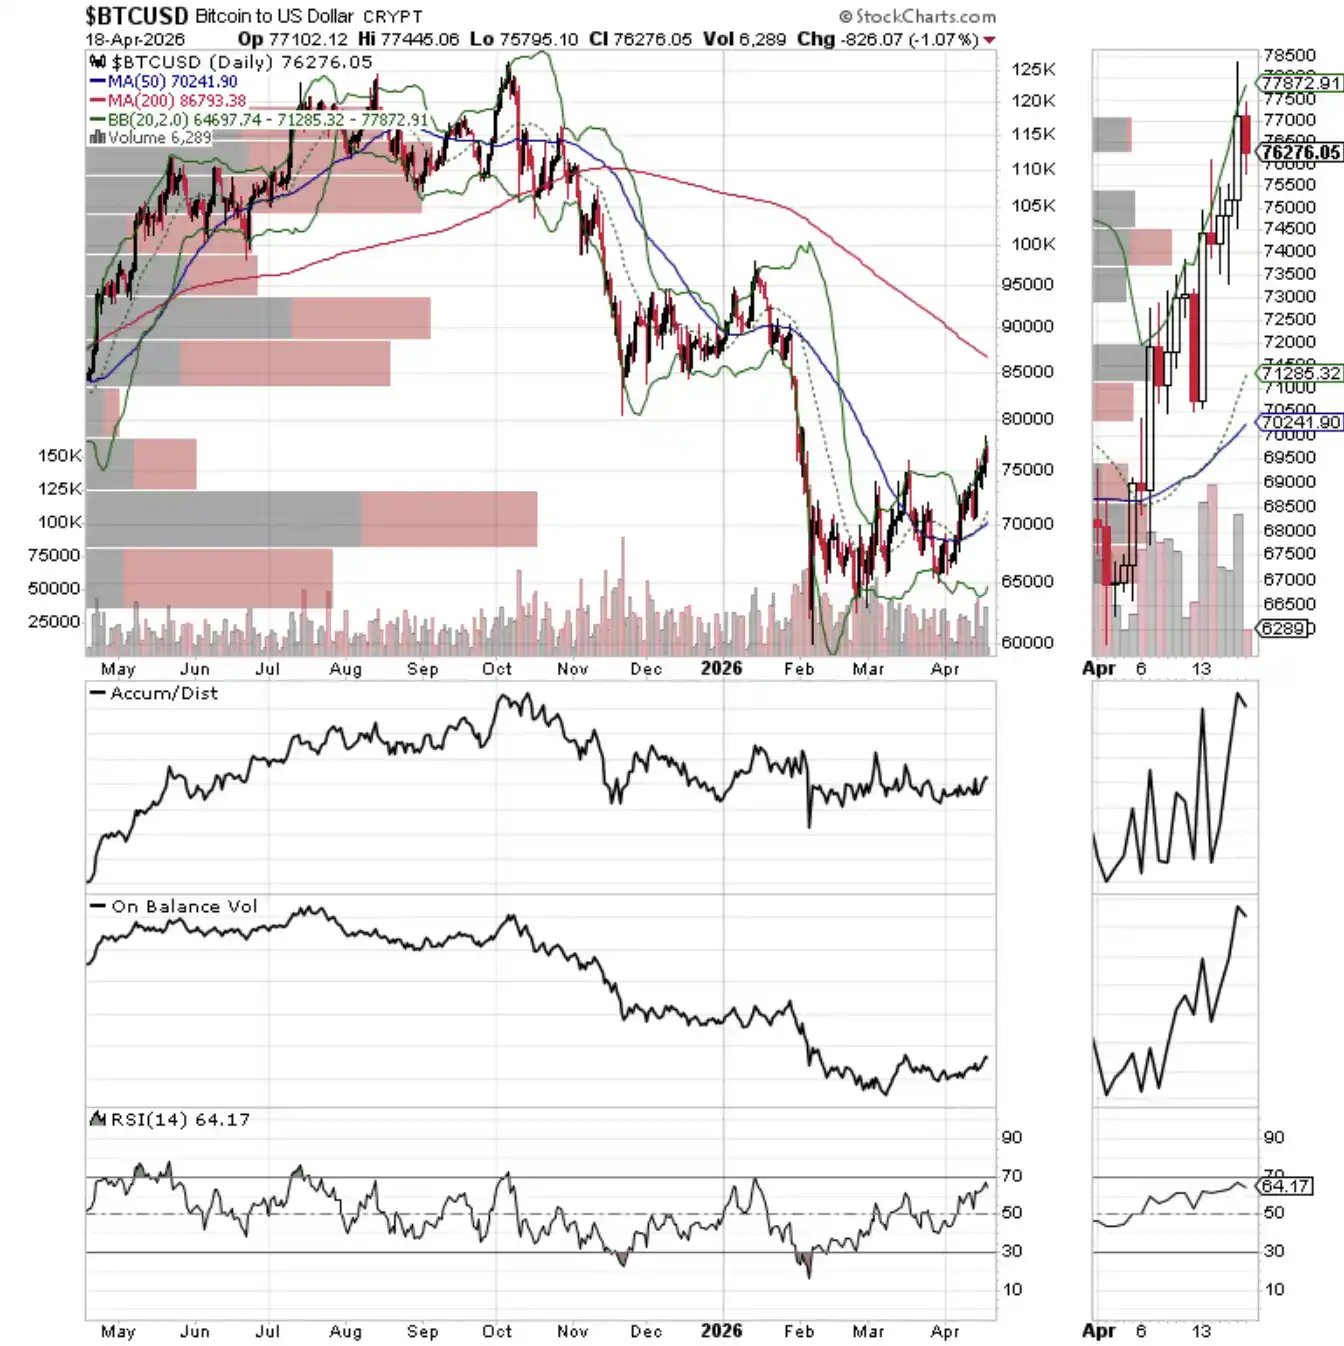
The $70,000–$75,000 range is a key support level.

Sentiment Summary: Market Suddenly Turns Fully Optimistic

The CNN Fear & Greed Index (GFI) closed at 68 on April 17, 2026, in the "Greed" zone.

CoinMarketCap's Crypto Fear & Greed Index was at 59 on Saturday morning, in the relatively high "Neutral" level.

The Chicago Board Options Exchange (CBOE) Total Put/Call Ratio was 0.65, with the index options P/C ratio closing at 0.82. The options market sentiment overall remains neutral, but as bullish sentiment heats up rapidly, it is gradually tilting towards the bearish area.

The CBOE Volatility Index (VIX) closed at 17.48, a relatively positive level. However, it could still rise back above 20 (often seen as the risk警戒线) in the short term.

It's worth noting that the VIX typically rises when traders heavily buy put options. Increased demand for puts forces market makers to hedge by selling stock index futures, thereby putting downward pressure on the market.

Conversely, when the VIX falls, it means reduced demand for puts, market sentiment turns optimistic, and more call buying often follows. This prompts market makers to buy stock index futures to hedge risks, increasing the probability of stock market gains.

Liquidity Watch

1. Bullish: Liquidity is easing

The National Financial Conditions Index (NFCI) released by the Federal Reserve, in its latest reading for March 27, 2026 (published April 10), was -0.47, down from the previous week's -0.44, indicating that financial conditions are easing and liquidity is improving.

A decline in NFCI is usually seen as a bullish signal, and a negative index means market liquidity is relatively abundant.

2. Bond yields retreat

U.S. Treasury yields fell in the latter part of the week, but could rise again depending on developments in Iran.

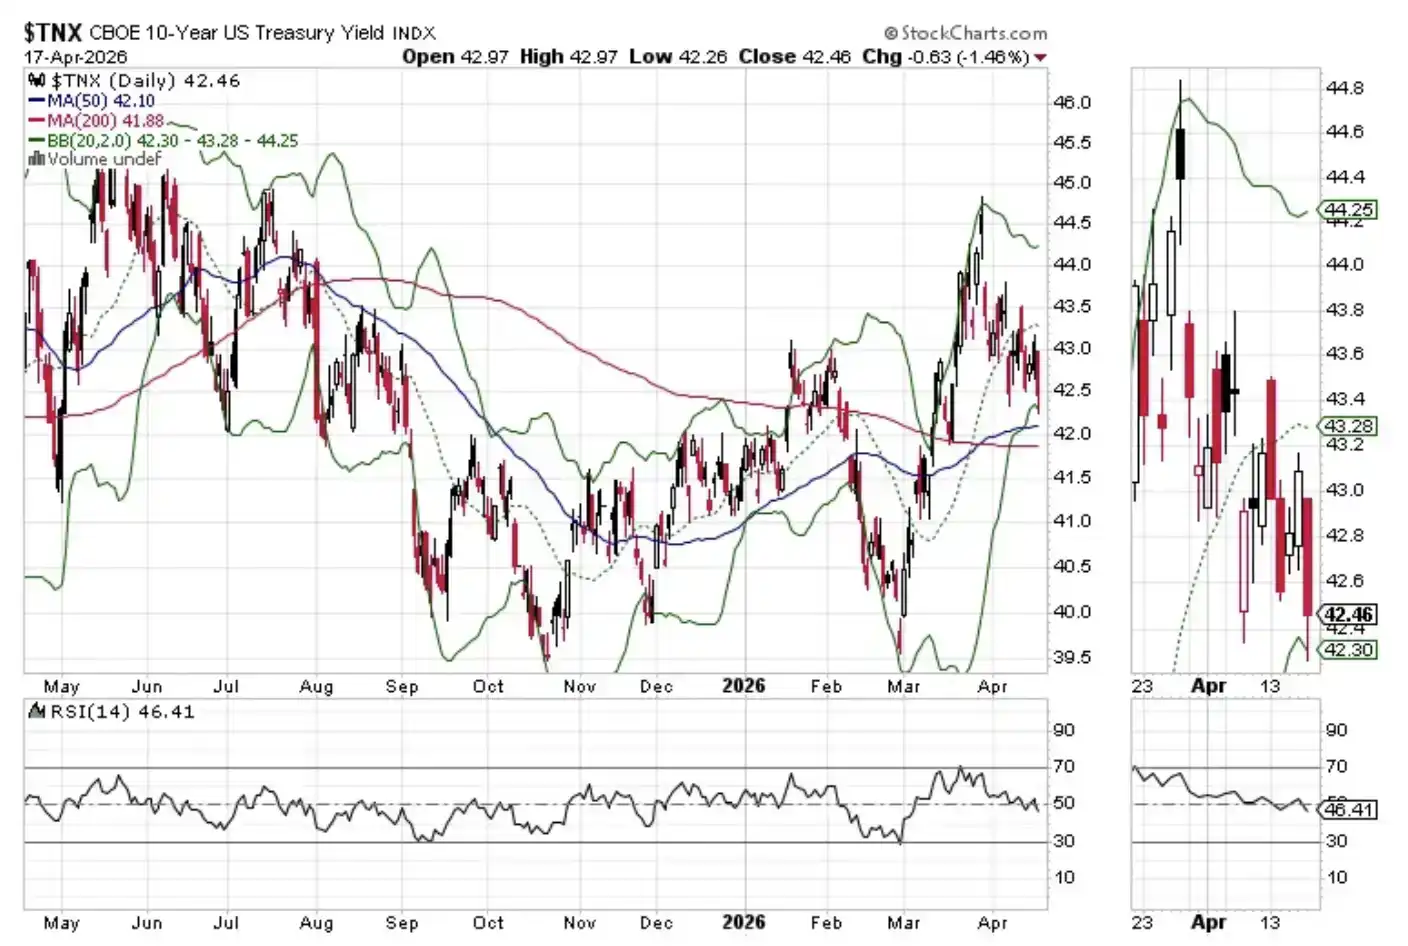
The U.S. 10-Year Treasury Yield closed the week below 4.3%, also falling below its 20-day moving average. A further break below the 200-day moving average would be seen as a bullish signal; conversely, a rise back above 4.5% could push yields back towards the highs near 4.6% seen in May 2025.

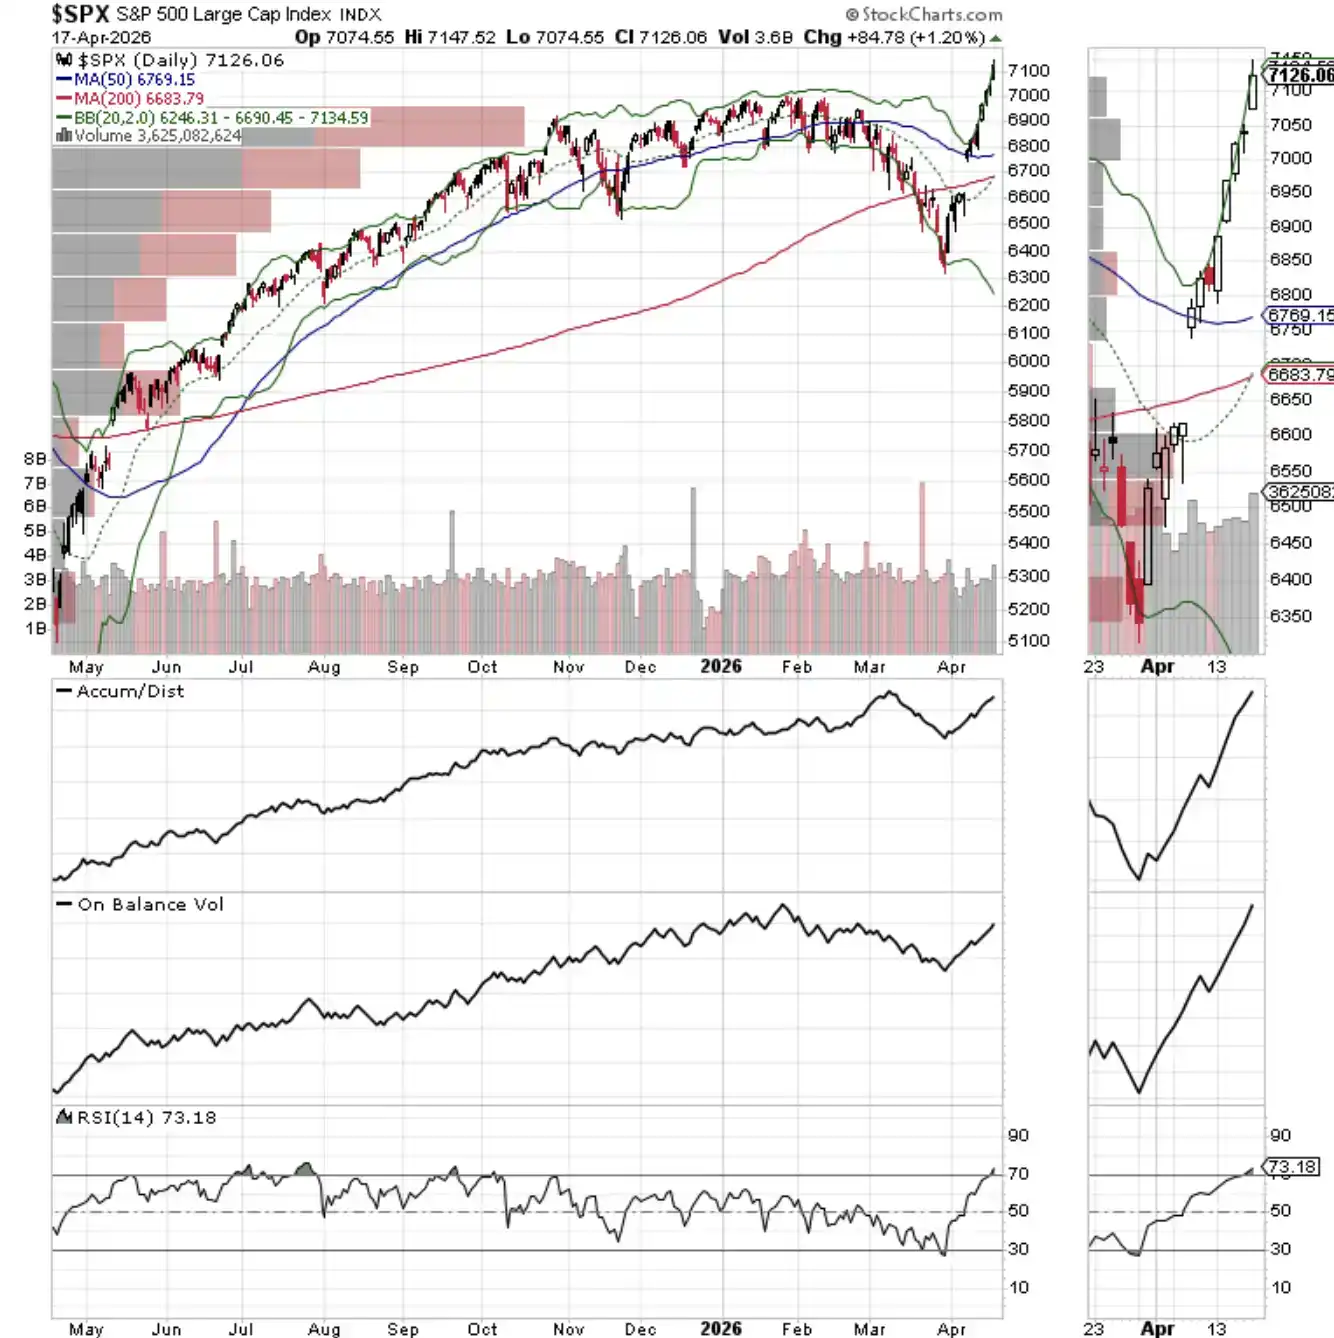
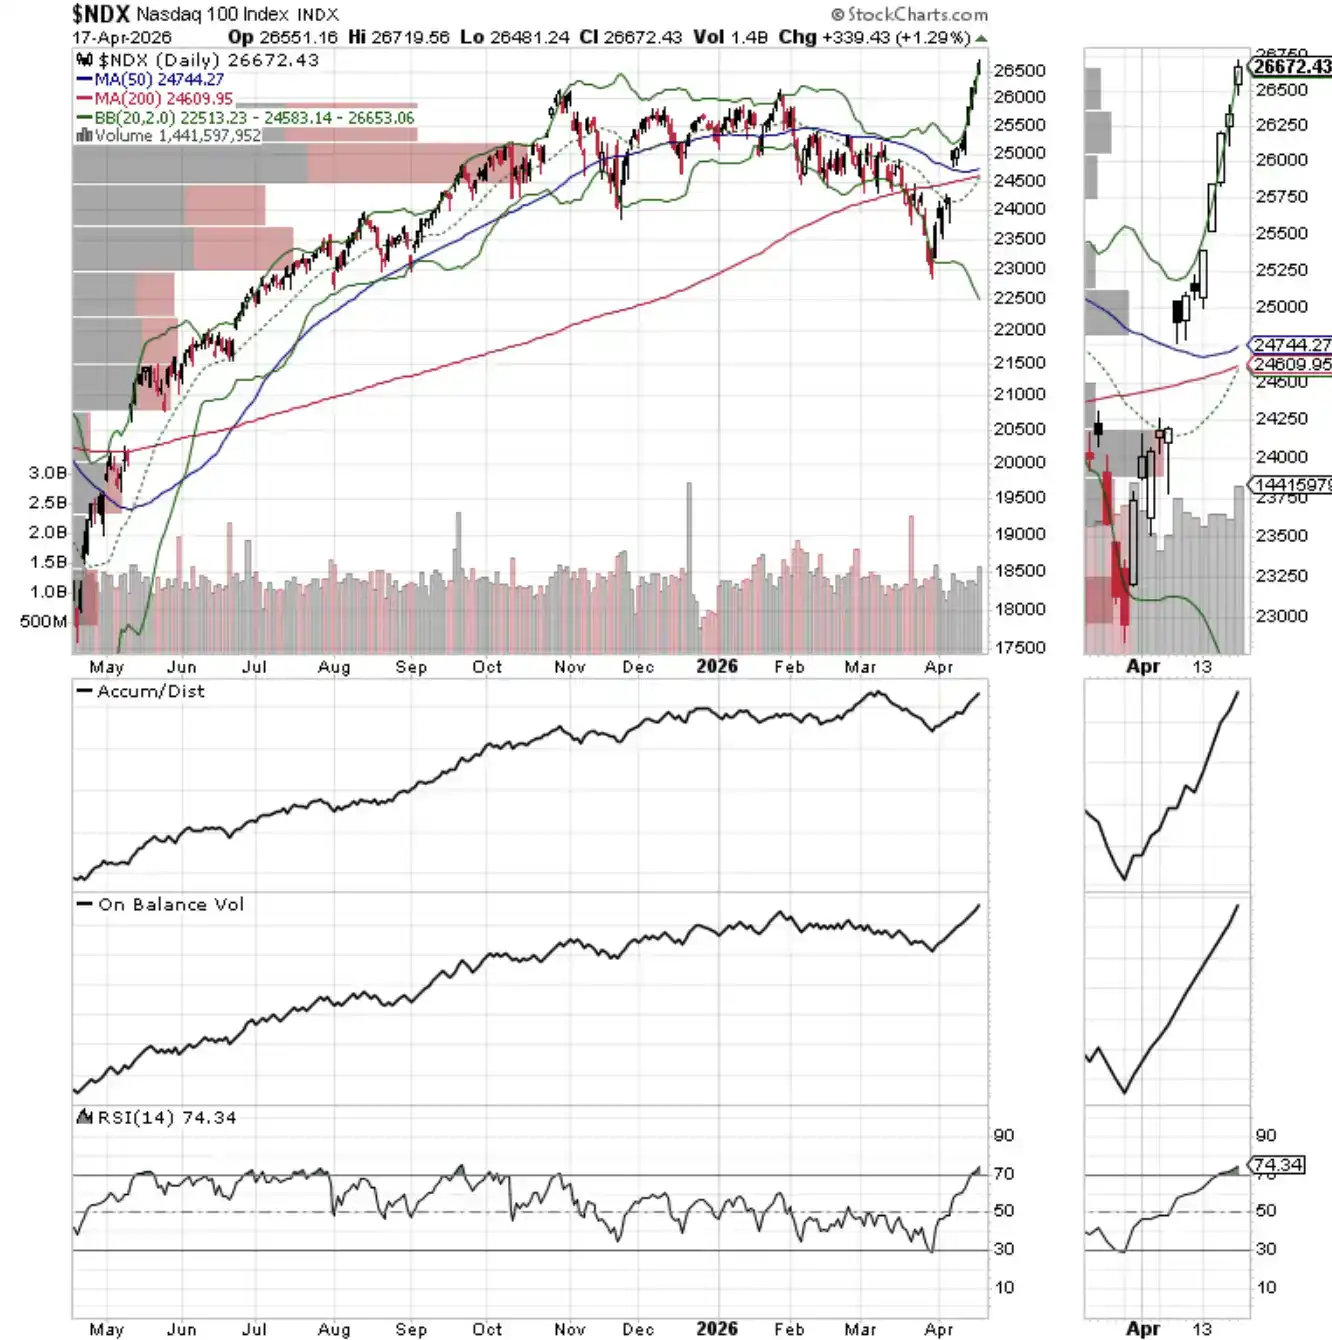
3. NYAD, SPX, and NDX all hit new highs simultaneously

The NYSE Advance-Decline Line hit a new high, confirming the new highs in the S&P 500 Index and the NASDAQ-100 Index, forming a confirmation signal.

The current uptrend is validated—but only for now. A break below the 20-day or 50-day moving average could quickly change the market situation.

The NASDAQ-100 Index hit a new high last week, with 26,000 points now becoming a short-term support level.

The S&P 500 Index hit a new high last week and broke through the 7000 point mark. 7000 points has now become a short-term support level.

Связанные с этим вопросы

QWhat is the main factor that has recently driven the sharp rise in stock and risk asset prices according to the article?

AThe main factor is the injection of nearly $200 billion in liquidity into the financial system by the Federal Reserve and the U.S. Treasury around April 15, which created a massive liquidity surge.

QWhy does the article suggest that Bitcoin is a key leading indicator for the market?

ABitcoin is more sensitive to liquidity changes than traditional risk assets. It often signals turning points in the funding environment first, as seen in its early decline in October 2025 and its率先企稳 (first to stabilize) in the current rebound.

QWhat is the 'TGA' (Treasury General Account) and how does its balance affect market liquidity?

AThe TGA is the U.S. Treasury's checking account at the Federal Reserve. When its balance decreases, it releases liquidity into the financial system; when its balance increases, it tightens liquidity.

QWhat key price level for Bitcoin does the article identify as a crucial test for market confidence and liquidity?

AThe $80,000–$85,000 range is identified as a crucial test. A failure to break through this level could indicate a lack of confidence in the rally or that the liquidity surge is fading.

QWhat new uncertainty has emerged that could challenge the market's liquidity-driven rally?

AThe uncertainty is a potential escalation in the Iran situation, specifically a reversal in Iran's stance on the Strait of Hormuz, which has reintroduced geopolitical risk as a core variable in asset pricing.

Похожее

Has the 'Digital Gold' Narrative for BTC Failed?

**Title: Has the "Digital Gold" Narrative for Bitcoin Failed?** The article argues that Bitcoin's "digital gold" narrative remains valid despite a recent sharp price decline (from a peak near $126k in Oct 2025 to briefly under $61k in Feb 2026). It presents a long-term investment framework based on three core points: **1. Viewing Bitcoin as an Asset:** Bitcoin is presented as a superior potential store of value compared to gold. Key arguments are its absolute scarcity (21 million cap), superior portability, and transparent auditability via its public ledger. While acknowledging its current use in early, volatile stages (~3-4% global adoption), the author draws parallels to the early, disruptive phases of the internet and e-commerce. **2. Understanding the Recent Downturn:** The current ~50% correction is framed as a predictable, consensus-driven cycle following its post-halving peak (the 2024 halving preceded the Oct 2025 high). A crucial factor is a historic "changing of hands": the influx of new institutional buyers via ETFs allowed early, low-cost holders (miners, OG believers) to take profits. The author notes that while severe, Bitcoin's historical drawdowns (e.g., 93% in 2011, 77% in 2021-22) have been progressively smaller, suggesting maturing holder structure and decreasing volatility over time. **3. The Long-Term Perspective:** The long-term thesis hinges on Bitcoin capturing a portion of gold's market value. With Bitcoin's market cap at ~$1.4 trillion (at $70k) versus gold's ~$20 trillion, significant upside potential exists if the "digital gold" narrative is partially realized. However, the author strongly cautions that short-term risks remain, the bottom is unpredictable, and high volatility is inherent. The real risk is not Bitcoin failing but poor personal position management (over-leverage, wrong capital) and a lack of deep understanding, which can force investors out during severe downturns. The conclusion uses Amazon's 95% crash post-2000 dot-com bubble and subsequent 42x recovery as an analogy. The ultimate question is not if Bitcoin's price will rise, but if an investor's strategy and conviction can withstand the volatility to see the long-term play out. The recent divergence (gold up, Bitcoin down) is posed not as a narrative failure, but as potential evidence of this ongoing, painful transition from a speculative asset to a mainstream allocation.

marsbit9 ч. назад

Has the 'Digital Gold' Narrative for BTC Failed?

marsbit9 ч. назад

Has BTC's 'Digital Gold' Narrative Failed?

The article discusses Bitcoin's "digital gold" narrative, its recent price drop, and long-term outlook through the perspective of "Jason". It argues the narrative is not a failure but that Bitcoin represents a superior, new asset class due to its fixed supply (21 million), portability, and auditability. The piece compares its current ~3-4% global adoption rate to early internet/e-commerce, suggesting significant growth potential. Regarding the 2025-2026 price decline (from ~$126k to briefly under $61k), the author views it as a predictable, consensus-driven sell-off within Bitcoin's ~4-year cycle post-halving, exacerbated by a major "handover" from early, low-cost holders to new institutional buyers via ETFs. A key observation is that historical peak-to-trough drawdowns have lessened over time (e.g., 93% in 2011 to ~50% in 2026), indicating maturing volatility as holder structure changes. For the long term, the author uses a simple framework: Bitcoin's total market cap (~$1.4T at $70k) is only about 7% of gold's (~$20T). Even capturing 30-50% of gold's value would imply substantial upside. However, the article strongly cautions against viewing this as investment advice, emphasizing extreme volatility and the critical importance of risk management, position sizing, and deep fundamental understanding to survive severe drawdowns. It concludes by drawing a parallel to Amazon's 95% crash in 2000 and subsequent 42x recovery, stressing that the key is surviving market cycles to realize long-term potential.

链捕手10 ч. назад

Has BTC's 'Digital Gold' Narrative Failed?

链捕手10 ч. назад

From Code to Cognition: A Ten-Thousand-Word Guide to the Evolution of the Robot Brain

"From Code to Cognition: The Evolution of Robot Brains" The journey of robotic intelligence has shifted dramatically from manually coded systems to AI-driven brains. For decades, robots relied on layered software stacks—perception, state estimation, planning, control—each handcrafted. While predictable, they lacked adaptability. The 2010s saw deep learning revolutionize perception (e.g., object detection) and control (via reinforcement learning), but learned skills remained narrow. The arrival of Large Language Models (LLMs) marked a turning point. LLMs acted as high-level planners, interpreting natural language instructions and generating sequences of actions for traditional robotic systems to execute. However, true integration came with Visual-Language-Action (VLA) models, which fused vision, language, and motion prediction into a single network. Pioneered by models like RT-2 and open-source projects like OpenVLA, VLAs enable robots to reason and act directly from visual input and commands. The most advanced humanoid robots now employ a "dual-brain" architecture: a slow-thinking, large VLA (System 2) for reasoning and planning, and a fast-reacting, small network (System 1) for high-frequency motion control, sometimes with an even lower-level System 0 for balance. This split balances cognition with the physics of real-time movement. Computation is split between onboard hardware (e.g., NVIDIA Jetson) for safety-critical control loops and cloud/edge servers for non-critical tasks like learning and interfaces. A crucial driver is the open-source ecosystem—models like GR00T and OpenVLA allow startups to build upon pre-trained brains and fine-tune them with their own data, accelerating development. Despite progress, current systems struggle with recovery from errors, sample inefficiency, and long-horizon tasks. This has spurred the rise of **World Models**—neural networks that predict the consequences of actions. By simulating possible futures before acting (like NVIDIA Cosmos or Meta V-JEPA), robots can plan, recover, and generalize better. This represents the next frontier: shifting intelligence from learned reactions to an internal model of physics and cause-and-effect. The field is rapidly evolving. While not yet at its "ChatGPT moment," the convergence of cheaper hardware, scalable simulation, and world models points toward robots that are increasingly capable, adaptive, and useful. The question is shifting from "what can robots do?" to "what *should* they do?"

marsbit10 ч. назад

From Code to Cognition: A Ten-Thousand-Word Guide to the Evolution of the Robot Brain

marsbit10 ч. назад

Торговля

Спот
Фьючерсы

Популярные статьи

Тест по Bitcoin Биткоина

HTX Learn: Изучите Bitcoin halving и Заработаете Токены USDT

3.1k просмотров всегоОпубликовано 2024.04.16Обновлено 2024.04.16

Тест по Bitcoin  Биткоина

Что такое $BITCOIN

ЦИФРОВОЕ ЗОЛОТО ($BITCOIN): Комплексный анализ Введение в ЦИФРОВОЕ ЗОЛОТО ($BITCOIN) ЦИФРОВОЕ ЗОЛОТО ($BITCOIN) — это проект на основе блокчейна, работающий в сети Solana, который стремится объединить характеристики традиционных драгоценных металлов с инновациями децентрализованных технологий. Хотя он носит имя Биткойн, часто называемого “цифровым золотом” из-за его восприятия как средства хранения ценности, ЦИФРОВОЕ ЗОЛОТО является отдельным токеном, предназначенным для создания уникальной экосистемы в ландшафте Web3. Его цель — позиционировать себя как жизнеспособный альтернативный цифровой актив, хотя детали его применения и функциональности все еще развиваются. Что такое ЦИФРОВОЕ ЗОЛОТО ($BITCOIN)? ЦИФРОВОЕ ЗОЛОТО ($BITCOIN) — это токен криптовалюты, специально разработанный для использования в блокчейне Solana. В отличие от Биткойна, который выполняет широко признанную роль хранения ценности, этот токен, похоже, сосредоточен на более широких приложениях и характеристиках. Примечательные аспекты включают: Инфраструктура блокчейна: Токен построен на блокчейне Solana, известном своей способностью обрабатывать высокоскоростные и недорогие транзакции. Динамика предложения: ЦИФРОВОЕ ЗОЛОТО имеет максимальное предложение, ограниченное 100 квадриллионами токенов (100P $BITCOIN), хотя детали о его обращающемся предложении в настоящее время не раскрыты. Утилита: Хотя точные функциональные возможности не описаны, есть указания на то, что токен может быть использован для различных приложений, потенциально связанных с децентрализованными приложениями (dApps) или стратегиями токенизации активов. Кто создатель ЦИФРОВОГО ЗОЛОТА ($BITCOIN)? На данный момент личность создателей и команды разработчиков, стоящих за ЦИФРОВЫМ ЗОЛОТОМ ($BITCOIN), остается неизвестной. Эта ситуация типична для многих инновационных проектов в области блокчейна, особенно тех, которые связаны с децентрализованными финансами и феноменом мем-криптовалют. Хотя такая анонимность может способствовать культуре, ориентированной на сообщество, она усиливает опасения по поводу управления и ответственности. Кто инвесторы ЦИФРОВОГО ЗОЛОТА ($BITCOIN)? Доступная информация указывает на то, что у ЦИФРОВОГО ЗОЛОТА ($BITCOIN) нет известных институциональных спонсоров или значительных венчурных капиталовложений. Проект, похоже, функционирует по модели пирингового взаимодействия, сосредоточенной на поддержке и принятии сообществом, а не на традиционных путях финансирования. Его активность и ликвидность в основном сосредоточены на децентрализованных биржах (DEX), таких как PumpSwap, а не на устоявшихся централизованных торговых платформах, что еще больше подчеркивает его подход, ориентированный на grassroots. Как работает ЦИФРОВОЕ ЗОЛОТО ($BITCOIN) Операционные механизмы ЦИФРОВОГО ЗОЛОТА ($BITCOIN) можно подробно описать на основе его дизайна блокчейна и характеристик сети: Механизм консенсуса: Используя уникальный механизм доказательства истории (PoH) Solana в сочетании с моделью доказательства доли (PoS), проект обеспечивает эффективную валидацию транзакций, что способствует высокой производительности сети. Токеномика: Хотя конкретные дефляционные механизмы не были подробно описаны, большое максимальное предложение токенов подразумевает, что оно может быть предназначено для микротранзакций или нишевых случаев использования, которые еще предстоит определить. Интероперабельность: Существует потенциал для интеграции с более широкой экосистемой Solana, включая различные платформы децентрализованных финансов (DeFi). Однако детали относительно конкретных интеграций остаются неуточненными. Хронология ключевых событий Вот хронология, которая подчеркивает значимые вехи, касающиеся ЦИФРОВОГО ЗОЛОТА ($BITCOIN): 2023: Первоначальное развертывание токена происходит в блокчейне Solana, отмеченное его адресом контракта. 2024: ЦИФРОВОЕ ЗОЛОТО приобретает видимость, когда оно становится доступным для торговли на децентрализованных биржах, таких как PumpSwap, позволяя пользователям обменивать его на SOL. 2025: Проект наблюдает спорадическую торговую активность и потенциальный интерес к инициативам, возглавляемым сообществом, хотя на данный момент не зафиксировано никаких значительных партнерств или технических достижений. Критический анализ Сильные стороны Масштабируемость: Основная инфраструктура Solana поддерживает высокие объемы транзакций, что может повысить полезность $BITCOIN в различных сценариях транзакций. Доступность: Потенциально низкая цена торговли за токен может привлечь розничных инвесторов, способствуя более широкому участию благодаря возможностям дробного владения. Риски Отсутствие прозрачности: Отсутствие публично известных спонсоров, разработчиков или процесса аудита может вызвать скептицизм относительно устойчивости и надежности проекта. Волатильность рынка: Торговая активность сильно зависит от спекулятивного поведения, что может привести к значительной волатильности цен и неопределенности для инвесторов. Заключение ЦИФРОВОЕ ЗОЛОТО ($BITCOIN) является интригующим, но неоднозначным проектом в быстро развивающейся экосистеме Solana. Хотя он пытается использовать нарратив “цифрового золота”, его отход от установленной роли Биткойна как средства хранения ценности подчеркивает необходимость более четкого различения его предполагаемой утилиты и структуры управления. Будущее принятие и усвоение, вероятно, будут зависеть от решения текущей непрозрачности и более четкого определения его операционных и экономических стратегий. Примечание: Этот отчет охватывает синтезированную информацию, доступную на октябрь 2023 года, и с тех пор могут произойти события.

99 просмотров всегоОпубликовано 2025.05.13Обновлено 2025.05.13

Что такое $BITCOIN

Fractal Bitcoin: масштабирование Биткоина с помощью рекурсивной системы

Fractal Bitcoin — масштабное Layer-1-решнение, созданное на базе кода Биткоина, позволяющего достигать бесконечного масштабирования с помощью рекурсивного подхода.

2.3k просмотров всегоОпубликовано 2025.06.30Обновлено 2025.06.30

Fractal Bitcoin: масштабирование Биткоина с помощью рекурсивной системы

Обсуждения

Добро пожаловать в Сообщество HTX. Здесь вы сможете быть в курсе последних новостей о развитии платформы и получить доступ к профессиональной аналитической информации о рынке. Мнения пользователей о цене на BTC (BTC) представлены ниже.

活动图片