Рыночная среда на этой неделе необычайно сложна — подписание сверхожидаемого соглашения между США и Ираном и открытие Ормузского пролива вызвали масштабную переоценку глобальных активов. Именно в моменты резких колебаний на эмоциональном фоне структурный анализ раскрывает свою наибольшую ценность. Чем больше шума, тем важнее фреймворк.
На этой неделе мы сосредоточимся на двух основных направлениях: каким будет результат игры вокруг подтверждения отката после того, как BTC преодолел уровень в 65 000 долларов, и как это определит дальнейшее движение; и принесет ли зона сопротивления 62,5–64,57 доллара новые краткосрочные возможности для HYPE после завершения корректировки в четыре волны.
Полный анализ структуры движения, прогнозы по рынку и торговые стратегии см. в основном тексте.
Ключевые выводы по сделкам на неделю:
• Анализ структуры движения BTC на часовом таймфрейме. (Подробности см. в Части 1)
• Прогноз по BTC на неделю и стратегии для среднесрочных и краткосрочных операций. (Подробности см. в Части 2)
• Анализ структуры движения HYPE на часовом таймфрейме. (Подробности см. в Части 3)
• Прогноз по HYPE на неделю и стратегия для краткосрочных операций. (Подробности см. в Части 4)
Подтверждение рыночными данными торговых стратегий и ключевых выводов прошлой недели:
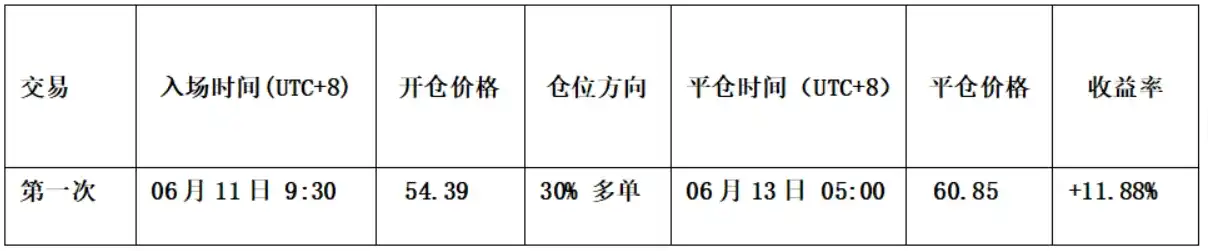
• Результат краткосрочной сделки по HYPE: на прошлой неделе была проведена одна краткосрочная операция на покупку (плечо x1) с доходностью около 11,88%. (Подробности см. в Таблице 1)
• Подтверждение прогноза движения BTC: в статье прошлой недели мы указывали, что после кратковременного падения ниже ключевого уровня в 60 000 долларов цена получит поддержку и произойдет краткосрочный отскок для подтверждения эффективности пробоя важного уровня. Текущее движение рынка подтверждает наш предыдущий прогноз.
• Подтверждение прогноза движения HYPE: в статье прошлой недели мы указывали, что когда цена HYPE вернется к тестированию ключевой зоны поддержки 55–57 долларов и появятся сигналы остановки падения и стабилизации, в сочетании с сигналами дна от двух моделей, можно рассмотреть возможность легкой покупки. Текущее движение рынка полностью соответствует нашему прогнозу.
1. Глубокий анализ структуры движения биткоина на часовом таймфрейме
График BTC, свечи 4 часа
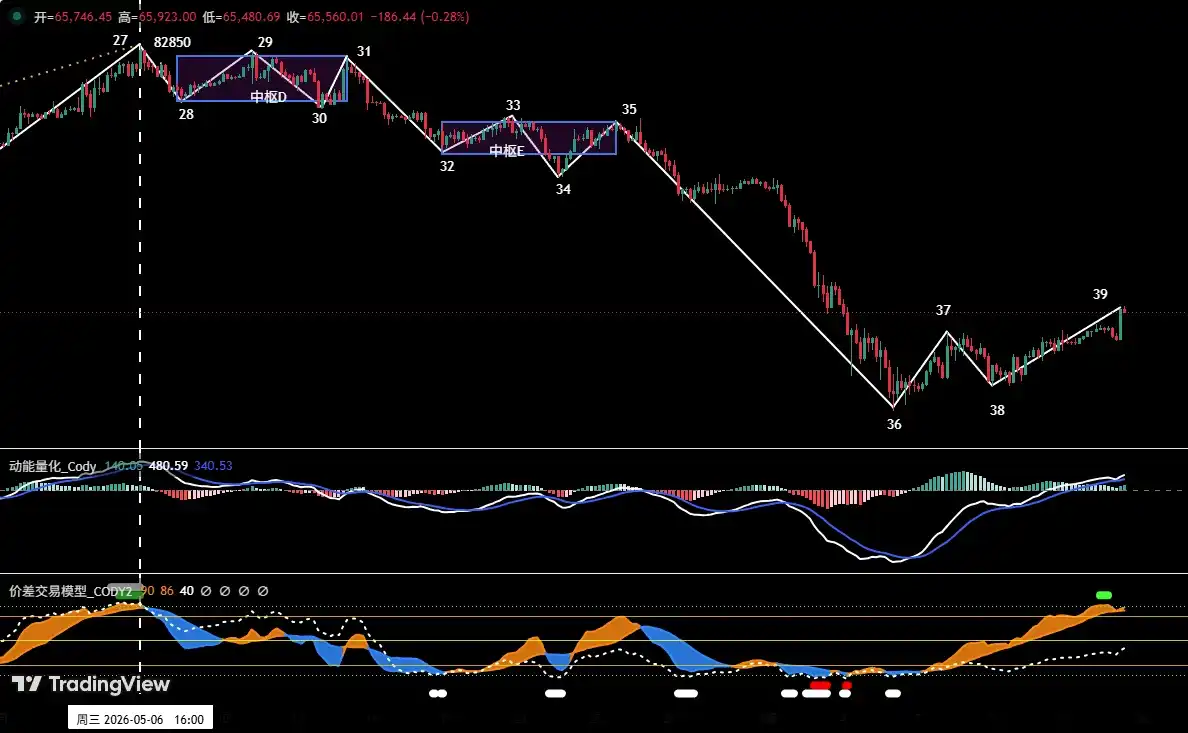
Рисунок 1
1. Как показано на (Рисунке 1), с момента коррекции от максимума 82 850 долларов 6 мая, на 4-часовом графике можно детально выделить корректировочную структуру из 12 волн. Она включает два нисходящих ценовых центра: центр D и центр E. Общая структура четкая, демонстрируя типичную сложную корректирующую форму.
2. С точки зрения структуры движения на 4-часовом таймфрейме, в настоящее время развивается отскок 38-39 волны. Текущая цена преодолела уровень в 65 000 долларов. Если впоследствии будет подтверждена эффективность пробоя, то следующим важным уровнем сопротивления для отскока станет зона 69 500–70 500 долларов.
2. Прогноз по биткоину на неделю и торговая стратегия
1. Прогноз движения BTC на неделю:
Ключевая идея недели: следить за результатом подтверждения откатом пробоя уровня в 65 000 долларов.
• Если при откате цена не удержит уровень, рынок может вновь протестировать ключевой интервал поддержки 60 000–62 000 долларов.
• Если уровень удержится эффективно, следующим вызовом станет ключевая зона давления 69 500–70 500 долларов. Эта область станет важным регионом для планирования нами среднесрочных сделок на продажу.
2. Ключевые уровни сопротивления:
• Первая зона сопротивления: область 69 500–70 500 долларов (район высокой концентрации сделок в прошлом)
• Вторая зона сопротивления: область 72 500–74 500 долларов (район высокой концентрации сделок в прошлом)
3. Ключевые уровни поддержки:
• Первый уровень поддержки: около 65 000 долларов
• Второй уровень поддержки: область 59 000–60 000 долларов (важный уровень поддержки в прошлом)
• Третий уровень поддержки: около 55 000 долларов (важный уровень поддержки в прошлом)
4. Торговая стратегия на неделю (исключая влияние внезапных новостей)
1. Среднесрочная стратегия:
График BTC, дневные свечи: (Модель мониторинга позиций)
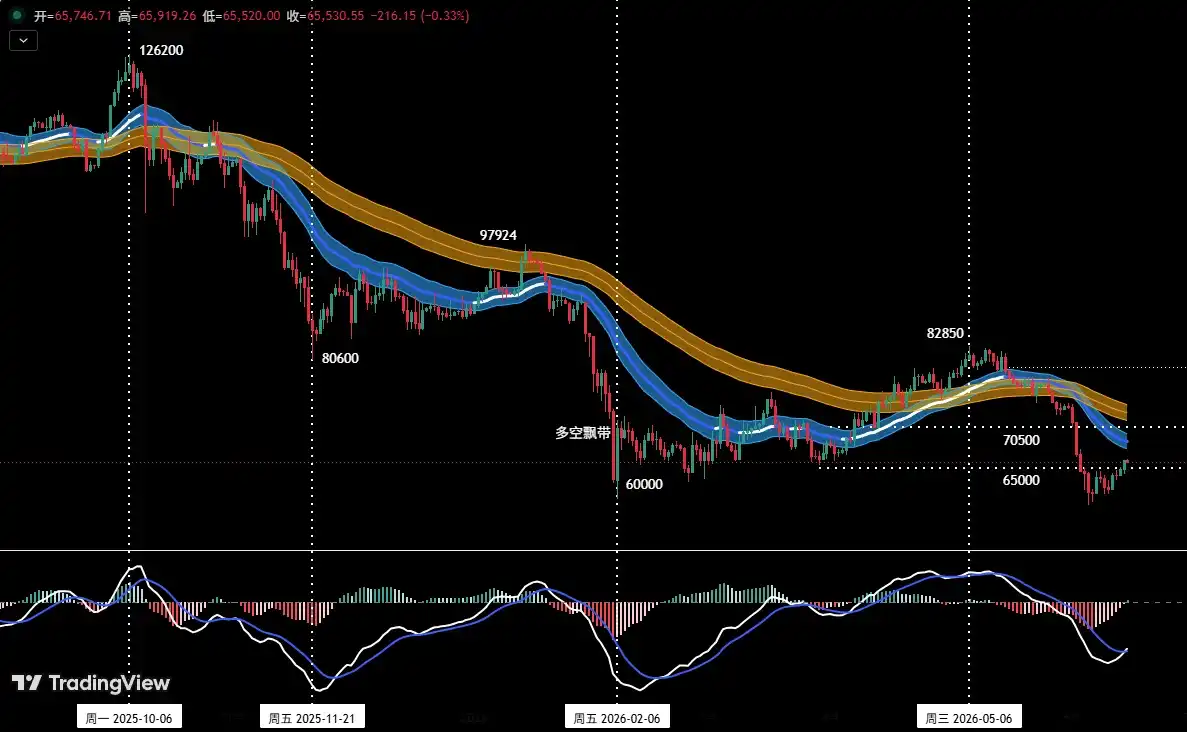
Рисунок 2
Модель мониторинга позиций: Как показано на (Рисунке 2), текущая цена эффективно пробила "канал быков и медведей", техническая картина перешла в формат, определяемый медведями. На прошлой неделе рынок не соответствовал нашему плану входа (в сделку на продажу), поэтому среднесрочные позиции пока пусты.
На этой неделе, в зависимости от результата борьбы быков и медведей за уровень в 65 000 долларов, можно постепенно наращивать короткие позиции, следуя трехступенчатой стратегии:
• Добавление в зоне сильного сопротивления: Если цена успешно закрепится в области 65 000 долларов, и последующий отскок до зоны 69 500–70 500 долларов покажет четкие признаки сопротивления, можно рассмотреть среднесрочный вход (в сделку на продажу), общий объем позиции должен контролироваться ниже 60%.
• Продажа по пробитию поддержки: Если цена потеряет поддержку на уровне 65 000 долларов и покажет сигнал эффективного пробоя, можно предварительно открыть среднесрочную короткую позицию объемом 30%.
• Продажа вслед за пробоем: Если цена потеряет поддержку на уровне 65 000 долларов и эффективно пробьет интервал поддержки 59 000–60 000 долларов, можно нарастить короткую позицию, общий объем позиции должен контролироваться ниже 60%.
2. Краткосрочная стратегия: используя 30% капитала, установите стоп-лосс и ищите возможности для сделок на "разнице цен" на основе уровней поддержки и сопротивления. (В качестве операционного цикла используйте 30-минутные/60-минутные таймфреймы).
3. В краткосрочных операциях, для динамического реагирования на сложную эволюцию рынка, мы заранее подготовили два конкретных плана действий: A/B.
• План A: Вход в зоне сильного сопротивления.
• Открытие позиции: Если цена успешно закрепится в области 65 000 долларов, и последующий отскок до уровня около 69 500–70 500 долларов покажет сигналы замедления роста в сочетании с сигналами вершины от количественной модели, можно войти в короткую позицию объемом до 30%.
• Управление рисками: Установите начальный стоп-лосс.
• Закрытие позиции: Когда коррекция приблизится к важному уровню поддержки в сочетании с сигналами модели, можно постепенно закрывать позицию для фиксации прибыли.
• План B: Эффективный пробой поддержки, продажа по тренду.
• Открытие позиции: Если цена потеряет поддержку на уровне 65 000 долларов и покажет сигнал эффективного пробоя, можно последовать тренду и открыть короткую позицию объемом до 30%.
• Управление рисками: Установите начальный стоп-лосс.
• Закрытие позиции: Когда падение достигнет важного уровня поддержки в сочетании с сигналами модели, можно постепенно закрывать позицию для фиксации прибыли.
3. Анализ структуры движения HYPE на часовом таймфрейме
График HYPE, свечи 4 часа
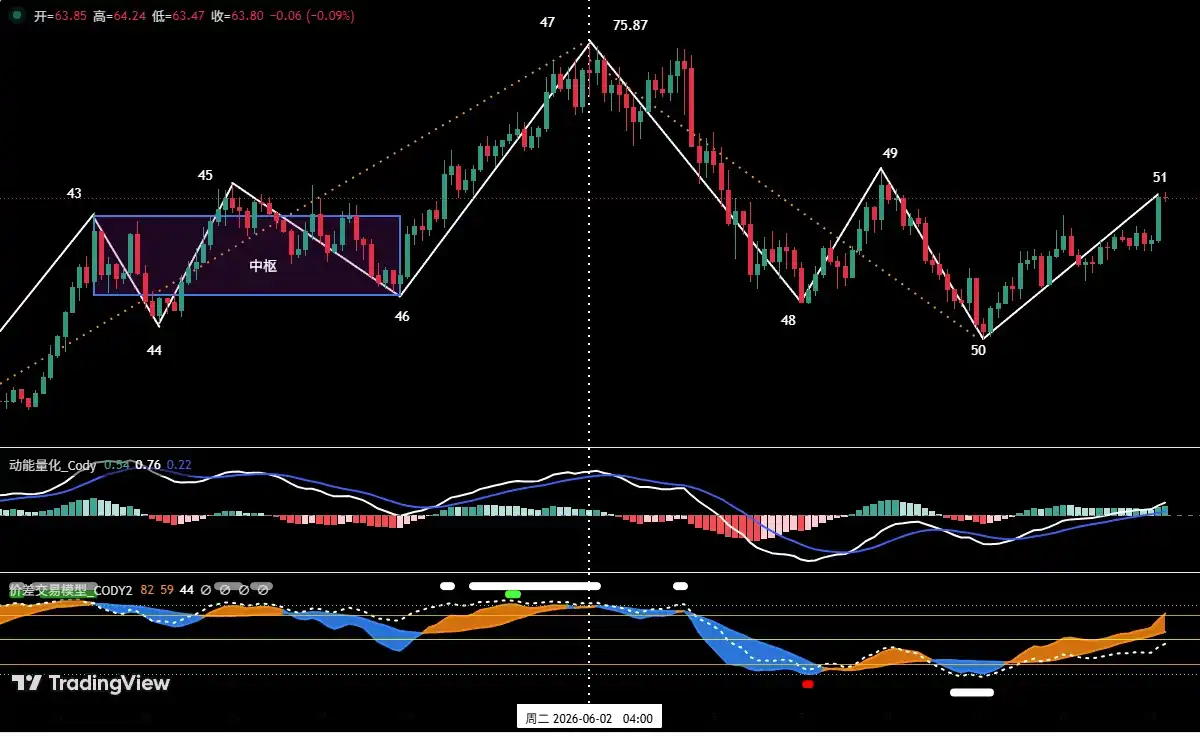
Рисунок 3
1. Как показано на (Рисунке 3), на 4-часовом таймфрейме, с момента коррекции от максимума 75,87 доллара 2 июня, движение HYPE можно детально разделить на корректировочную структуру из четырех волн: (47-48), (48-49), (49-50), (50-51).
2. В настоящее время цена HYPE стабилизировалась и пошла вверх от зоны поддержки в 52 доллара, находясь в процессе отскока (волны 50-51). Сопротивление выше находится в зоне 62,5–64,57 доллара. Если (точка 51) сформирует максимум в этой области (вероятность построения "нисходящего ценового центра" в этой позиции довольно высока), то цена продолжит движение вниз в поисках сильной поддержки.
4. Прогноз по HYPE на неделю и стратегия для краткосрочных операций
1. Прогноз движения HYPE на неделю:
1. Ключевые уровни сопротивления:
• Первый уровень сопротивления: зона 62,5–64,57 доллара;
• Второй уровень сопротивления: зона 68–70 долларов;
2. Ключевые уровни поддержки:
• Первый уровень поддержки: зона 52–55,5 доллара;
• Второй уровень поддержки: зона 47–49 долларов;
Ключевая идея по HYPE на неделю:
• Наблюдать за эффектом сопротивления в зоне 62,5–64,57 доллара и за тем, в какой позиции сформируется максимум цены "точки 51".
2. Стратегия краткосрочных операций по HYPE на неделю: (Покупка на поддержке)
Краткосрочные сделки с HYPE на этой неделе должны следовать стратегии "покупка на спадах, избегать покупки на росте".
Краткосрочная стратегия: Тестовая покупка при стабилизации в зоне поддержки
Когда цена HYPE вернется к тестированию ключевой зоны поддержки 52–54,5 доллара или более глубокой зоны 47–49 долларов, и появятся сигналы остановки падения и стабилизации, в сочетании с сигналами дна от двух моделей, можно рассмотреть легкую тестовую покупку. Объем позиции должен строго контролироваться ниже 30%, и необходимо строго соблюдать дисциплину стоп-лосса.
5. Разбор сделок с HYPE
1. Обзор краткосрочной операции: (см. Таблицу 1)
Мы строго следовали плану операции, основываясь на торговых сигналах, выдаваемых самостоятельно построенными "Моделью торговли на разнице цен" и "Количественной моделью импульса", и на прошлой неделе выполнили одну краткосрочную операцию (на покупку) с прибылью 11,88%.
2. Сводка деталей краткосрочной сделки с HYPE: (Плечо x1)
3. Разбор краткосрочной сделки: (см. Рисунок 4)
1. Стратегия входа:
• Ранее была пройдена относительно полная структура нисходящей коррекции;
• Наша собственная "Модель торговли на разнице цен" заранее выдала сильный сигнал предупреждения о дне (красные и белые точки на графике);
• Наша собственная "Количественная модель импульса" выдала сигнал дивергенции по импульсу на дне;
На основе этих трех пунктов мы открыли позицию на покупку объемом 30% около цены 54,39 доллара.
2. Стратегия выхода:
• Когда цена поднялась до уровня около 62,5 доллара, появились сигналы сопротивления;
• Наша собственная "Модель торговли на разнице цен" заранее выдала сигнал предупреждения о вершине (белые точки на графике);
• Наша собственная "Количественная модель импульса" выдала сигнал дивергенции по импульсу на вершине;
Следовательно, мы закрыли всю позицию около цены 60,85 доллара.
3. Итог: Успешная прибыль от этой сделки составила около 11,88%.
График HYPE, 30-минутные свечи: (Модель Количественной оценки импульса + Модель Торговли на разнице цен)
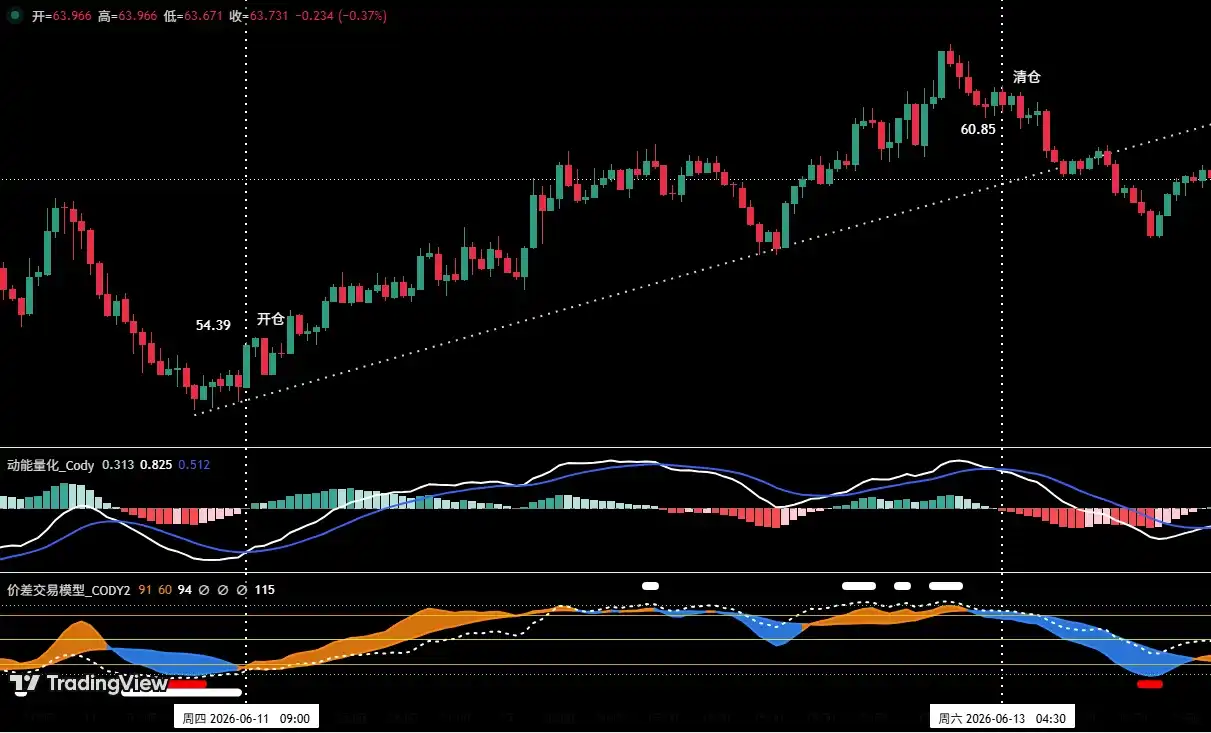
Рисунок 4 (Иллюстрация краткосрочной сделки)
6. Особое примечание:
1. При открытии позиции: Немедленно установите начальный стоп-лосс.
2. При достижении прибыли в 1%: Переместите стоп-лосс на цену открытия (точку безубыточности), чтобы обеспечить безопасность капитала.
3. При достижении прибыли в 2%: Переместите стоп-лосс на уровень прибыли в 1%.
4. Постоянное отслеживание: Впоследствии, каждый раз, когда цена приносит дополнительную прибыль в 1%, стоп-лосс синхронно перемещается на 1%, динамически защищая и фиксируя прибыль.
Финансовые рынки меняются мгновенно, весь анализ рынка и торговые стратегии требуют динамической корректировки. Все мнения, аналитические модели и операционные стратегии, затронутые в этой статье, основаны на личном техническом анализе и предназначены только для личного журнала сделок, не являются инвестиционной рекомендацией или основой для операций. Рынки сопряжены с рисками, инвестиции требуют осторожности, не принимайте решения на основе этой информации.