Ключевые моменты:
• Глубокий анализ структуры движения HYPE в нескольких таймфреймах: Еженедельное отслеживание. (Подробности в первой части)
• Проверка эффективности исполнения стратегии для BTC (краткосрочной): На прошлой неделе биткоин следовал заданной краткосрочной стратегии, выполнил одну краткосрочную операцию шорт (плечо 1x), успешно получив прибыль около 6.41%. (Подробности см. в Таблице 1)
• Проверка эффективности исполнения стратегии для BTC (среднесрочной): На прошлой неделе биткоин следовал заданной среднесрочной стратегии, продолжая удерживать позицию шорт, открытую около 89,000 долларов (плечо 1x). На момент закрытия прошлой недели (около 65,971 долларов) прибыль составила примерно 25.88%, максимальная прибыль за период достигла около 32.58%.
• Проверка ключевой точки зрения (краткосрочной): На прошлой неделе биткоин продолжил сохранять слабый боковой тренд в диапазоне. Текущее движение соответствует ожиданиям.
• Прогноз движения курса BTC на текущей неделе и стратегии для среднесрочных и краткосрочных операций.
Далее подробно回顾行情预判、策略执行与具体交易过程。
一、Анализ структуры движения HYPE в нескольких таймфреймах и разбор краткосрочных операций:
Дневной график HYPE
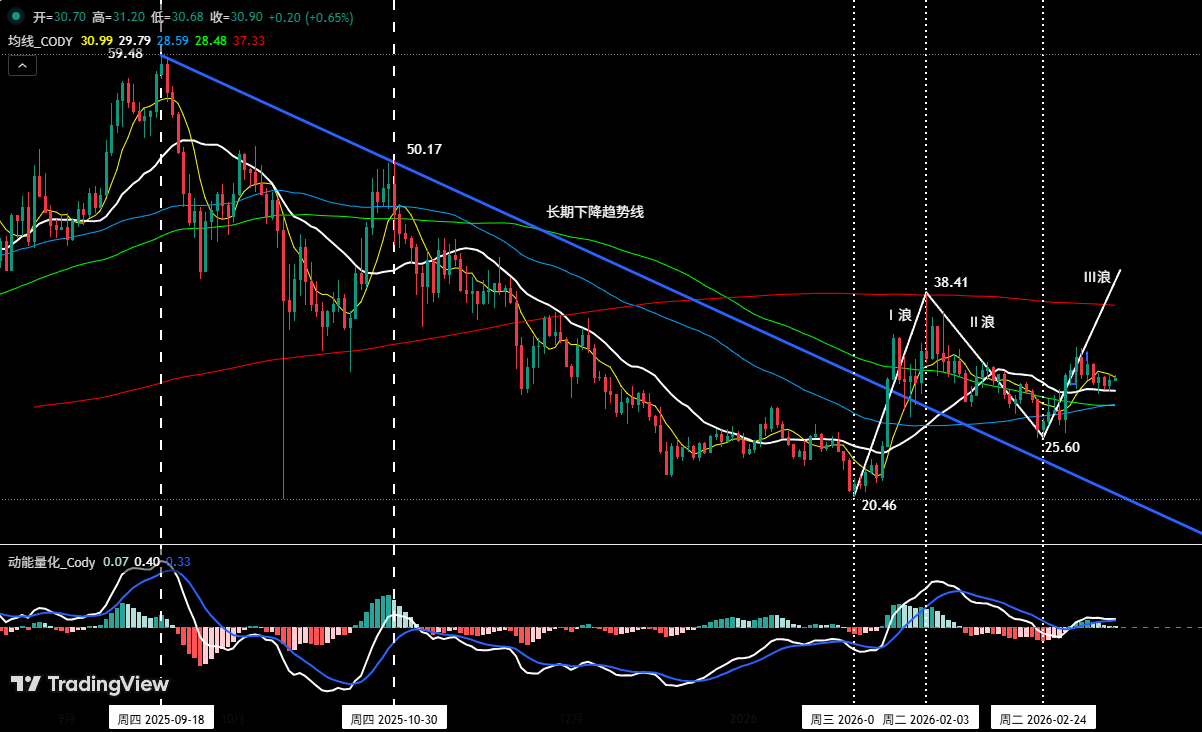
Рисунок 1
В еженедельном обзоре от 22 февраля мы впервые указали на инвестиционную возможность HYPE, четко обозначив возможность потенциального основного восходящего движения (волны III) в ближайшее время. В обзоре от 1 марта мы вновь подчеркнули: низ 24 февраля в 25.60 долларов, возможно, является точкой старта волны III, которая сейчас развивается.
1、Анализ структуры движения на крупных таймфреймах (см. Рис. 1):(На основе эволюции行情 с 21 января)
• Волна I (импульсная): С низа 20.46 долларов 21 января до пика 38.41 доллара 3 февраля, длительность 14 дней, максимальный рост за период достиг 87.73%.
• Волна II (корректирующая): С пика 38.41 доллара 3 февраля до низа 25.60 долларов 24 февраля, длительность 20 дней, максимальное падение за период составило 33.35%.
• Волна III (потенциальная импульсная): С низа 25.60 долларов 24 февраля по настоящее время, движение продолжается, длительность 13 дней, максимальный рост за период достиг 31.5%.
• С точки зрения системы скользящих средних: С начала восходящего движения 24 февраля произошел эффективный прорыв сопротивления multiple скользящих средних, текущая цена тестирует ключевую среднесрочную скользящую среднюю (например, 21-дневную) на предмет силы поддержки после прорыва. По объему наблюдается здоровое состояние «рост при увеличении объема, откат при снижении объема», соотношение цены и объема хорошее.
• С точки зрения модели量化 кинетической энергии: Линия кинетической энергии на дневном таймфрейме продолжает работать выше нулевой оси, что указывает на четкий восходящий тренд. Текущее движение находится в фазе накопления и консолидации动能.
2、 Анализ структуры движения на малых таймфреймах:(На основе行情 с 2 марта)
Часовой график HYPE
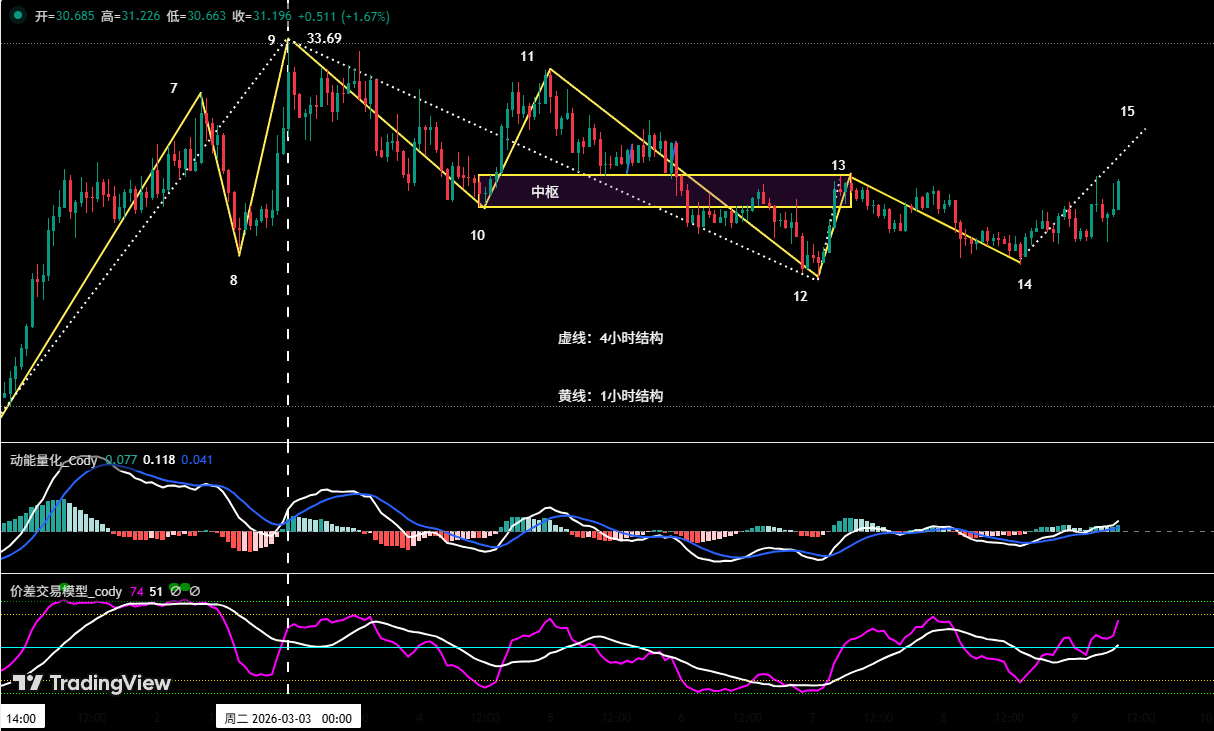
Рисунок 2
На (Рис. 2) видно, что восходящее движение HYPE, начавшееся с низа 24 февраля, достигло пика 33.69 доллара 2 марта и вошло в фазу коррекции. Ниже мы подробно изучим сигналы завершения этой коррекции и потенциальные точки развола, начиная со структуры движения на часовом таймфрейме.
• Разделение внутренней структуры:(С пика 33.69 доллара 2 марта по настоящее время)
Может быть细分на на 5-сегментную структуру: 9-10, 10-11, 11-12, 12-13, 13-14, формирующую полную корректирующую структуру.
• Построение центра: В 5-сегментной структуре, 9-10 - входящий сегмент,13-14 - исходящий сегмент, 10-11, 11-12, 12-13 эти 3 сегмента формируют центральную структуру.
• Формирование точки развола коррекции и判断 о成立: На (Рис. 2) видно, что между входящим и исходящим сегментами уже сформировался сигнал дивергенции, поэтому мы считаем, что вероятность завершения этой коррекции в точке 12 высока. Если восходящее движение, начавшееся из точки 12, сначала эффективно закрепится выше сопротивления 31.5 доллара, а затем突破 локального предыдущего пика 32.75 доллара, то вероятность завершения коррекции и начала нового восходящего движения значительно возрастет. (Особое强调: последующие коррекции HYPE не должны опускаться ниже цены точки 12 (около 29.44 долларов), иначе上述 вывод недействителен, и точка развола коррекции сместится)
3、Предупреждение о рисках роста HYPE: Движение HYPE, хотя и обладает независимостью, все же не может полностью脱离 общую среду биткоина. Если биткоин продолжит слабеть и跌破 ключевую поддержку (например, около 65,000 долларов), это может усилить давление продаж на всем рынке альткоинов, что повлияет на импульс отскока HYPE.
4、 Разбор краткосрочных операций с HYPE (плечо 1x):(03.02~03.08)
Мы прогнозируем, что HYPE на дневном таймфрейме находится в восходящем тренде. На прошлой неделе, следуя核心交易 стратегии «действовать в соответствии с трендом» и结合 анализ структуры коррекции на часовом таймфрейме, мы не открывали новых позиций (лонг) в этот период.
二、Обзор стратегий операций с биткоином на прошлой неделе и ключевых точек:(03.02~03.08)
1、Обзор краткосрочной стратегии:(см. Таблицу 1)
Мы строго следовали交易 сигналам, выдаваемым нашей собственной构建的 моделью торговли по разнице цен и моделью量化 кинетической энергии,并结合 прогноз рыночного движения, выполнили на прошлой неделе одну краткосрочную операцию (шорт), получив прибыль 6.41%.
1、Сводка деталей краткосрочных сделок с биткоином:(плечо*1x)
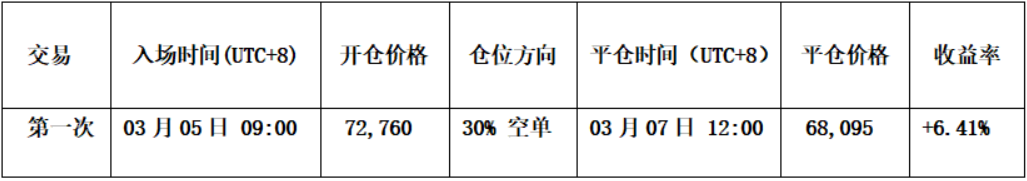
Таблица 1
2、Разбор краткосрочной сделки:(см. Рис. 3)
• Открытие: Отскок до важного уровня сопротивления около 74,500 долларов встретил сопротивление, одновременно модель торговли по разнице цен активировала сигнал предупреждения о вершине (зеленая точка на графике), плюс叠加 сигналы резонанса продаж от двух моделей, открыта позиция шорт 30% по цене 72,760 долларов.
• Управление рисками: Начальный стоп-лосс для шорт установлен выше 75,500 долларов.
• Закрытие: Падение до около 68,000 долларов,叠加 модель торговли по разнице цен активировала сигнал предупреждения о дне (красная точка на графике), полное закрытие позиции около 68,095 долларов.
• Итог: Прибыль от этой сделки 6.41%.
60-минутный график биткоина:(Модель 量化 кинетической энергии + Модель торговли по разнице цен)
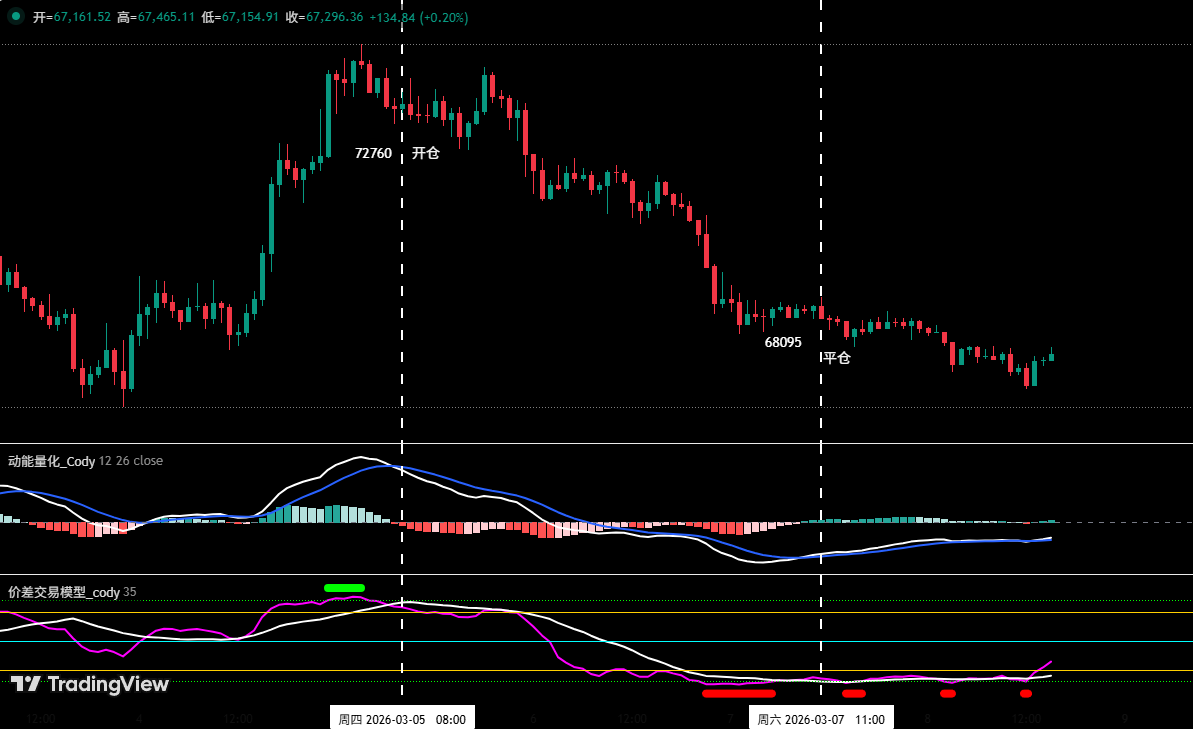
Рисунок 3 (Схема краткосрочной сделки)
2、 Обзор среднесрочной стратегии:
Среднесрочная стратегия: Продолжаем удерживать позицию шорт 60%, открытую около 89,000 долларов (28 января), на момент закрытия прошлой недели (цена закрытия около 65,971 долларов) прибыль около 25.88%.
三、Анализ технических индикаторов биткоина
结合 рыночное движение, автор на основе собственной构建ной торговой системы проводит глубокий анализ多项 технических индикаторов биткоина с уровней multiple моделей и multiple измерений.
1、Анализ на уровне недельного таймфрейма, как показано на (Рис. 4):
Недельный график биткоина:(Модель 量化 кинетической энергии + Модель 量化情绪)
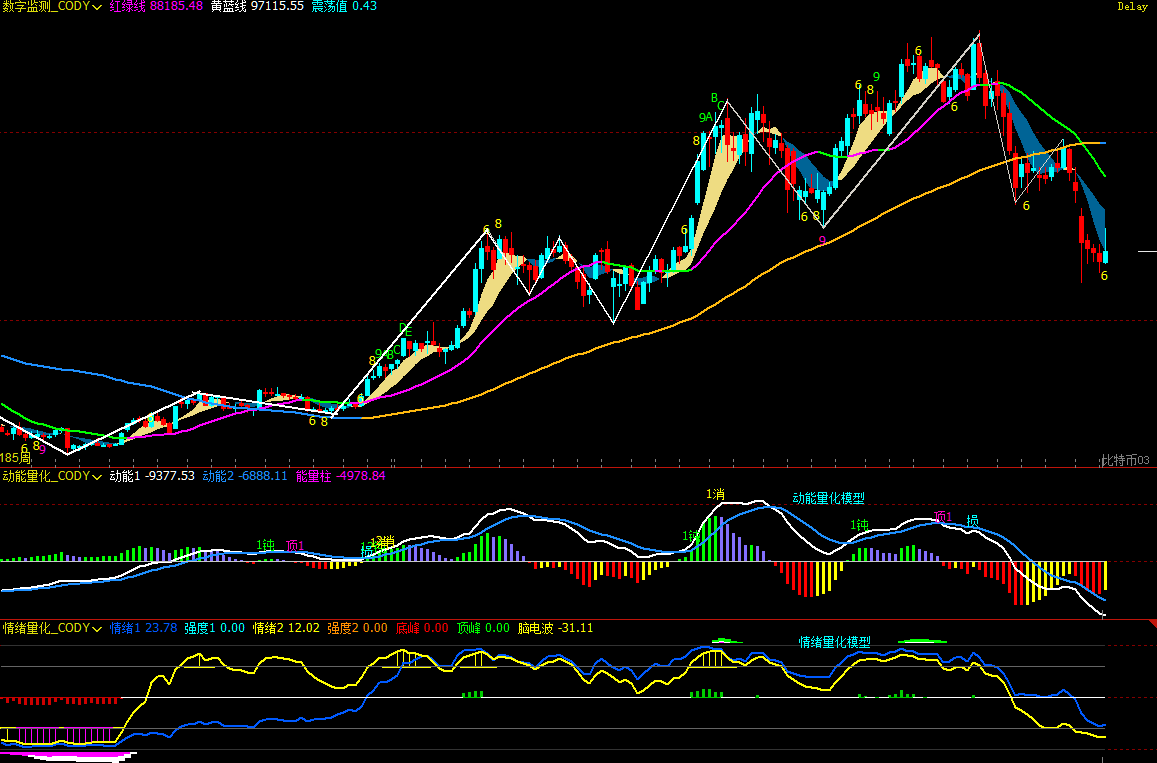
Рисунок 4
• Модель量化 кинетической энергии: Технические индикаторы показывают, что линия кинетической энергии同步下行, отрицательные столбцы энергии постепенно缩短, сигналов дивергенции кинетической энергии не出现.
• Модель量化情绪: Значение синей линии情绪 23, интенсивность ноль; значение желтой линии情绪 11, интенсивность ноль, пиковое значение 0.
• Модель数字 мониторинга: Скользящие средние呈现 медвежье расположение, на прошлой неделе закрылась маленькой бычьей свечой с длинной верхней тенью, рост 0.3%; сигналов дна от модели мониторинга数字 не出现.
Комплексный анализ и研判: На основе данных上述 трех моделей мы считаем, что текущий медвежий тренд на недельном таймфрейме биткоина четкий и продолжается, будь то дивергенция кинетической энергии, интенсивность экстремального释放情绪, или сигналы дна от数字 модели,均未出现, currently находится в форме медвежьего продолжения. После нескольких недель бокового движения рынок, вероятно, снова выберет движение вниз для тестирования дна.
2、Анализ на уровне дневного таймфрейма: как показано на (Рис. 5)
Дневной график биткоина:(Модель 量化 кинетической энергии + Модель 量化情绪)
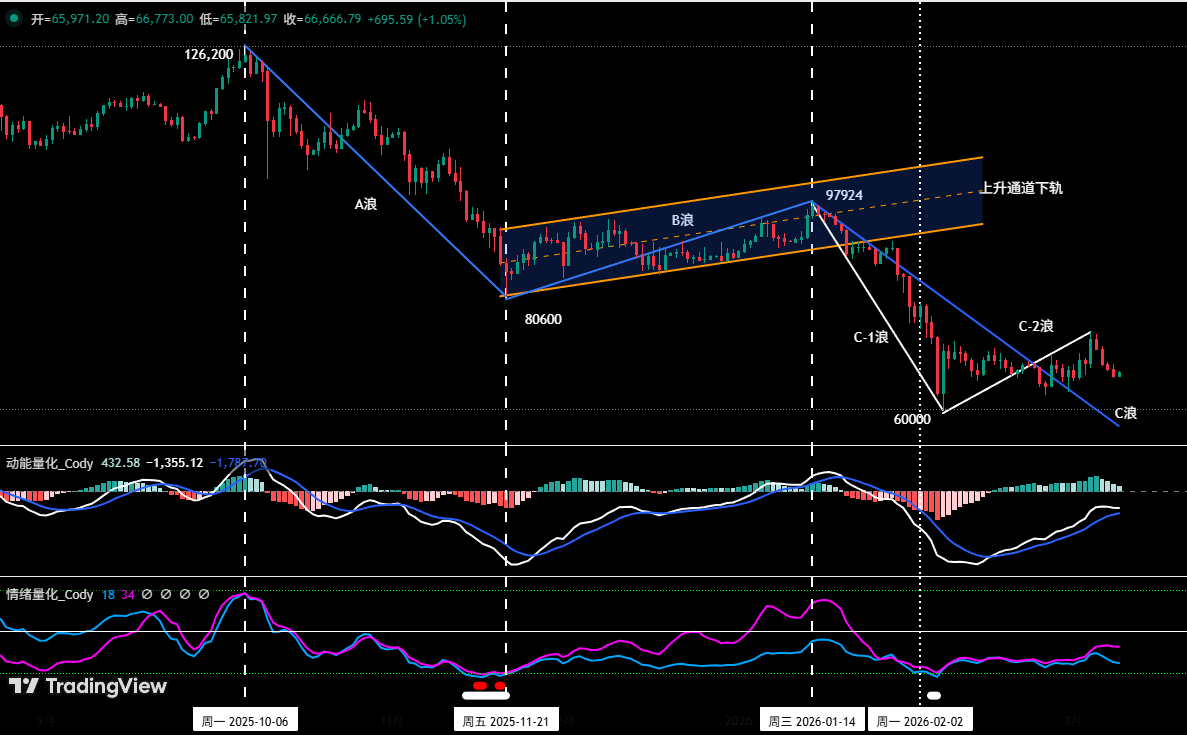
Рисунок 5
• Модель量化 кинетической энергии: На прошлой неделе行情 в целом呈现格局 «сначала рост, потом падение». Линия кинетической энергии ниже нулевой оси同步上行, положительные столбцы энергии变化无序.
• Модель量化情绪: На закрытии прошлой недели, значение синей линии情绪 19, интенсивность ноль; значение фиолетовой линии情绪 35, интенсивность ноль, медленно выходит из области перепроданности.
Комплексный анализ и研判: Проанализировав данные моделей量化 кинетической энергии и量化情绪, мы считаем, что техническая структура медвежьего тренда на дневном таймфрейме биткоина не изменилась. Текущее движение является отскоком от перепроданности, и由于 покупательская动能无序, рыночная настроение осторожное, участие капитала низкое, сила этого отскока слабая, устойчивость плохая.
四、Прогноз на текущую неделю:(03.09~03.15)
1、Построение восходящего центра биткоина (на основе行情 после низа 6 февраля):(Еженедельное обновление)
4-часовой график биткоина
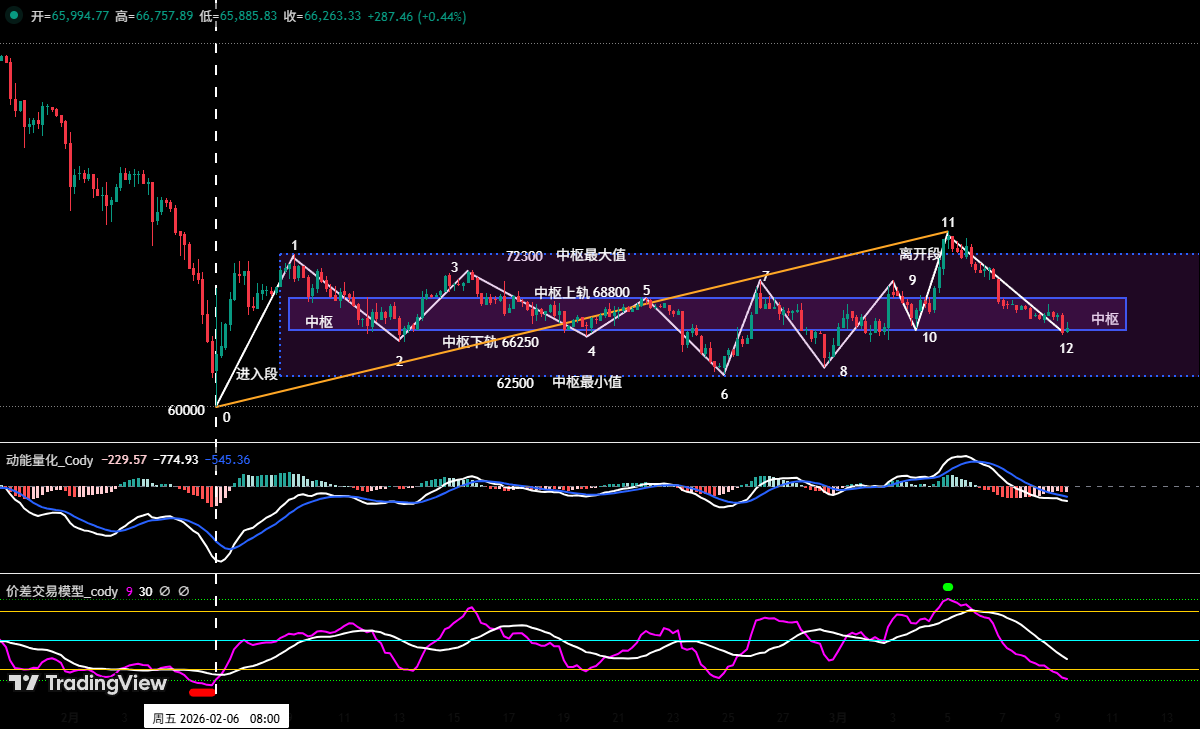
Рисунок 6
В качестве分析周期 используем 4-часовой график биткоина:
• Построение центра: Из (Рис. 6) видно: В настоящее время структура «восходящего центра» в основном сформирована. Его максимальное сопротивление около 72,300 долларов, минимальная поддержка около 62,500 долларов; верхняя граница центра около 68,800 долларов, нижняя граница центра около 66,250 долларов.
2、判断 завершения отскока волны C-2:
• Мы сохраняем предыдущую核心研判框架: Восходящее движение биткоина, начавшееся с низа 6 февраля (около 60,000 долларов), по своей природе является отскоком от перепроданности волны C-2 внутри крупной корректирующей волны C, за которым последует корректирующее движение волны C-3.
• Предупреждение о дне: Из (Рис. 6) видно: Наша собственная构建ная модель торговли по разнице цен, около точки 0 6 февраля активировала сигнал предупреждения о дне (красная точка), точно捕捉起点 волны C-2.
• Предупреждение о вершине: В недавно сформированной точке 11, модель量化 разницы цен转而 активировала сигнал предупреждения о вершине (зеленая точка). Сигналы предупреждения о дне и вершине相继出现, с точки зрения модели подтверждая формирование полной полосы отскока, предвещая возможное истощение восходящей动能.
3、Ключевая точка зрения на неделю: Сохранение格局 бокового движения в диапазоне, отскок от перепроданности волны C-2, возможно,接近 завершения, внимание к выбору направления. В стратегии следует твердо выполнять операционный принцип «фиксировать прибыль (лонг) на росте, контролировать риски».
4、Ключевые уровни сопротивления:
• Первая зона сопротивления: регион 72,300-74,500 долларов (зона密集ных成交ов в предыдущий период)
• Вторая зона сопротивления: регион 79,500-80,600 долларов (около низа ноября 2025 года)
5、Ключевые уровни поддержки:
• Первая поддержка: около 65,000 долларов (важный регион поддержки в предыдущий период)
• Вторая поддержка: регион 60,000~62,500 долларов (около низа 6 февраля)
• Третья поддержка: около 57,400 долларов
五、Операционная стратегия на текущую неделю(исключая влияние внезапных новостей):(03.09~03.15)
1、 Среднесрочная стратегия: см. Рис. 7
Дневной график биткоина:(Модель мониторинга позиций)
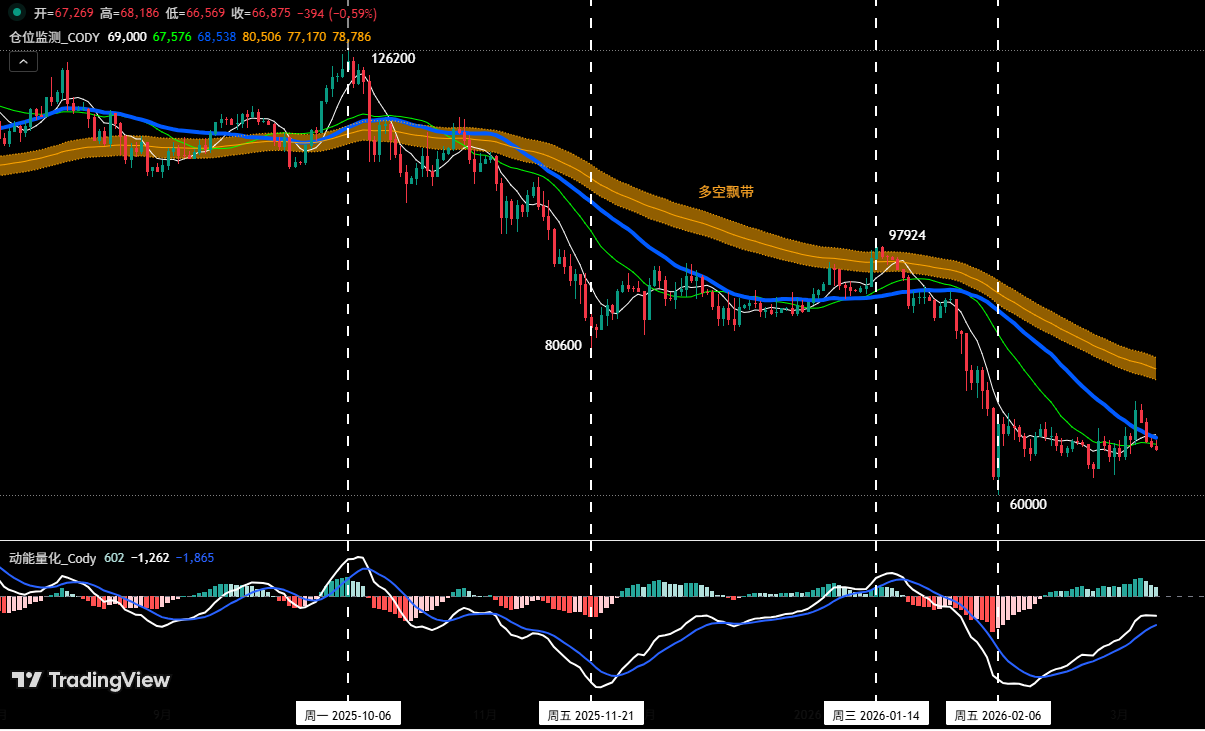
Рисунок 7
Модель мониторинга позиций: В настоящее время цена монеты находится ниже ленты быков/медведей (желтая), поэтому продолжаем удерживать позицию шорт 60%, открытую около 89,000 долларов (28 января).
• Если цена отскочит и эффективно突破 74,500 долларов, можно снизить среднесрочную позицию до 40%.
• Если цена отскочит и эффективно突破 ленту быков/медведей и закрепится выше нее, обнулить всю среднесрочную позицию.
2、 Краткосрочная стратегия: Использовать 30% капитала, установить стоп-лосс, искать возможности для сделок по «разнице цен» на основе уровней поддержки и сопротивления. (В качестве операционного цикла использовать 30-минутный/60-минутный таймфреймы).
3、Поскольку среднесрочное направление рынка является медвежьим трендом, для динамичного应对 сложной рыночной эволюции и结合 сигналов собственной торговой модели, мы拟定 A/B два варианта краткосрочных операций:
• Вариант A:Отскок встречает сопротивление, продавать на росте.
• Открытие: Когда цена отскочит до около 72,300~74,500 долларов, активирует сигнал сопротивления и结合 сигнал вершины модели, можно открыть позицию шорт 30%.
• Управление рисками: Начальный стоп-лосс для шорт установить выше 75,500 долларов.
• Закрытие: При падении до важных уровней поддержки и结合 сигналов модели, можно постепенно закрывать позицию, фиксируя прибыль.
• Вариант B: Шорт по пробою по тренду.
• Открытие: Когда цена эффективно跌破 нижнюю границу центра 66,250 долларов, затем отскочит к этой точке但 не сможет закрепиться выше, и结合 сигнал вершины модели, можно顺势 открыть позицию шорт 30%.
• Управление рисками: Начальный стоп-лосс для шорт установить выше 67,500 долларов.
• Закрытие: При падении до уровней поддержки и结合 сигналов модели, можно постепенно закрывать позицию, фиксируя прибыль.
六、Особые указания:
1. При открытии позиции: Немедленно установить начальный стоп-лосс.
2. При достижении прибыли 1%: Переместить стоп-лосс на цену открытия (точка безубыточности), обеспечивая безопасность本金.
3. При достижении прибыли 2%: Переместить стоп-лосс на уровень прибыли 1%.
4. Постоянное отслеживание: В дальнейшем при каждой дополнительной прибыли в 1% перемещать стоп-лосс同步 на 1%, динамично защищая и фиксируя прибыль.
Финансовые рынки瞬息万变, все анализ行情 и торговые стратегии требуют динамичной корректировки. Все观点, аналитические модели и операционные стратегии,涉及 в данной статье, основаны на личном техническом анализе, предназначены только для личного торгового журнала и не являются инвестиционной рекомендацией или основанием для действий. Рынок有风险, инвестиции需谨慎, не принимайте решений на основе этого.


