Индекс сетевой активности CryptoQuant для Bitcoin остается в нисходящем тренде, что свидетельствует о слабом спросе на использование блокчейна.
Индекс сетевой активности CryptoQuant для Bitcoin остывает
Как отметил аналитик сообщества CryptoQuant Maartunn в публикации в X, активность в сети Bitcoin недавно снизилась. Релевантным индикатором здесь является «Индекс сетевой активности» от аналитической фирмы CryptoQuant, который объединяет несколько показателей, связанных с активностью, чтобы показать общую ситуацию в блокчейне.
Индикаторы, на которые ссылается индекс, включают активные адреса (как получающие, так и отправляющие), транзакции (общие и на блок), количество UTXO и байтов на блок.
Теперь вот график, предоставленный Maartunn, который показывает, как Индекс сетевой активности CryptoQuant менялся для Bitcoin за всю его историю:
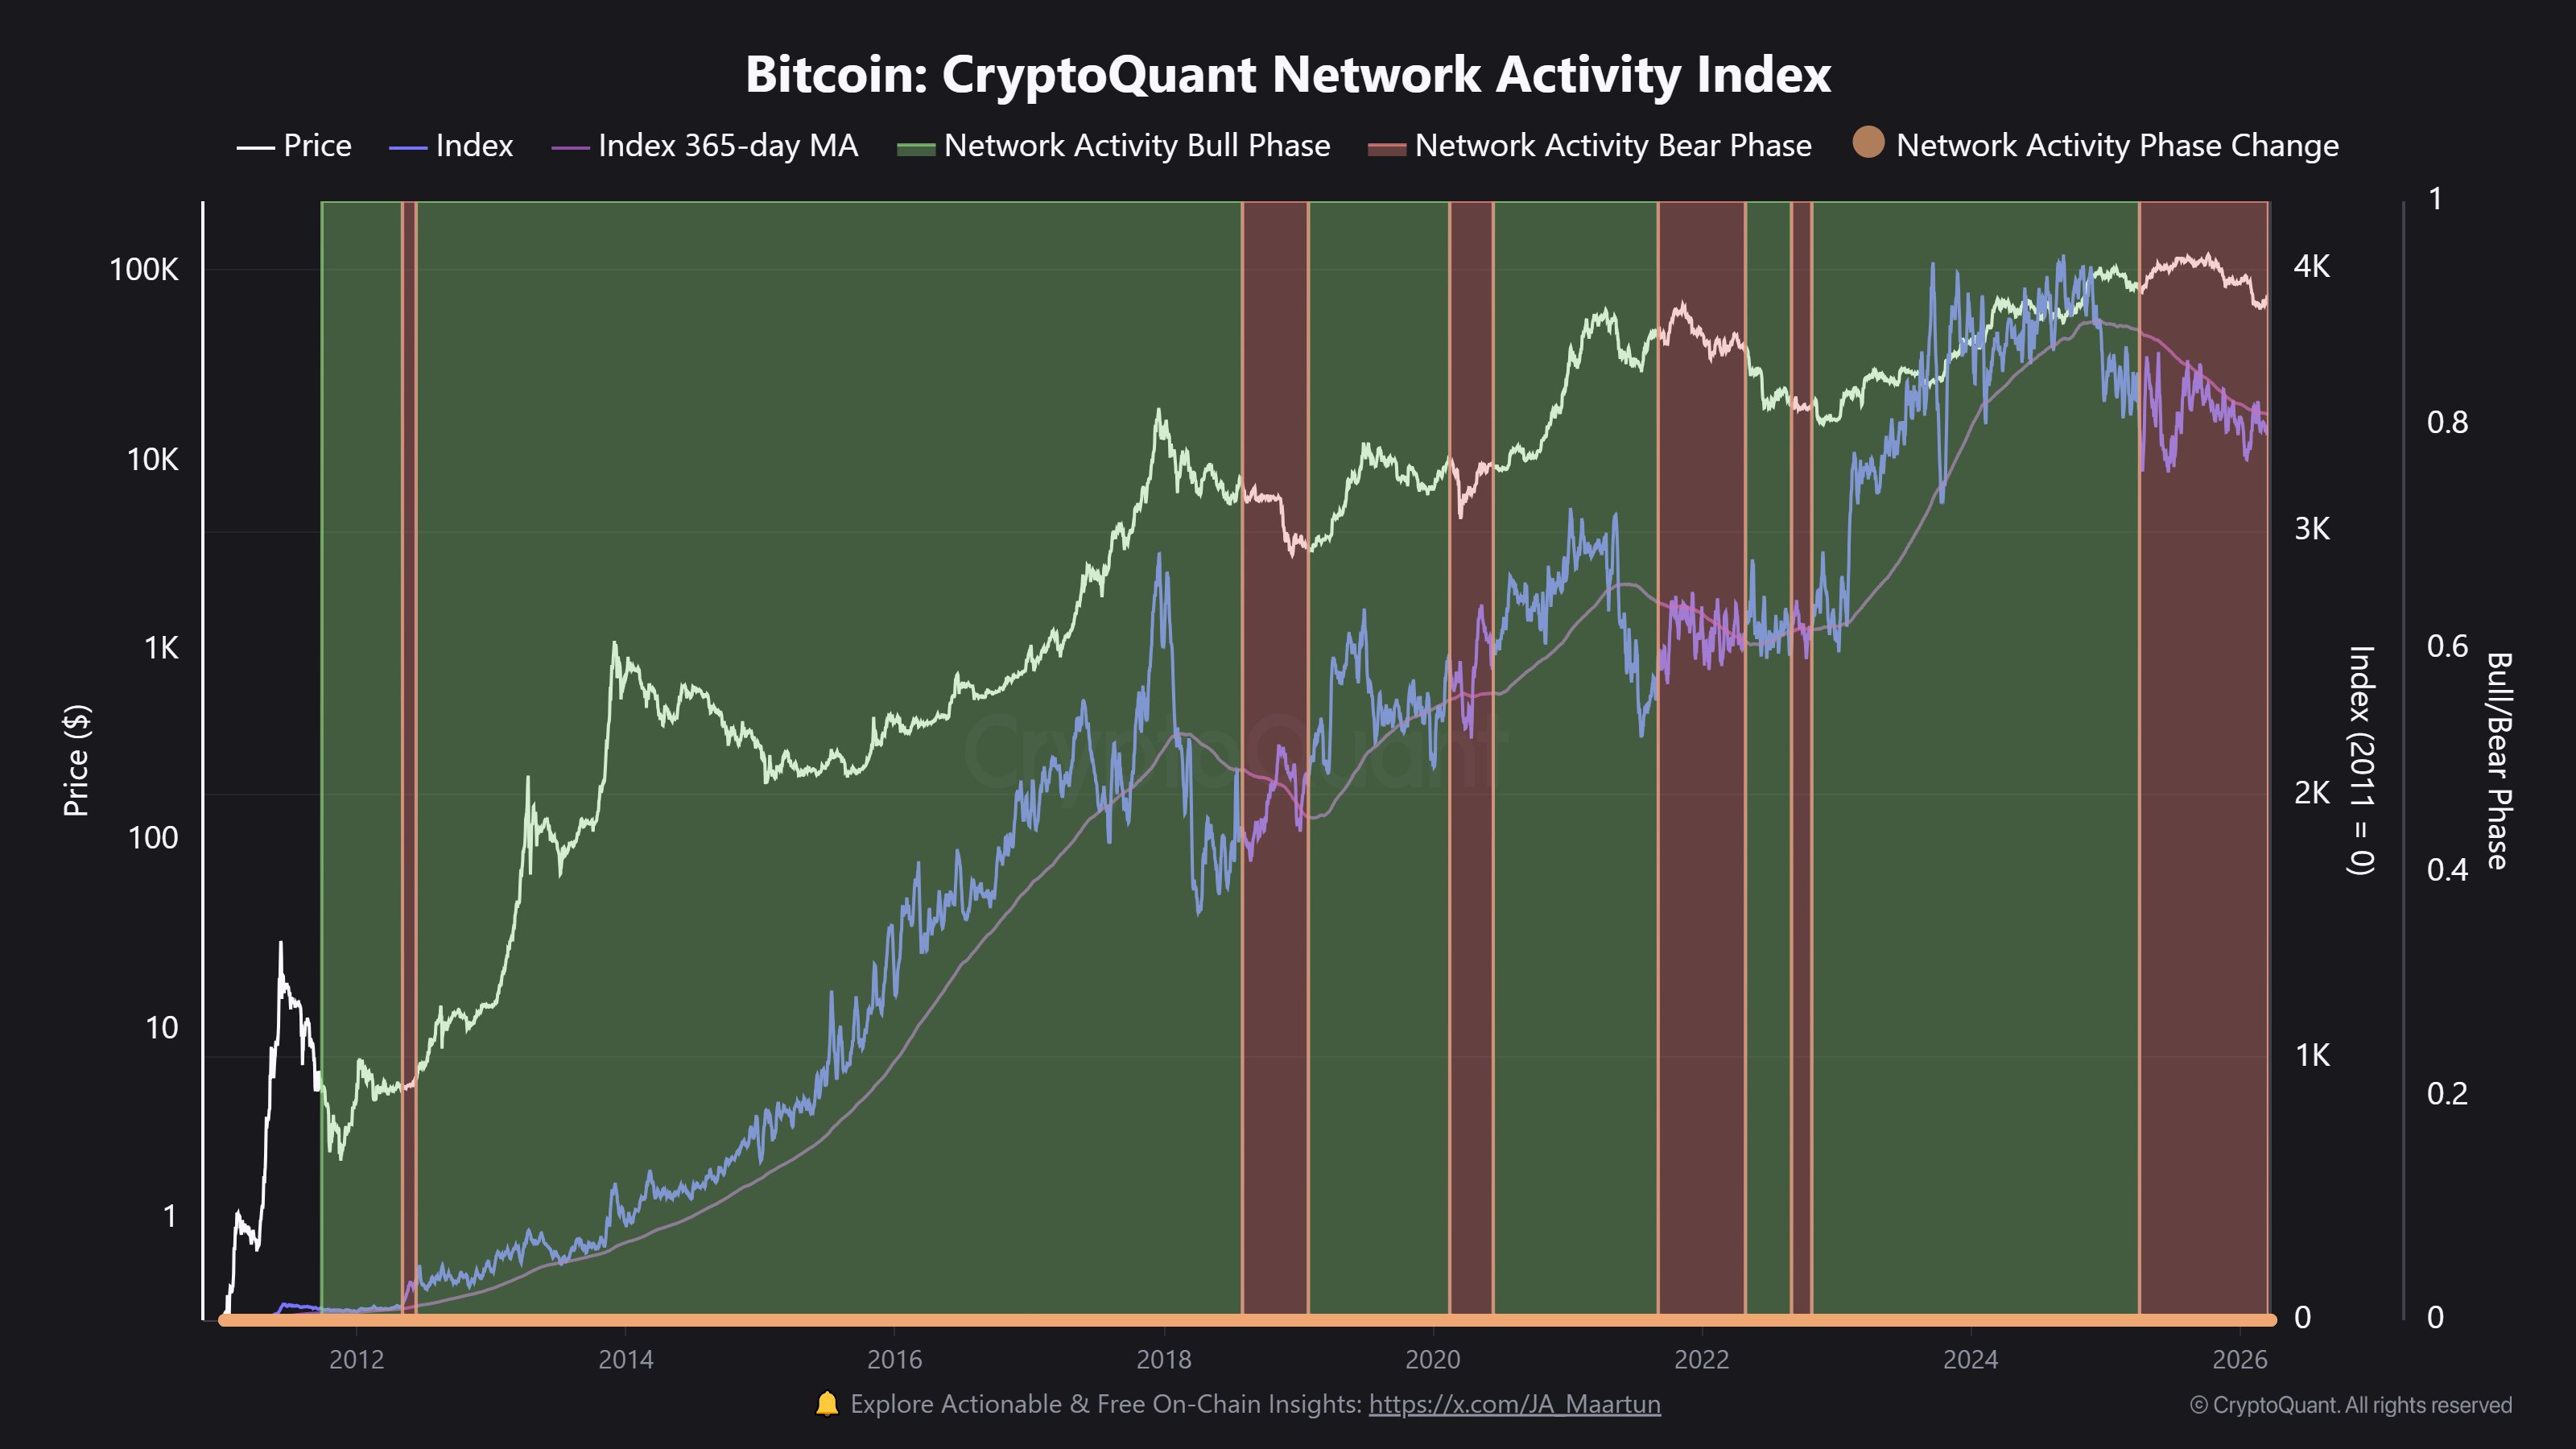
Похоже, значение метрики неуклонно снижалось в последние месяцы | Источник: @JA_Maartun на X
Как показано на графике выше, Индекс сетевой активности Bitcoin недавно следует нисходящей траектории, что является признаком ослабления транзакционной активности в блокчейне.
Наряду с этим снижением индикатор застрял в регионе ниже своей 365-дневной скользящей средней (MA), что обычно соответствует медвежьим фазам.
Интересно, что красный сигнал в индикаторе фактически сохранялся еще до смены настроений, которую рынок наблюдал в последнем квартале 2025 года. Это означает, что даже несмотря на то, что BTC в течение года наблюдал рост до новых исторических максимумов (ATH), сетевая активность все еще находилась в состоянии снижения. Из графика видно, что эта модель также наблюдалась в 2021 году; во второй половине бычьего ралли того года метрика подавала медвежий сигнал.
Учитывая, что Индекс сетевой активности Bitcoin недавно продолжал оставаться в красной зоне, можно предположить, что спрос на использование сети остается слабым. Теперь остается только посмотреть, сколько времени потребуется, чтобы индикатор развернулся.
В других новостях, аналитическая компания Glassnode поделилась данными своего нового индикатора, Accumulation Trend Score by Wallet Cohort, в публикации в X. Эта метрика рассказывает о 30-дневном поведении накопления различных групп инвесторов Bitcoin.
Как показано на графике ниже, Accumulation Trend Score недавно находился на нейтральных или красных значениях по всему рынку.
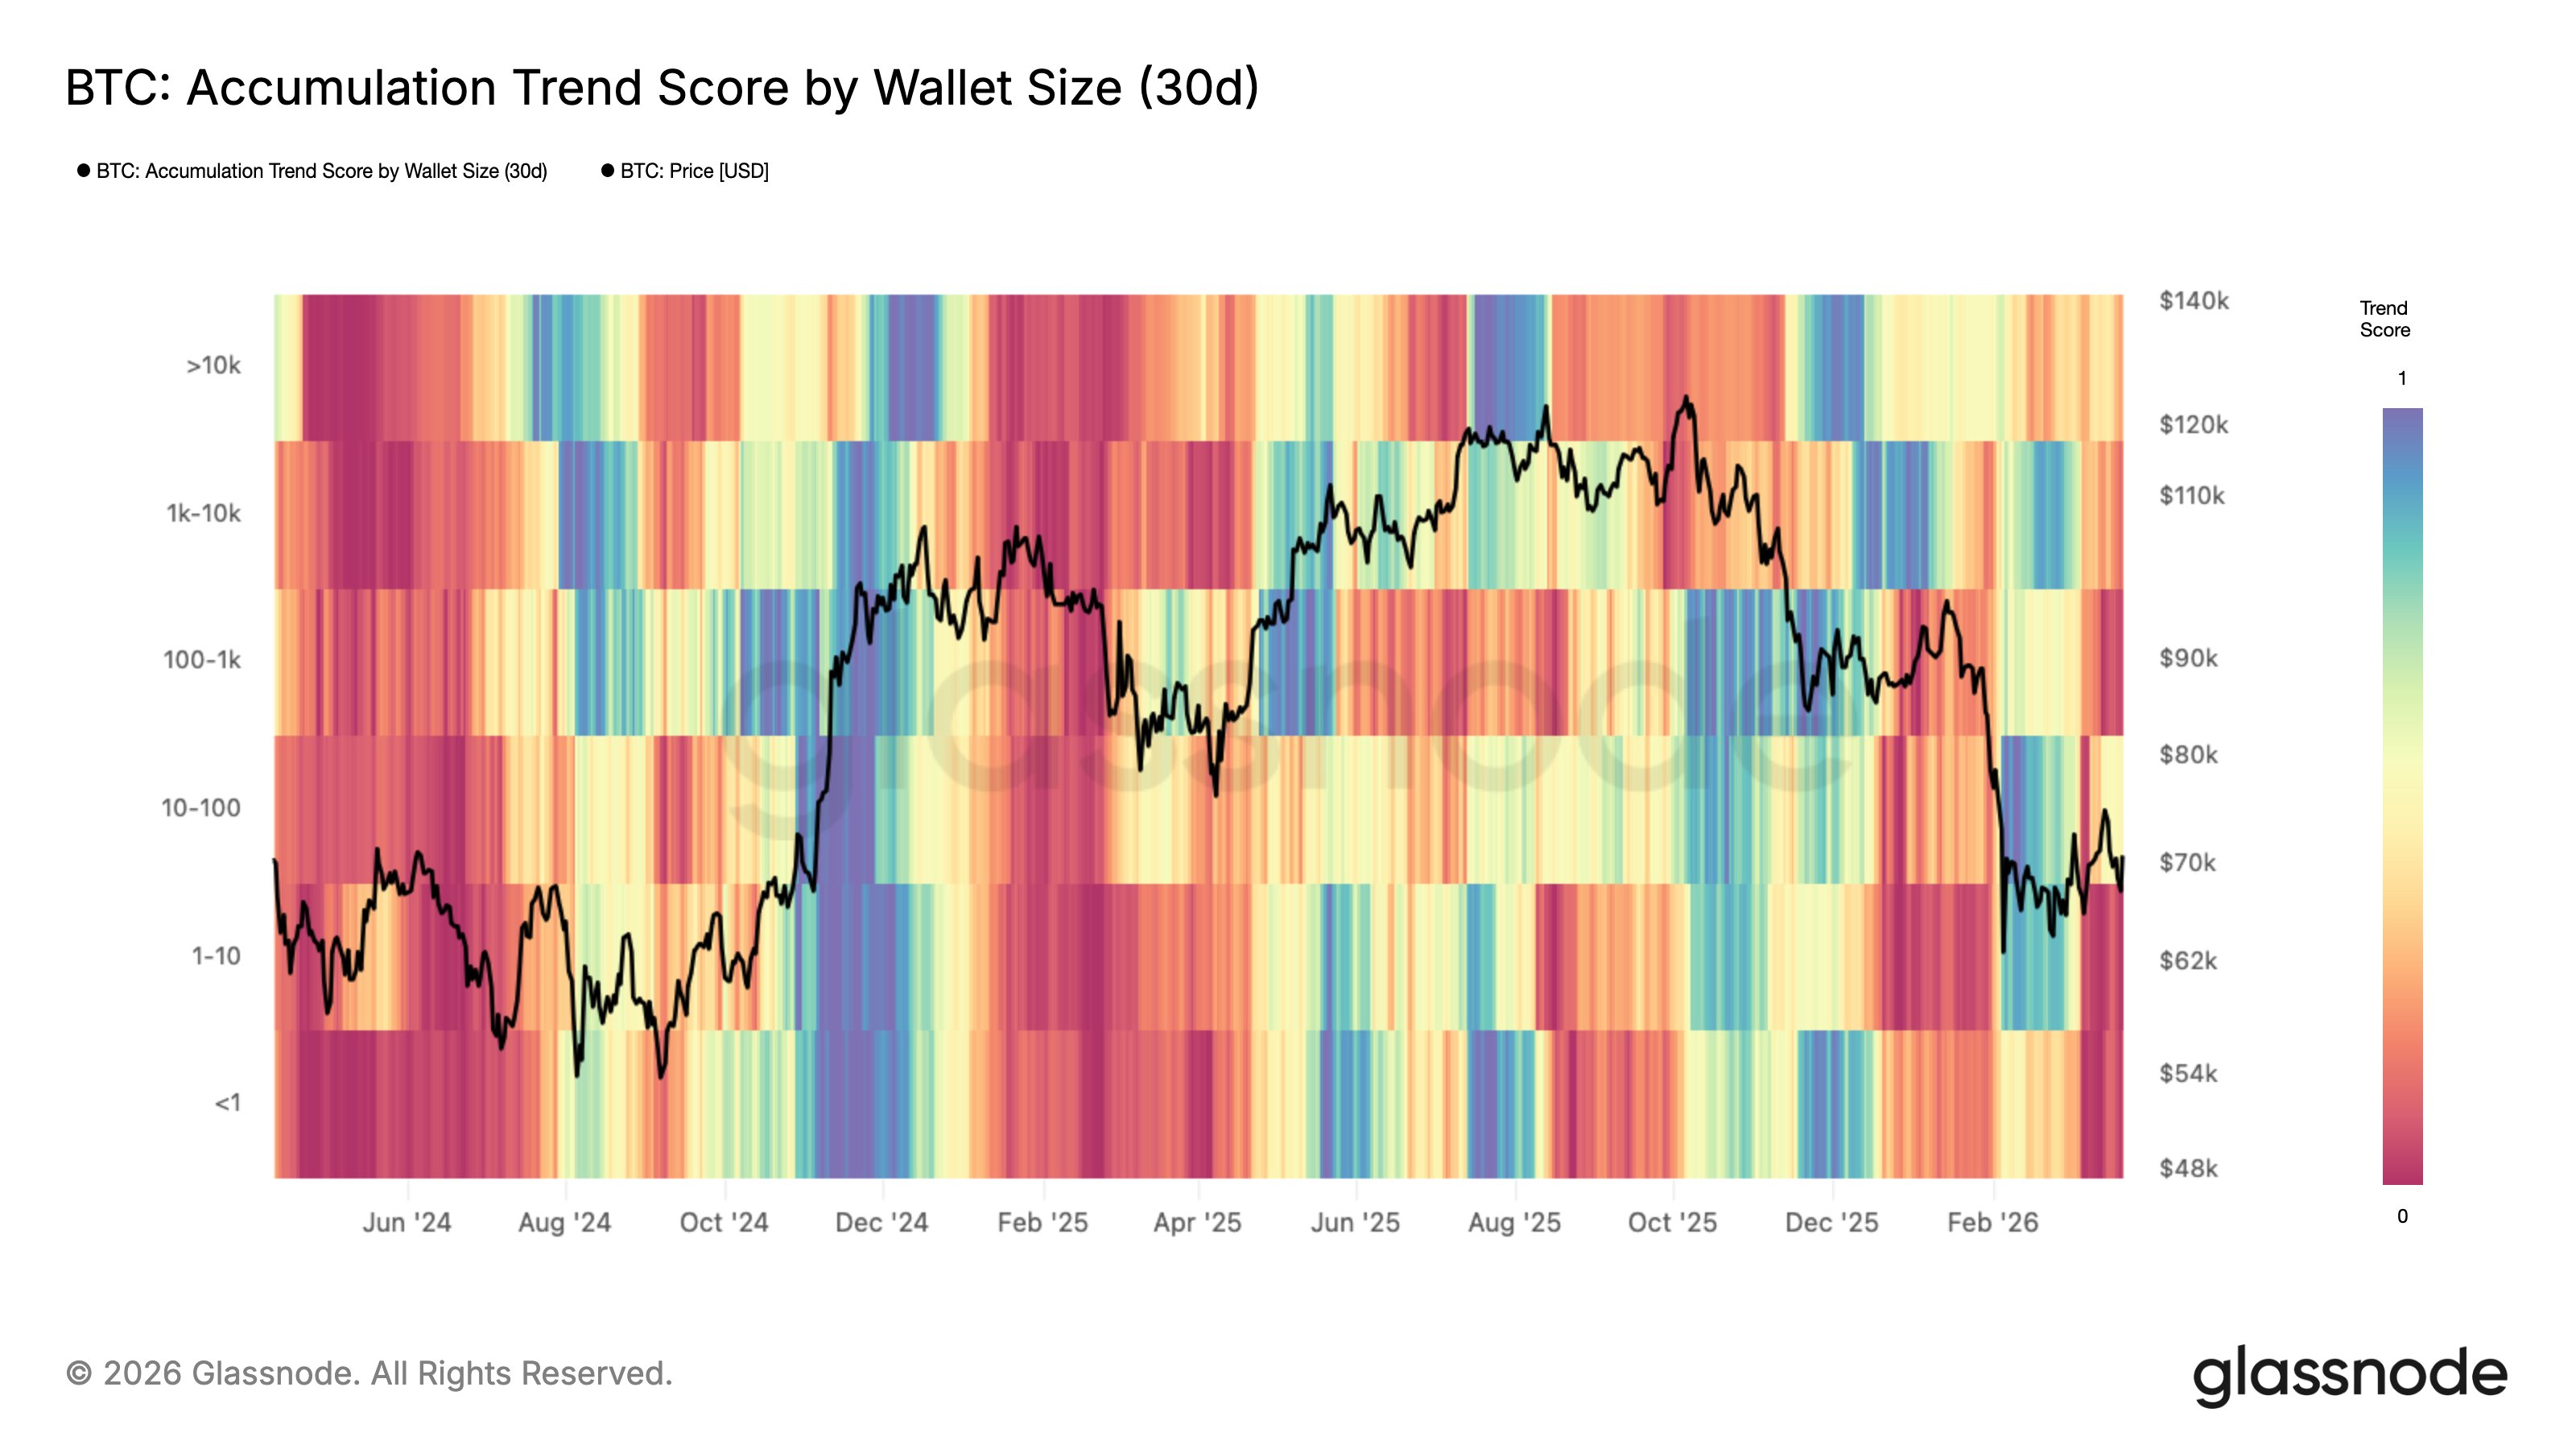
Значение метрики, похоже, было красным для большинства групп в последние дни | Источник: Glassnode на X
Оранжево-красные уровни для всех групп Bitcoin указывают на то, что поведение инвесторов недавно склонялось к распределению. В отличие от этого, некоторые когорты участвовали в накоплении после обвала цен в феврале.
Цена BTC
На момент написания Bitcoin торгуется около $70 900, показав рост более чем на 2% за последние 24 часа.

Тенденция в цене монеты за последние пять дней | Источник: BTCUSDT на TradingView