Bitcoin price struggled to clear the $17,000 resistance. BTC seems to be forming a double top pattern and might dive below the $16,000 support.
- Bitcoin attempted an upside break above the $17,000 resistance, but failed.
- The price is trading above $16,300 and the 100 hourly simple moving average.
- There was a break below a key bullish trend line with support near $16,420 on the hourly chart of the BTC/USD pair (data feed from Kraken).
- The pair could continue to decline if it breaks the $16,000 support zone.
Bitcoin Price Struggle Continues
Bitcoin price attempted a recovery wave from the $15,500 support zone. BTC climbed above the $16,000 and $16,500 resistance levels.
It even settled above the $16,300 level and the 100 hourly simple moving average. However, the bears were active near the $16,800 zone. It seems like the price faced another major rejection near the $16,800 level and is forming a double top pattern.
Bitcoin price started a fresh decline from the $16,800 zone. There was a break below a key bullish trend line with support near $16,420 on the hourly chart of the BTC/USD pair.
It is now approaching the 23.6% Fib retracement level of the recent increase from the $15,470 swing low to $16,791 high. Besides, it is trading above $16,300 and the 100 hourly simple moving average. On the upside, an immediate resistance is near the $16,600 level.
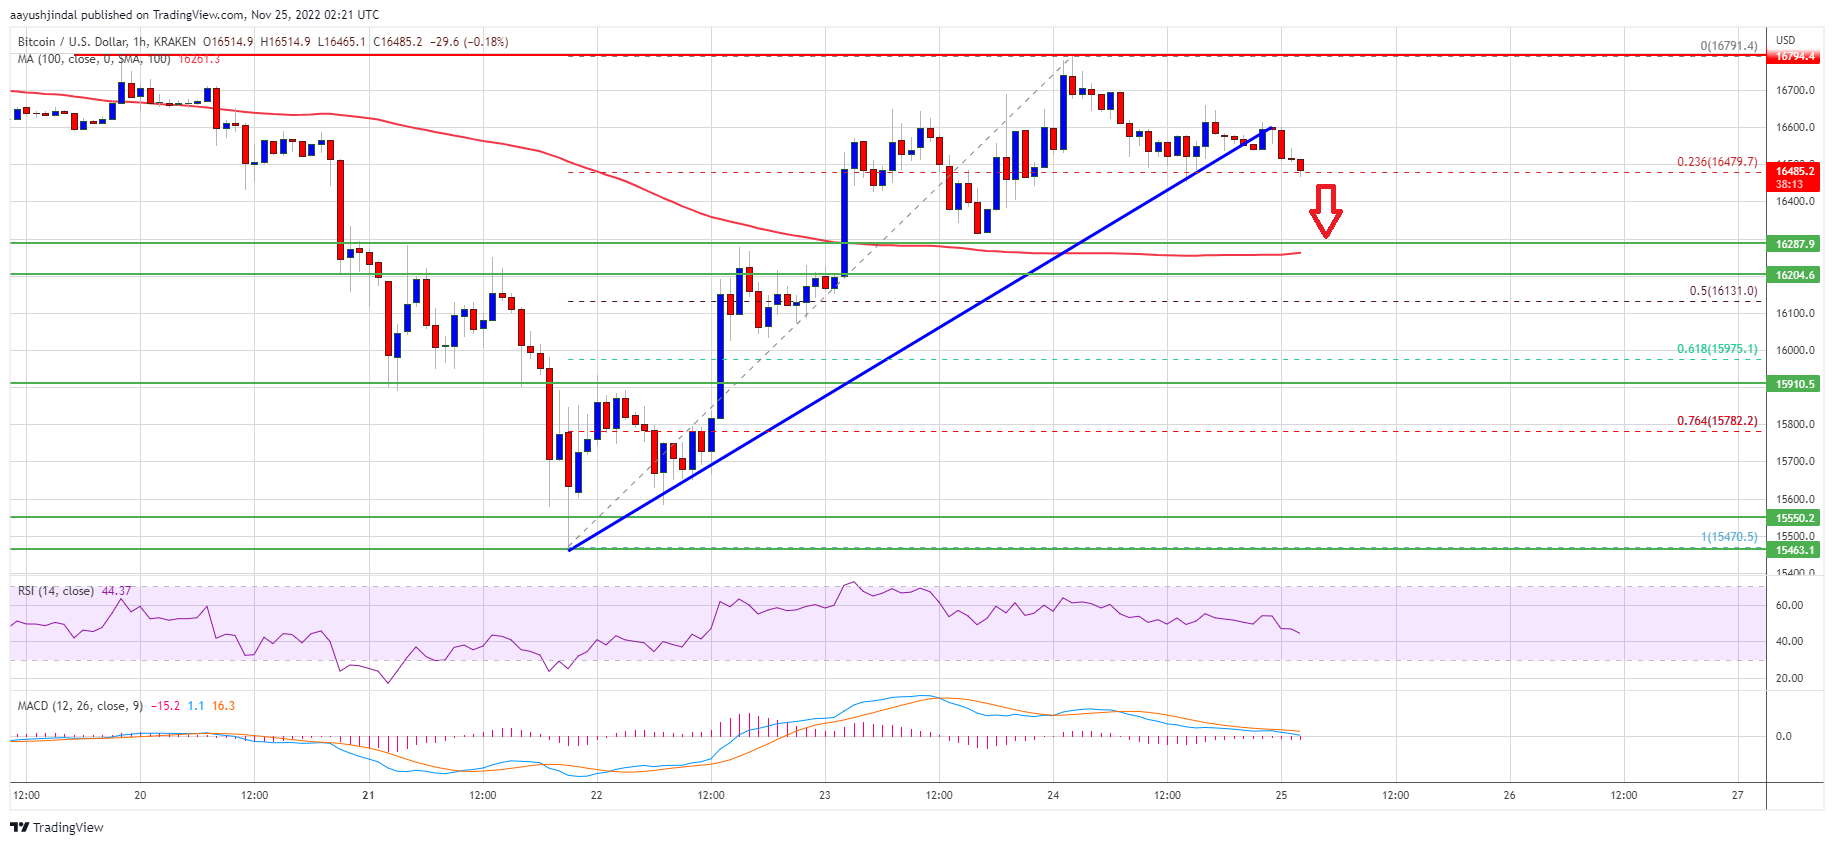
Source: BTCUSD on TradingView.com
The first major resistance is near the $16,800 zone. A successful move above the $16,800 resistance might start a real recovery wave. The next major resistance is near $17,000, above which the price could gain pace for a move towards the $17,500 zone.
Fresh Decline in BTC?
If bitcoin fails to climb above the $16,800 resistance, it could continue to move down. An immediate support on the downside is near the $16,280 level and the 100 hourly simple moving average.
The next major support is near the $16,130 zone or the 50% Fib retracement level of the recent increase from the $15,470 swing low to $16,791 high, below which the price might gain bearish momentum. In the stated case, the price might drop towards the $15,500 support zone.
Technical indicators:
Hourly MACD – The MACD is now gaining pace in the bearish zone.
Hourly RSI (Relative Strength Index) – The RSI for BTC/USD is now below the 50 level.
Major Support Levels – $16,280, followed by $16,130.
Major Resistance Levels – $16,800, $17,000 and $18,000.