Bitcoin is struggling to climb above the $24,000 resistance zone against the US Dollar. BTC is declining and might continue to move down towards the $22,000 support.
Bitcoin is showing bearish signs below the $23,500 level.
The price is now trading below the $23,200 level and the 100 hourly simple moving average.
There is a major bearish trend line forming with resistance near $23,250 on the hourly chart of the BTC/USD pair (data feed from Kraken).
The pair could continue to slide and might even test the $22,000 support in the near term.
Bitcoin Price Signals Decline
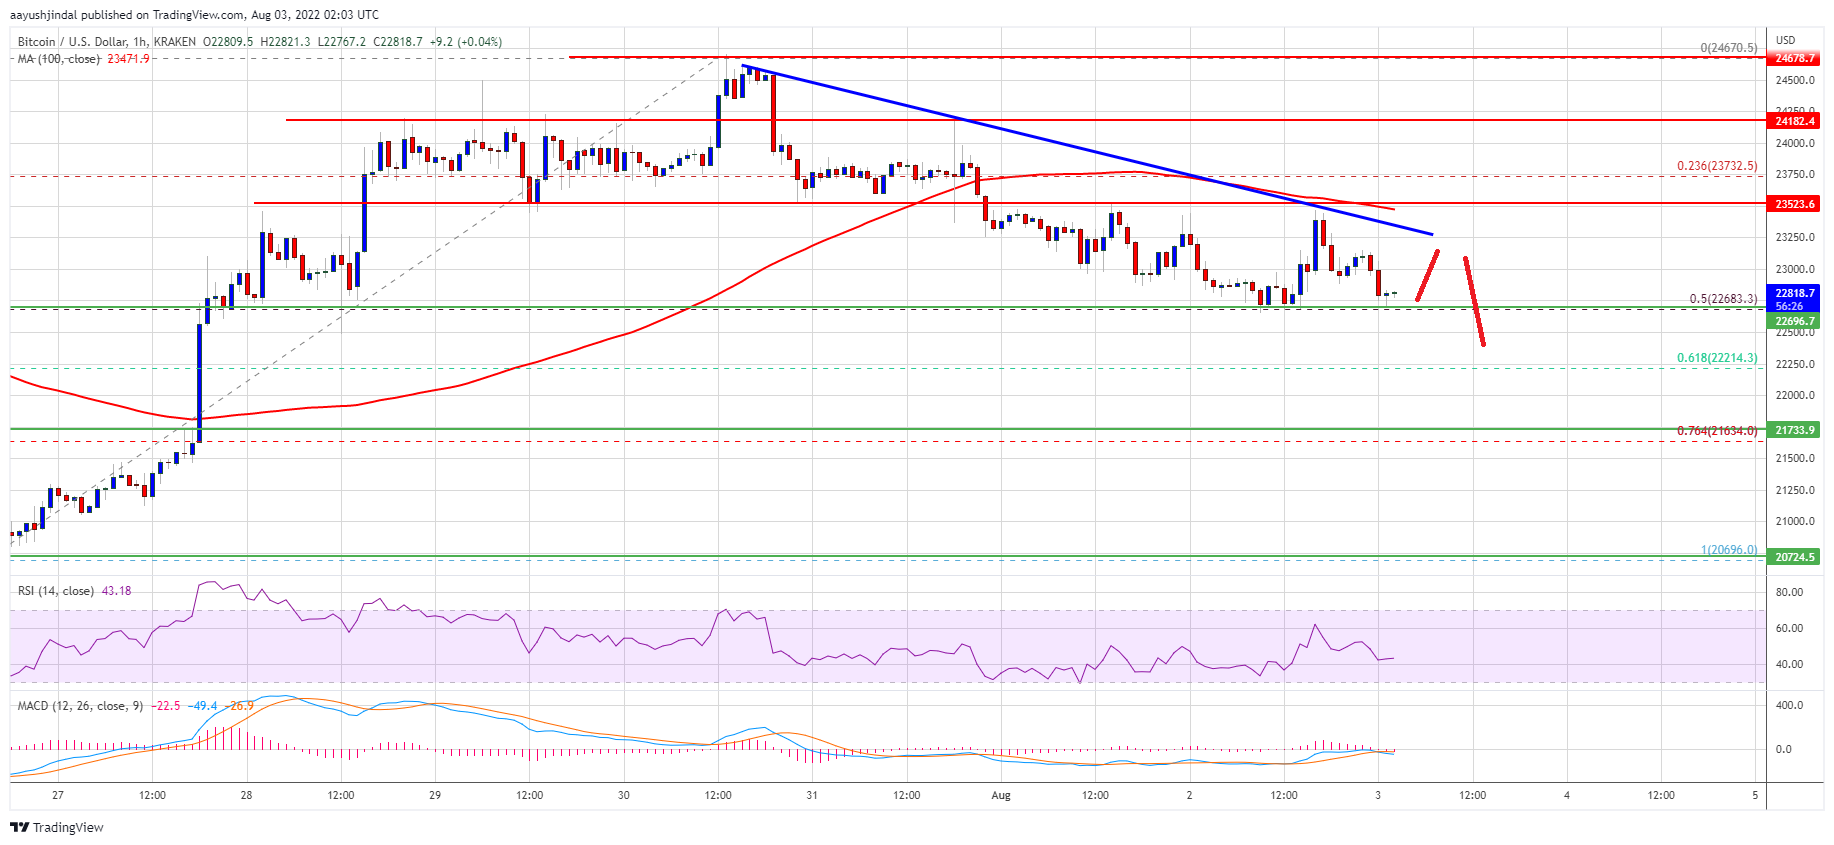
Bitcoin price started a steady decline from well above the $24,000 resistance zone. The price declined below the $23,500 and $23,250 to move into a short-term bearish zone.
The declined gained pace below the 100 hourly simple moving average. It even tested the 50% Fib retracement level of the key increase from the $20,695 swing low to $24,671 high. The price is now struggling below the $23,200 level and the 100 hourly simple moving average.
There is also a major bearish trend line forming with resistance near $23,250 on the hourly chart of the BTC/USD pair. However, it seems like the bulls are protecting the $22,680 support zone.
On the upside, bitcoin price is facing resistance near the $23,250 level and the trend line. The next key resistance is near the $23,520 zone and the 100 hourly simple moving average.
The main resistance could be near the $24,180 zone. A close above the $24,180 resistance zone could set the pace for a decent increase. In the stated case, the price may perhaps rise towards the $24,650 level. The next major resistance sits near the $25,000 level.
More Losses in BTC?
If bitcoin fails to clear the $23,250 resistance zone and the trend line, it could continue to move down. An immediate support on the downside is near the $22,680 level.
The next major support now sits near the $22,210 level. It is near the 61.8% Fib retracement level of the key increase from the $20,695 swing low to $24,671 high. Any more losses might send the price towards $22,000 level.
Technical indicators:
Hourly MACD – The MACD is now gaining pace in the bearish zone.
Hourly RSI (Relative Strength Index) – The RSI for BTC/USD is now below the 50 level.
Major Support Levels – $22,680, followed by $22,210.
Major Resistance Levels – $23,250, $23,520 and $24,180.