Вскоре после завершения еженедельного отчета на прошлой неделе биткоин упал до отметки около 60 тысяч долларов, и многие из вас написали мне в личные сообщения, выражая беспокойство по поводу будущей динамики биткоина. Для инвесторов, которые открыли позиции на уровне 80 тысяч долларов или даже раньше, давление из-за просадки на счете очевидно, и я полностью понимаю эти эмоции — мы все в той или иной степени переживали подобные моменты в разных циклах. Тревога, беспомощность и даже желание все бросить.
Но именно на таких этапах эмоции чаще, чем направление тренда, становятся источником риска. Вместо того чтобы идти на поводу у краткосрочных колебаний, лучше сначала стабилизировать mindset и заново оценить объем позиций и ритм. Потому что в дальнейшем не исключена возможность этапного отскока на рынке, и подобные колебания сами по себе часто предоставляют инвесторам окно для активной корректировки: поэтапно сокращая exposure к риску или используя более гибкие и быстрые сделки по волнам, постепенно усредняя стоимость и снижая давление, чтобы более спокойно应对 последующей неопределенности.
Надеюсь, моя статья сможет предложить новые идеи в моменты, когда вы чувствуете растерянность и замешательство:

Ключевые моменты еженедельного торгового отчета:
• Прогноз внутренней структуры нисходящей волны C, начавшейся 14 января. (Подробности на рис. 1)
• Проверка эффективности исполнения стратегии (краткосрочной): Торговля на прошлой неделе велась в соответствии с установленной краткосрочной стратегией, выполнены две краткосрочные операции (плечо 1x), успешно получен совокупный доход около 10,72%.
• Проверка эффективности исполнения стратегии (среднесрочной): На прошлой неделе, следуя установленной среднесрочной стратегии, продолжали удерживать короткую позицию, открытую на уровне 89 000 долларов (плечо 1x), на момент закрытия прошлой недели прибыль составила около 20,97%, максимальная прибыль в течение недели — около 32,58%.
• Подтверждение ключевой точки зрения (краткосрочной): На прошлой неделе, в условиях резонанса медвежьего тренда на недельном и дневном графиках, цена монеты последовательно пробила несколько уровней поддержки и в конечном итоге нашла опору near 60 000 долларов. Движение рынка соответствовало нашим earlier ожиданиям коррекции по волне C.
Далее подробно回顾 прогноз行情, исполнение стратегии и конкретный торговый процесс.
一、Анализ структуры коррекции биткоина и прогноз будущей структуры движения волны C
Дневной график биткоина:
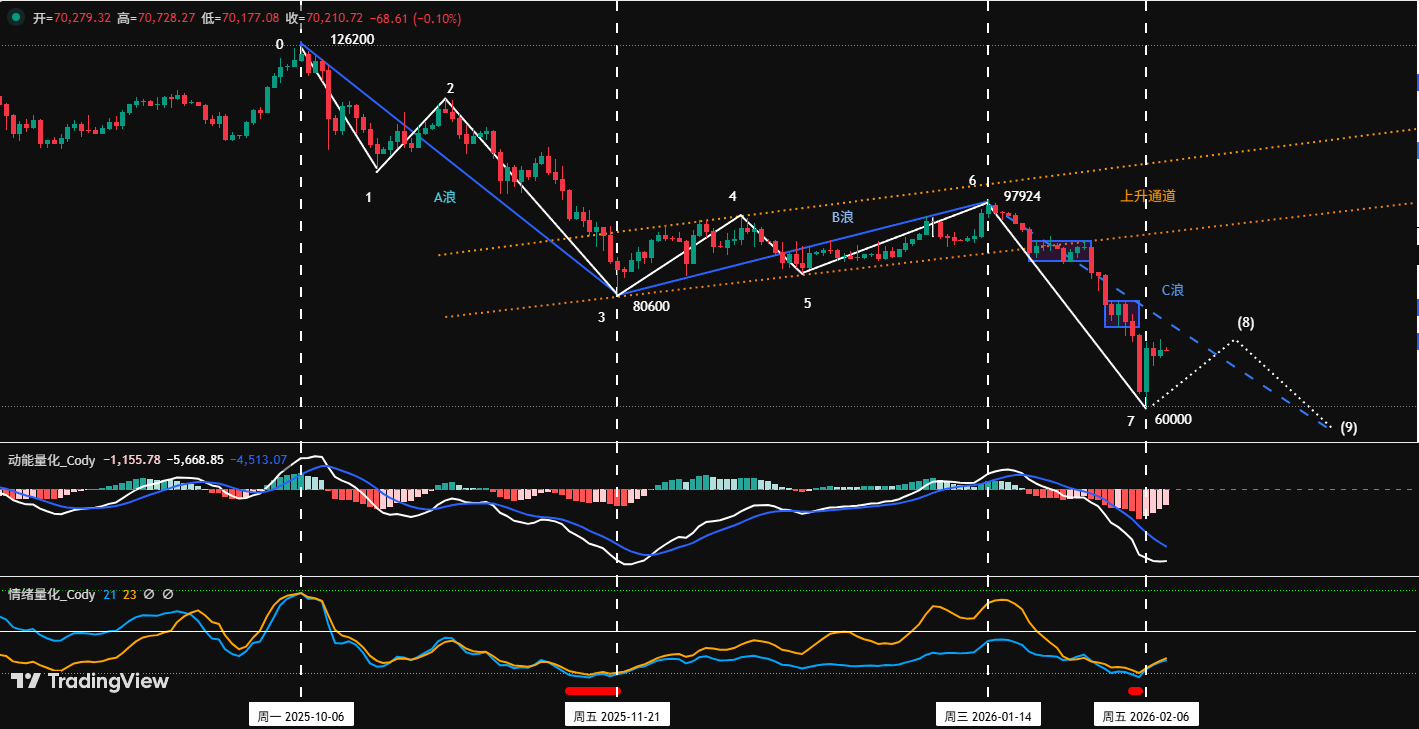
Рисунок 1
1、Анализ основной структуры:
На данный момент текущая коррекция, начавшаяся с максимума 126 200 долларов в октябре 2025 года,呈现 трехволновую структуру A-B-C:
• Волна A (движущая волна падения): 126 200 долларов (06.10.2025) до 80 600 долларов (21.11.2025), продолжительность 46 дней, максимальное падение 36%.
• Волна B (корректирующая волна отскока): 80 600 долларов (21.11.2025) до 97 924 долларов (14.01.2026), продолжительность 54 дня, максимальный рост 21,5%.
• Волна C (основная волна падения): 97 924 долларов (14 января) по настоящее время, продолжительность 25 дней, максимальное падение 38,7%.
2、Анализ внутренней структуры: Детальный разбор движущих и корректирующих волн
1. Внутренняя структура волны A может быть разложена на 3 сегмента, а именно сегмент 0-1, сегмент 1-2, сегмент 2-3:
• Сегмент 0-1: 126 200 долларов (06.10.2025) до 103 528 долларов (17.10.2025), продолжительность 11 дней.
• Сегмент 1-2: 103 528 долларов (17.10.2025) до 116 400 долларов (27.10.2025), продолжительность 10 дней.
• Сегмент 2-3: 116 400 долларов (21.11.2025) до 80 600 долларов (21.11.2025), продолжительность 25 дней.
2. Внутренняя структура волны B может быть разложена на 3 сегмента. А именно сегмент 3-4, сегмент 4-5, сегмент 5-6:
• Сегмент 3-4: 80 600 долларов (21.11.2025) до 94 589 долларов (09.12.2025), продолжительность 18 дней.
• Сегмент 4-5: 94 589 долларов (09.12.2025) до 84 450 долларов (18.12.2025), продолжительность 9 дней.
• Сегмент 5-6: 84 450 долларов (18.12.2025) до 97 924 долларов (14.01.2026), продолжительность 17 дней.
3、Прогноз внутренней структуры движения волны C, разделенный на следующие три формы:
Первый прогноз структуры движения (вероятность очень высокая): Внутренняя структура волны C представляет собой 3-сегментную структуру
• Сегмент 6-7 (первая движущая волна падения), цель достигнута: 97 924 доллара (14.01.2026) до 60 000 долларов (06.02.2026), продолжительность 23 дня, максимальное падение 38,7%. (Судя по времени коррекции и величине падения, высока вероятность того, что 60 000 долларов являются低点 первого сегмента коррекции внутри волны C)
• Сегмент 7-8 (ожидаемый отскок): Пунктирная часть на рисунке,即将或已开始的反弹段. Высота отскока вряд ли превысит 97 924 доллара (т.е. вершину волны B),其 ключевые зоны сопротивления можно наблюдать в областях 72 000-74 500 долларов и более высокой области 80 000-80 600 долларов.
• Сегмент 8-9 (финальный сегмент падения): Пунктирная часть на рисунке, запустит последнее падение,其 теоретический целевой интервал может быть спроецирован путем измерения амплитуды волны A,в будущем уровень 60 000 долларов будет пробит, цена монеты будет тестировать более низкие технические уровни поддержки.
Второй прогноз структуры движения (малая вероятность): Внутренняя структура волны C представляет собой 5-сегментную или более сложную структуру
Этот сценарий строится на том, что после завершения первой 3-сегментной структуры на рынке все еще не появилось четких сигналов разворота на дне, требуется повторная оценка на основе силы коррекции и типа структуры движения в тот момент. Это означает, что время коррекции значительно延长, и впоследствии она может演化 в сложные структуры, такие как «нисходящий клин» или «множественные тройные волны». Этот путь обычно вызывается持续ухудшением макроэкономической ситуации или истощением ликвидности рынка, в текущих условиях вероятность его реализации относительно мала, но полностью исключать нельзя.
Третий прогноз структуры движения (крайне малая вероятность): V-образный разворот, коррекция завершена, начался разворот
• Сегмент 6-7 (первая движущая волна падения), цель достигнута: 97 450 долларов (14.01.2026) до 60 000 долларов (06.02.2026).
• Сегмент 7-8 (V-образный разворот): Пунктирная часть на рисунке. Отскок异常мощен,不仅能有效突破 предыдущий максимум в 97 924 доллара,并能持续站稳 выше него,同时 на финансовых рынках появятся значительные благоприятные новости. Если это произойдет, это будет означать, что вся коррекция по трем волнам A-B-C, начавшаяся со 126 200 долларов, возможно, уже завершилась «упрощенной формой» на уровне 60 000 долларов. Несмотря на extremely низкую вероятность, ее触发条件 (мощный пробой 97 924 доллара)清晰可辨, может служить ключевым观察信号лом разворота тренда.
В综上所述, приведенные выше три сценария движения являются лишь прогнозами, основанными на логике поведения рынка, и не являются неизбежными путями. Независимо от того, как развивается行情, следует всегда помнить принцип: «Рынок всегда прав».
二、Операционные стратегии по биткоину на прошлой неделе и обзор ключевых уровней: (02.02~02.08)
1、Обзор краткосрочной операционной стратегии: Как показано на (Рис. 2)
Мы строго следовали торговым сигналам, подаваемым нашей собственной моделью торговли по спредам и квантовой моделью импульса,并结合 прогнозом движения рынка, выполнили две краткосрочные операции, совокупная прибыль по сделкам составила 10,72%.
Конкретные детали сделок и复盘如下:
1、Демонстрация результатов краткосрочной торговли: (Плечо*1x)
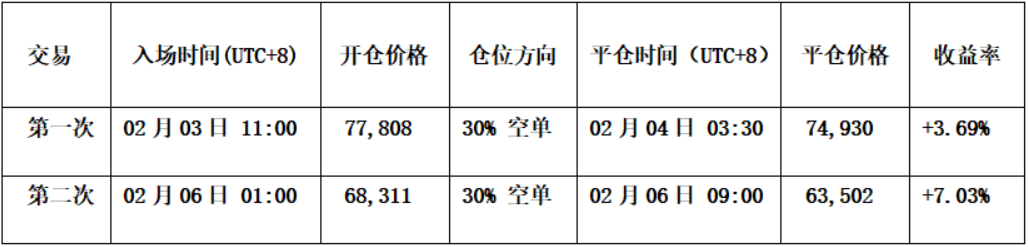
Рисунок 2
2、Разбор краткосрочных сделок:
• Первая сделка (прибыль 3,69%):
• Открытие позиции: Отскок встретил сопротивление на уровне давления 80 000 долларов в сочетании с двумя сигналами резонанса на продажу от моделей, открыта 30% короткая позиция на уровне 77 808 долларов.
• Управление рисками: Начальный стоп-лосс для короткой позиции на уровне 81 000 долларов.
• Закрытие позиции: Падение до near уровня поддержки 74 500 долларов в сочетании с сигналом дна от модели спреда (красная точка) и сигналом разворота от комбинации свечей, полное закрытие на уровне 74 930 долларов.
• Вторая сделка (прибыль 7,03%):
• Открытие позиции: Отскок встретил сопротивление на уровне давления 69 000 долларов в сочетании с двумя сигналами резонанса на продажу от моделей, открыта 30% короткая позиция на уровне 68 311 долларов.
• Управление рисками: Начальный стоп-лосс для короткой позиции на уровне 71 000 долларов.
• Закрытие позиции: Падение до near уровня поддержки 63 000 долларов в сочетании с двумя сигналами резонанса дна от моделей, полное закрытие на уровне 63 502 доллара.
30-минутный график биткоина: (Квантовая модель импульса + Модель торговли по спредам)
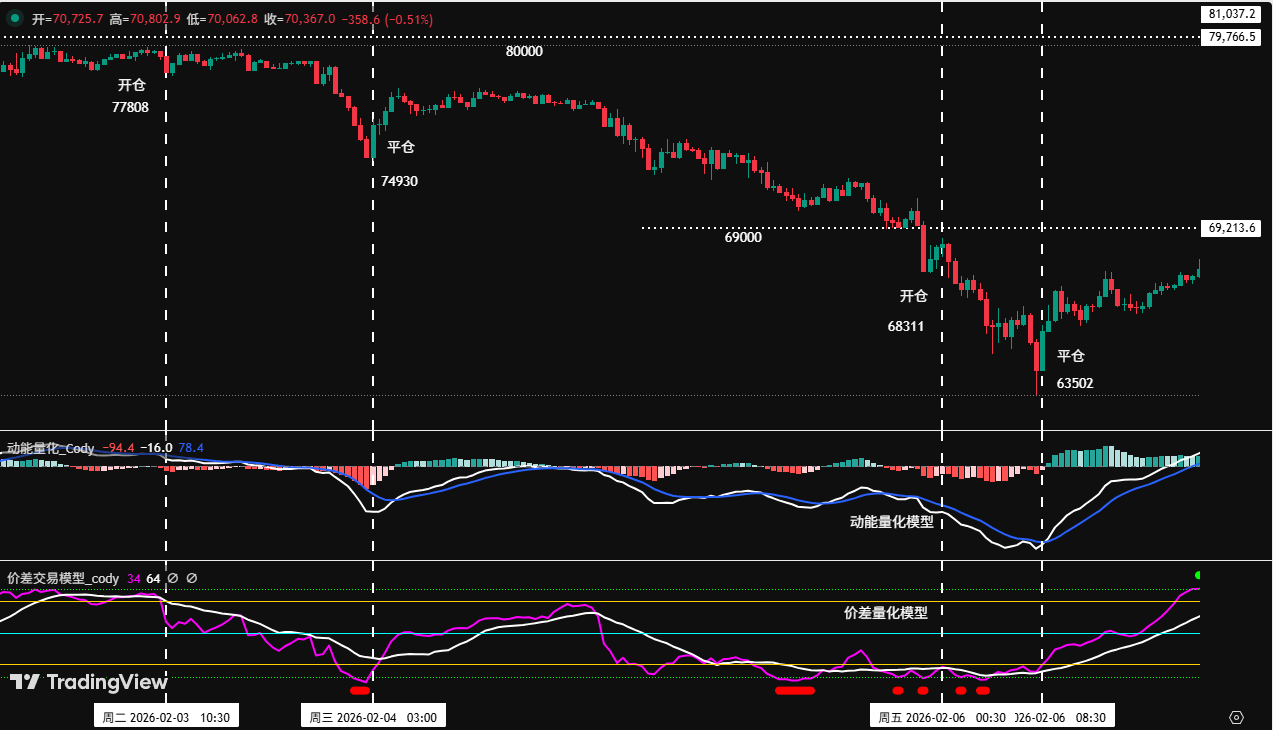
Рисунок 3
2、 Обзор среднесрочной операционной стратегии:
Среднесрочная стратегия: Согласно плану, продолжаем удерживать 60% короткую позицию, открытую near уровня 89 000 долларов.
3、 Обзор ключевых уровней за прошлую неделю:
Уровень сопротивления наблюдать в области 80 000~80 600 долларов;
Первый уровень поддержки наблюдать в 72 000-74 500 долларов, второй уровень поддержки наблюдать в области 69 000-72 500 долларов.
三、Анализ технических индикаторов движения биткоина на текущей неделе: (02.09~02.15)
Совмещая с движением рынка, автор на основе собственной построенной торговой системы проводит深度анализ структуры движения биткоина с multipleуровней, таких как multipleмодели и multipleизмерения.
1、Как показано на (Рис. 4), анализ на недельном графике:
Недельный график биткоина: (Квантовая модель импульса + Квантовая модель настроений)
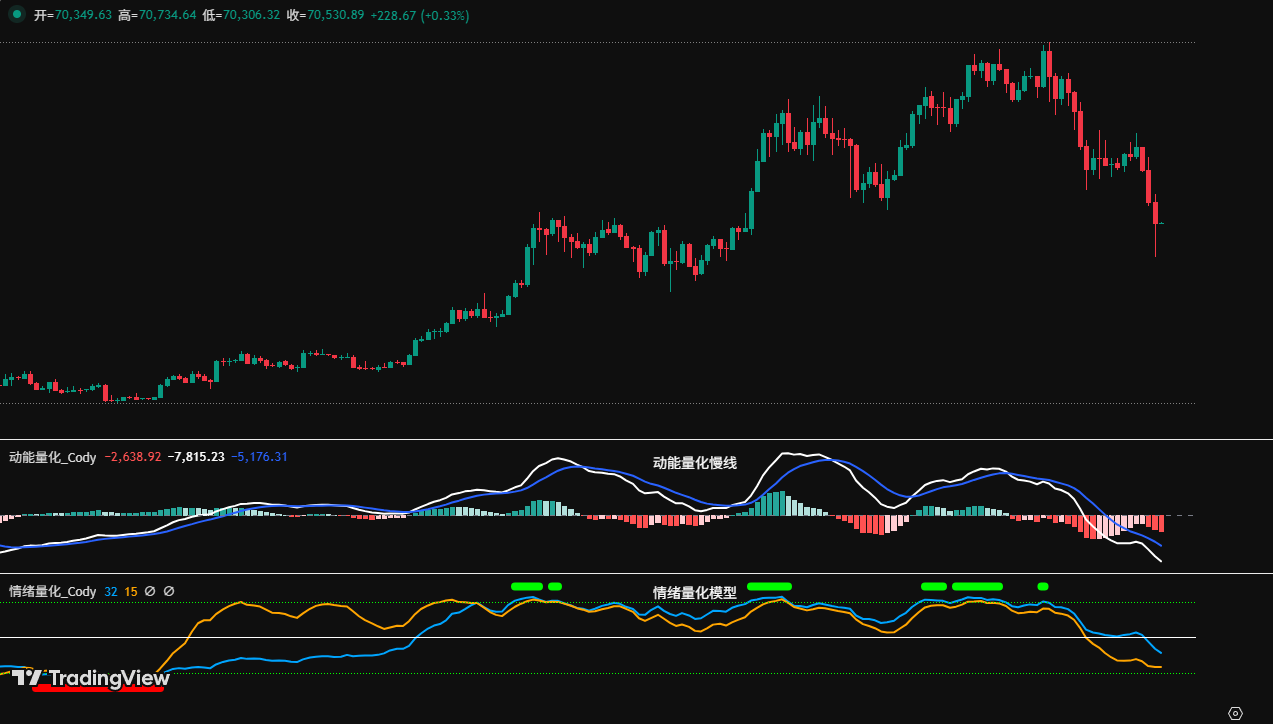
Рисунок 4
• Квантовая модель импульса: Технические индикаторы показывают, что на прошлой неделе импульс продаж further释放, две линии импульса同步下降, отрицательные столбцы энергии постепенно увеличиваются,呈现 состояние ускоренной коррекции.
Квантовая модель импульса предсказывает: Индекс падения цены монеты: Высокий
• Квантовая модель настроений: Значение синей линии настроений 38, интенсивность ноль; значение желтой линии настроений 11, интенсивность ноль, пиковое значение 0.
Квантовая модель настроений предсказывает: Индекс поддержки дна цены монеты: Нейтральный
• Модель цифрового мониторинга: Сигналы цифрового мониторинга (вершины/дна) не появились.
Модель цифрового мониторинга предсказывает: Сигналы дна не появились; Недельная свеча закрылась большой медвежьей свечой с длинной нижней тенью, падение около 8,63%.
Вышеуказанные данные预示: На недельном графике биткоина медвежий тренд, но есть признаки краткосрочного ослабления импульса продаж.
2、Как показано на (Рис. 5), анализ на дневном графике:
Дневной график биткоина: (Квантовая модель импульса + Квантовая модель настроений)
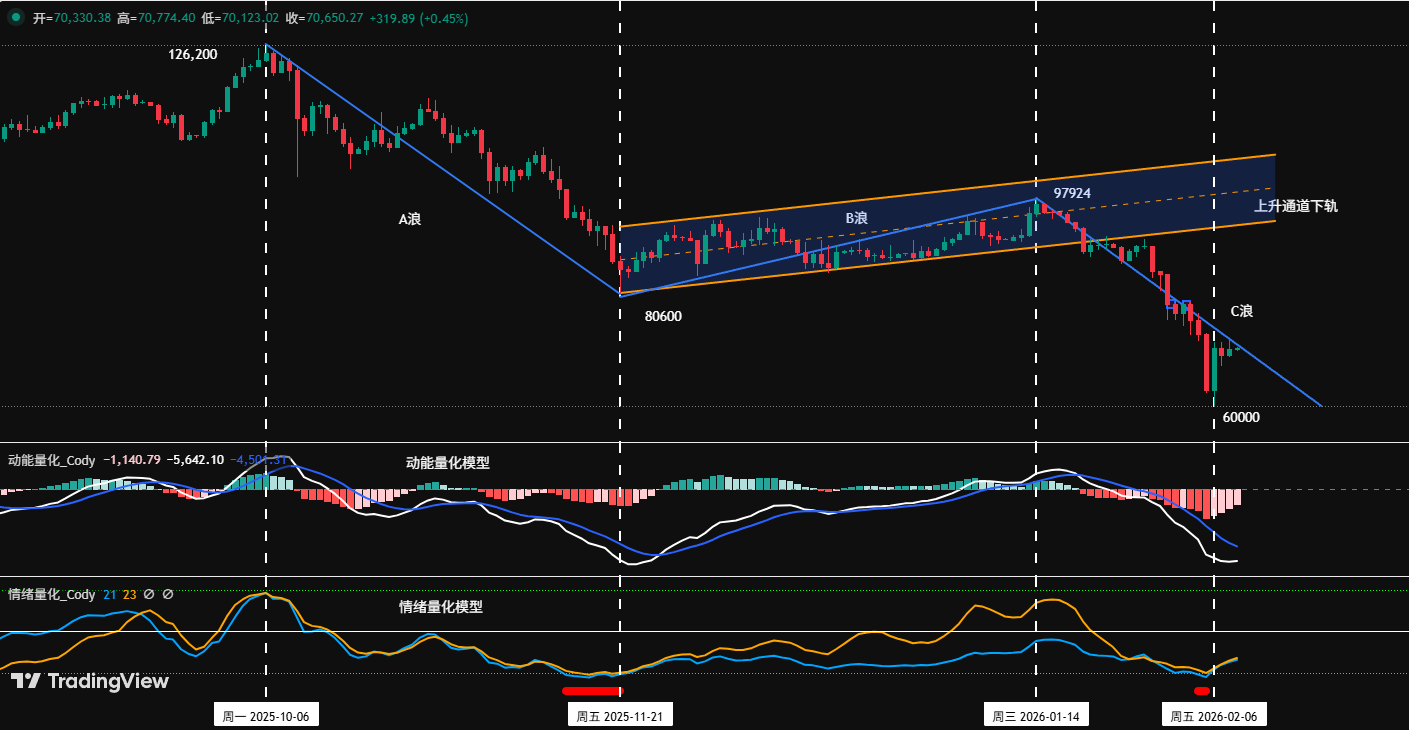
Рисунок 5
• Квантовая модель импульса: На прошлой неделе в целом呈现格局 ускоренного падения-отскока от дна. После закрытия недели белая линия импульса замедлила下降, отрицательные столбцы энергии постепенно сокращаются в течение 3 дней подряд.
Квантовая модель импульса предсказывает: На дневном таймфрейме медвежий тренд, быки начали сопротивляться.
• Квантовая модель настроений: После закрытия прошлой недели модель настроений triggered сигнал предупреждения о дне (красная точка), после чего две линии настроений начали разворачиваться向上.
Квантовая модель настроений предсказывает: Сила поддержки постепенно усиливается
Вышеуказанные данные указывают: На дневном таймфрейме все еще медвежий тренд, но triggered краткосрочный сигнал предупреждения о дне, краткосрочный отскок уже начался.
四、Прогноз行情 на текущую неделю: (02.09~02.15)
1、Ключевая точка зрения на неделю: Наблюдать, будет ли пробит минимум прошлой недели 60 000 долларов, следить за силой отскока от перепроданности, запущенного с этого уровня. (Если цена монеты пробивает 60 000 долларов, то коррекция细分сегмента 6-7 волны C все еще продолжается, отскок от точки 7 еще не начался)
2、Ключевые уровни сопротивления:
• Первая зона сопротивления: Область 72 000-74 500 долларов (near минимума апреля прошлого года)
• Вторая зона сопротивления: Область 80 000-80 600 долларов (near точки запуска волны B)
3、Ключевые уровни поддержки:
• Первый уровень поддержки: Область 60 000-62 500 долларов (near недавнего минимума коррекции)
• Второй уровень поддержки: Около 57 400 долларов (near 210-недельной скользящей средней)
• Важный уровень поддержки: Около 52 500 долларов (near симметричной точки падения волны A в 1 раз)
五、Операционная стратегия на текущую неделю (исключая влияние внезапных новостей): (02.09~02.15)
1、 Среднесрочная стратегия: Сохранять 60% короткую позицию. Если отскок эффективно突破 уровень 74 500 долларов, можно уменьшить объем позиций до 40%.
2、 Краткосрочная стратегия: Используя 30% объема, устанавливая стоп-лосс, ища возможности для сделок по «спредам» на основе уровней поддержки и сопротивления. (В качестве операционного цикла использовать 30 минут/60 минут).
3、 В операциях, для динамического应对 рыночных изменений并结合 сигналов моделей в реальном времени, мы拟定A/B два варианта краткосрочных операций:
• Вариант A: Если цена монеты отскакивает до области 74 500~75 200 долларов и встречает сопротивление:
• Открытие позиции: При отскоке в эту область triggered сигнал сопротивления并结合 сигнал вершины от модели, можно открыть 15% короткую позицию.
• Управление рисками: Начальный стоп-лосс для короткой позиции устанавливается выше цены входа на 1,5% (т.е. 1,015*цена входа).
• Закрытие позиции: При падении до важного уровня поддержки并结合 сигналов модели, можно постепенно закрывать позиции и фиксировать прибыль.
• Вариант B: Если цена монеты отскакивает до области 80 000~80 600 долларов и встречает сопротивление:
• Открытие позиции: При отскоке в эту область и сопротивлении并结合 сигналом вершины от модели, можно открыть 30% короткую позицию.
• Управление рисками: Начальный стоп-лосс для короткой позиции устанавливается выше цены входа на 1,5% (т.е. 1,015*цена входа).
• Закрытие позиции: При падении до уровня поддержки并结合 сигналов модели, можно постепенно закрывать позиции и фиксировать прибыль.
六、Особые указания:
1. При открытии позиции: Немедленно установить начальный стоп-лосс.
2. При достижении прибыли в 1%: Переместить стоп-лосс на цену входа (точка безубыточности), обеспечивая безопасность本金.
3. При достижении прибыли в 2%: Переместить стоп-лосс на уровень прибыли в 1%.
4. Постоянное отслеживание: В дальнейшем при каждой последующей прибыли в 1% цена монеты, стоп-лосс также同步移动ется на 1%, динамически защищая и фиксируя прибыль.


