Автор | Jeff Park (Главный инвестиционный директор Bitwise)
Компиляция | Odaily星球日报(@OdailyChina)
Переводчик | Дин Дан (@XiaMiPP)
Примечание редактора: 5 февраля крипторынок снова пережил резкое падение. За 24 часа объём ликвидаций превысил 2,6 миллиарда долларов, а биткоин в какой-то момент рухнул до 60 000 долларов. Однако рынок, похоже, не пришёл к чёткому консенсусу относительно причин этого падения. Главный инвестиционный директор Bitwise Джефф Парк предлагает новый аналитический подход с точки зрения опционов и механизмов хеджирования.

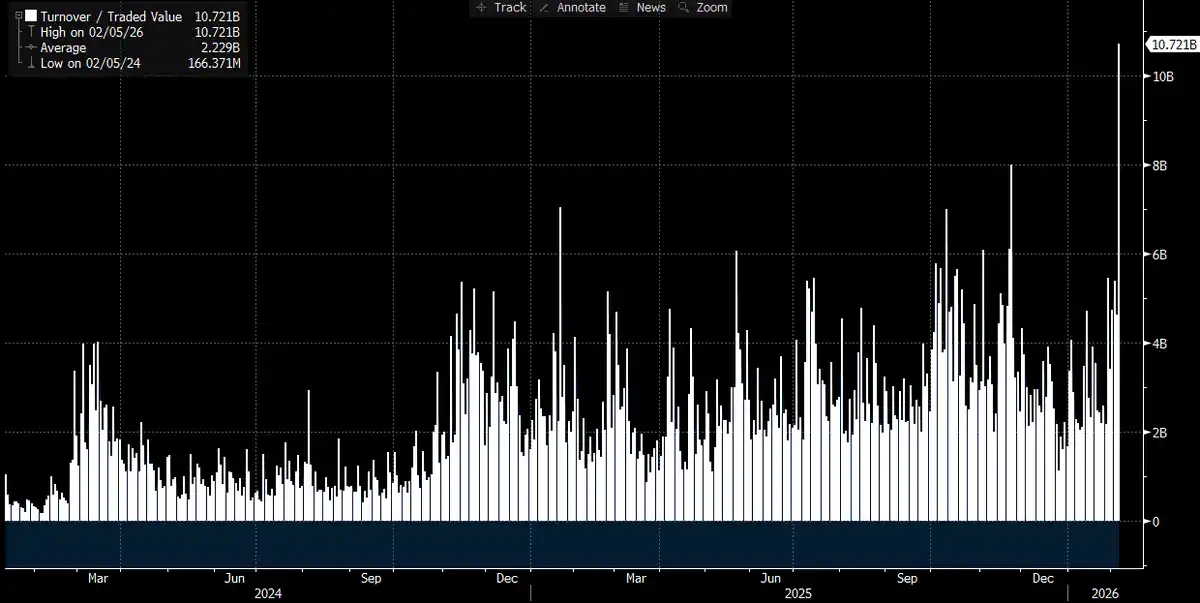
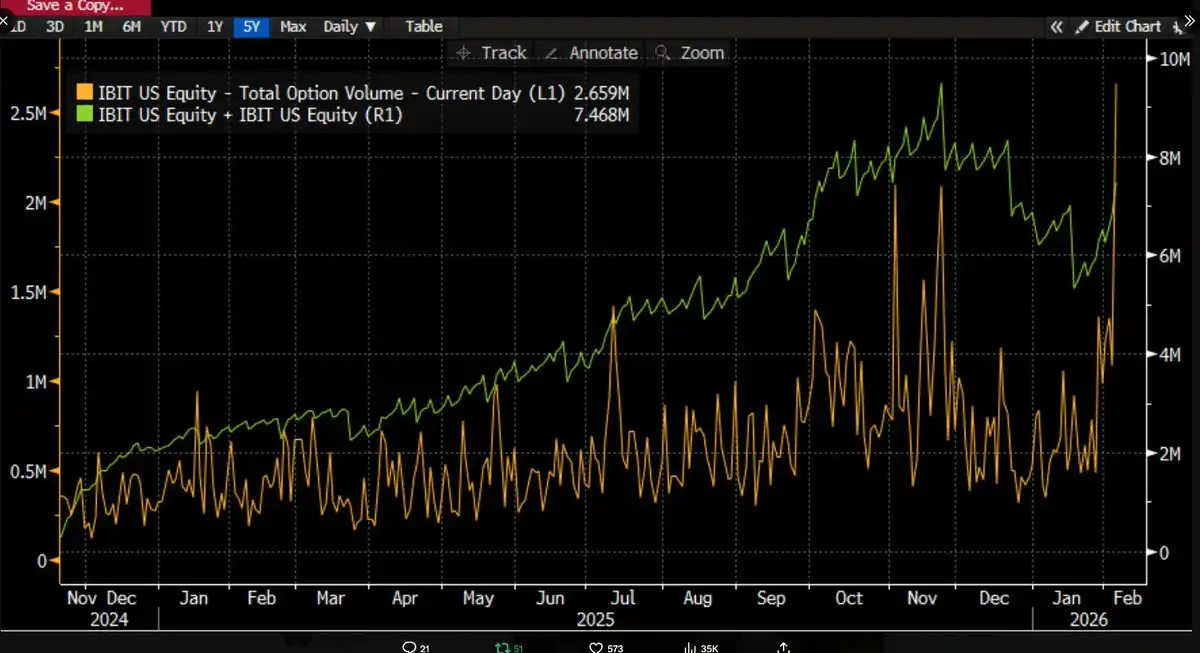
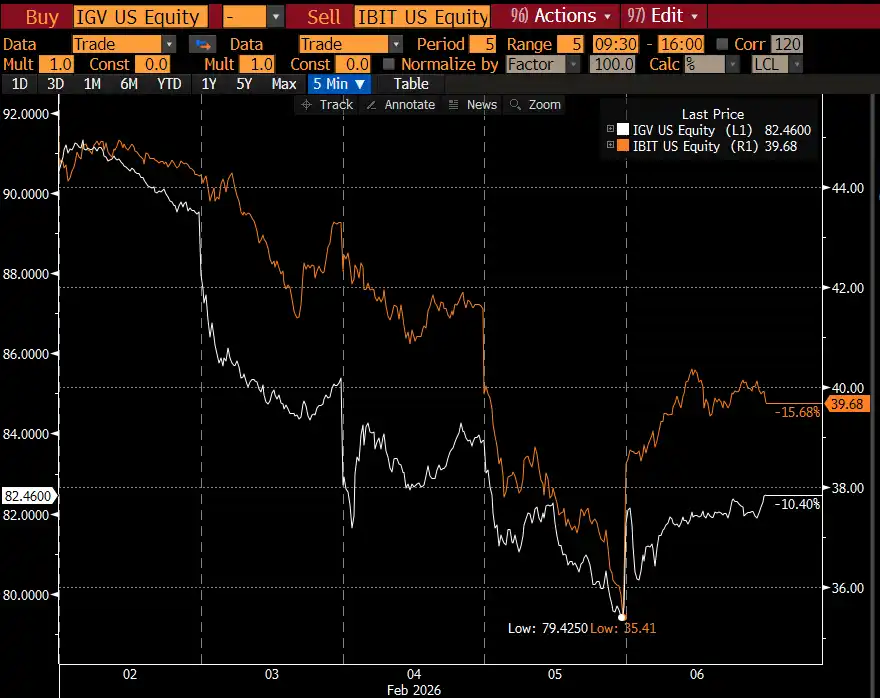
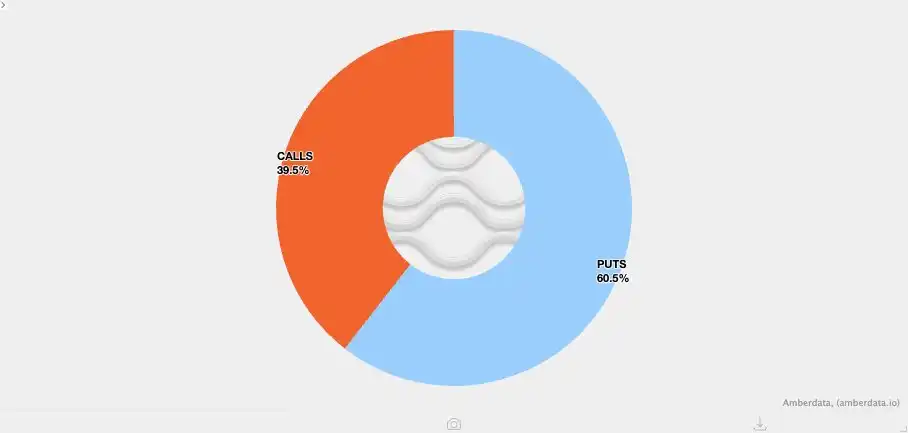
Со временем, по мере поступления новых данных, ситуация проясняется: эта резкая распродажа, вероятно, связана с биткоин-ETF, и сам этот день стал одним из самых волатильных торговых дней на рынках капитала за последние годы. Мы пришли к такому выводу, потому что в тот день объём торгов IBIT достиг рекордного уровня — оборот превысил 10 миллиардов долларов, что в два раза больше предыдущего рекорда (действительно впечатляющая цифра), одновременно с этим был побит рекорд объёма опционов (см. графики ниже, это самое большое количество контрактов с момента запуска этого ETF). Что несколько необычно по сравнению с прошлым, так это структура объёма: на этот раз опционные сделки явно доминировали путами, а не коллами (об этом подробнее позже).
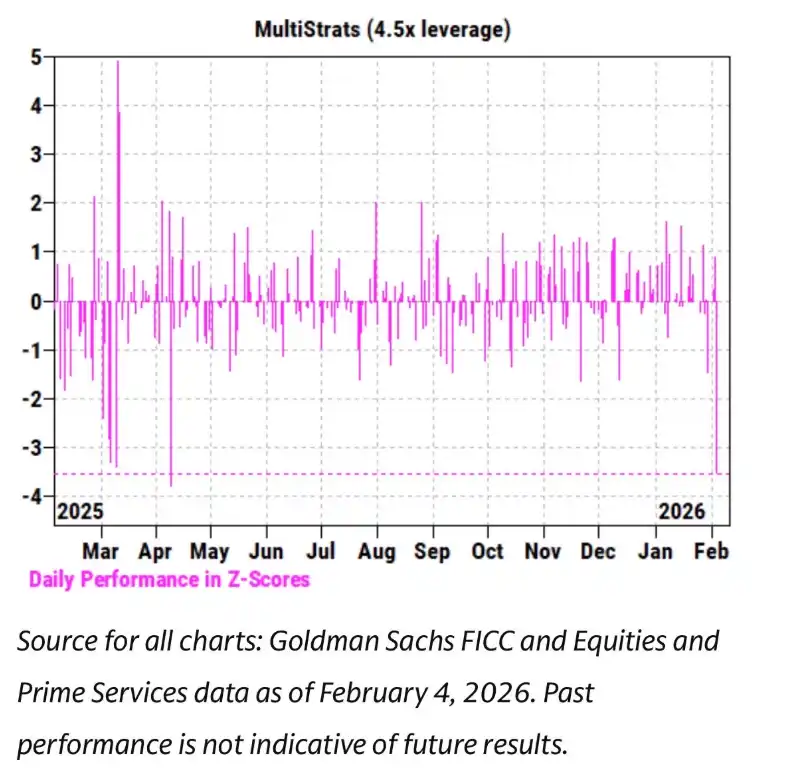
В то же время за последние несколько недель мы наблюдали чрезвычайно тесную корреляцию между динамикой IBIT и акциями софтверных компаний, а также другими рискованными активами. Команда Prime Brokerage (PB) Goldman Sachs также опубликовала отчёт, в котором указано, что 4 февраля стало одним из худших дней в истории для мультистратегических фондов с Z-score, достигшим 3,5. Это означает, что это экстремальное событие с вероятностью всего 0,05%, что в 10 раз реже, чем событие 3-сигма (классический порог «чёрного лебеда», вероятность около 0,27%). Можно сказать, это был катастрофический шок. Именно после таких событий риск-менеджеры мультистратегических фондов (pod shop) быстро вмешиваются, требуя от всех торговых команд немедленно, без разбора и срочно снизить плечо. Это объясняет, почему 5 февраля также превратилось в кровавую баню.
При таком количестве побитых рекордов и чётком нисходящем направлении цены (падение на 13,2% за день) мы изначально ожидали с высокой вероятностью увидеть чистый отток из ETF. Ссылаясь на исторические данные, такое предположение не было надуманным: например, 30 января, после падения на 5,8% в предыдущий торговый день, IBIT показал рекордный отток в 530 миллионов долларов; или 4 февраля, на фоне непрерывного падения, IBIT показал отток около 370 миллионов долларов. Поэтому в рыночных условиях 5 февраля ожидать оттока средств как минимум на 5-10 миллиардов долларов было совершенно разумно.
Но произошло обратное — мы увидели широкий чистый приток. В тот день IBIT добавил около 6 миллионов паёв, что соответствовало росту активов под управлением более чем на 230 миллионов долларов. В то же время другие биткоин-ETF также зафиксировали приток средств, и вся система ETF в совокупности привлекла более 300 миллионов долларов чистого притока.
Этот результат несколько озадачивает. Теоретически можно предположить, что сильное восстановление цены 6 февраля в некоторой степени снизило давление на отток, но переход от «возможного сокращения оттока» к «чистому притоку» — это совсем другое дело. Это означает, что, вероятно, одновременно действовали несколько факторов, но эти факторы не складываются в единую, линейную нарративную структуру. Основываясь на имеющейся у нас на данный момент информации, можно выдвинуть несколько разумных предпосылок, и на их основе я изложу свои общие выводы.
Во-первых, эта распродажа биткоина, вероятно, затронула определённый тип мульти-ассетных портфелей или стратегий, не являющихся чисто криптовалютными. Это могли быть упомянутые выше мультистратегические хедж-фонды, или же средства, подобные модельным инвестиционным портфелям BlackRock, которые распределяли средства между IBIT и IGV (софтверный ETF) и были вынуждены проводить автоматическую ребалансировку в условиях высокой волатильности.
Во-вторых, ускорение распродажи биткоина, вероятно, связано с опционным рынком, особенно с опционными структурами, связанными с нисходящим направлением.
В-третьих, эта распродажа в конечном итоге не превратилась в отток средств на уровне активов биткоина, что означает, что основная движущая сила行情 исходила из «системы бумажных денег», то есть от корректировки позиций,主导рованной дилерами и маркет-мейкерами, в целом находящихся в хеджированном состоянии.
Основываясь на вышеизложенном, моя текущая ключевая гипотеза такова.
- Непосредственным катализатором этой распродажи стало широкое снижение плеча мульти-ассетными фондами и портфелями после того, как нисходящая корреляция рискованных активов достигла статистически аномального уровня.
- Этот процесс затем спровоцировал чрезвычайно резкое снижение плеча, которое также включало экспозицию к биткоину, но значительная часть этого риска фактически находилась в хеджированных позициях с «дельта-нейтральностью», таких как базисные сделки, сделки относительной стоимости (например, биткоин против крипто-акций) и другие структуры, где оставшийся дельта-риск обычно «упаковывается» дилерской системой.
- Это снижение плеча затем вызвало эффект короткой гаммы (short Gamma) и further усилило нисходящее давление, вынудив thereby дилеров продавать IBIT. Но поскольку распродажа была слишком стремительной, маркет-мейкеры были вынуждены чисто шортить биткоин, не считаясь с собственными запасами. Этот процесс, в свою очередь, создал новые запасы ETF, thereby снизив изначальные ожидания масштабного оттока средств.
Затем, 6 февраля, мы наблюдали положительный приток средств в IBIT, некоторые покупатели IBIT (вопрос в том, к какой категории они принадлежали) выбрали возможность配置 на падении после снижения, что further компенсировало возможный незначительный чистый отток.
Во-первых, я лично склоняюсь к тому, что первоначальный катализирующий фактор этого события исходил от распродажи софтверных акций, особенно учитывая высокую корреляцию, продемонстрированную между биткоином и софтверными акциями, которая даже выше, чем его корреляция с золотом. Пожалуйста, обратитесь к двум графикам ниже.
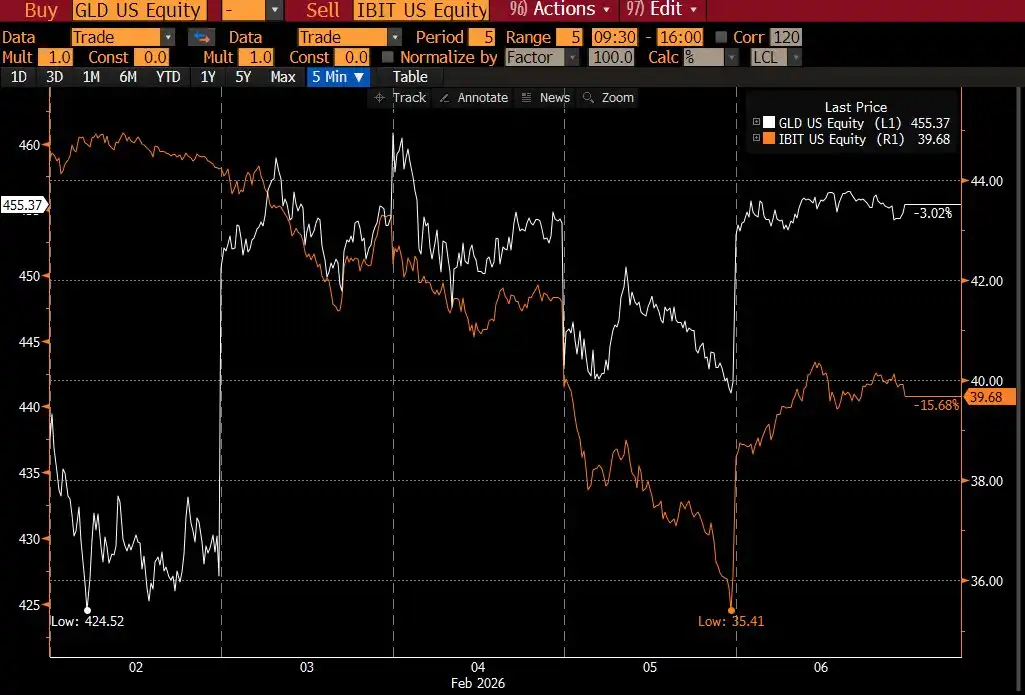
Это логично, потому что золото обычно не является активом, которым в больших количествах владеют мультистратегические фонды, участвующие в маржинальной торговле, хотя оно может присутствовать в модельных портфелях RIA (заранее разработанные схемы распределения активов). Поэтому, на мой взгляд, это further подтверждает вывод о том, что центр本轮动荡, скорее всего, находится within системе мультистратегических фондов.
И второй вывод therefore кажется более reasonable, а именно, что этот процесс резкого снижения плеча действительно включал в себя биткоин-риск, находящийся в хеджированном состоянии. В качестве примера можно привести базисные сделки с биткоином на CME, которые долгое время были одной из самых предпочитаемых торговых стратегий мультистратегических фондов.
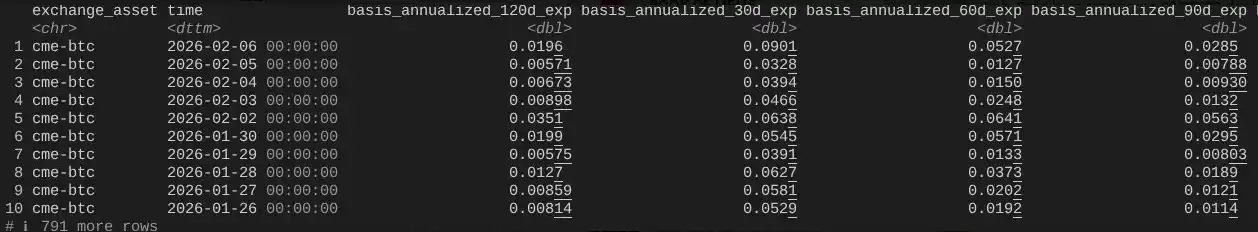
Если посмотреть на полные данные с 26 января по вчерашний день, охватывающие динамику базиса биткоина на CME со сроками 30, 60, 90, 120 дней (благодарю ведущего отраслевого исследователя @dlawant за предоставленные данные), можно чётко увидеть, что ближний базис 5 февраля подскочил с 3,3% до 9%. Это один из самых больших скачков, которые мы лично наблюдали на рынке с момента запуска ETF, что почти однозначно указывает на вывод: базисные сделки были принудительно закрыты в large scale по указанию.
Просто представьте себе такие учреждения, как Millennium, Citadel, вынужденные强行 закрывать позиции по базисным сделкам (продавать спот, покупать фьючерсы). Учитывая их объём в системе биткоин-ETF, нетрудно понять, почему эта операция оказала такое сильное воздействие на общую рыночную структуру. Я и ранее писал о своих размышлениях на этот счёт.
Odaily星球日报补充: В настоящее время большое количество таких неразборчивых локальных распродаж в США, вероятно, исходит от мультистратегических хедж-фондов. Эти фонды часто используют стратегии дельта-хеджирования или проводят сделки относительной стоимости (RV) или факторно-нейтральные сделки, которые в настоящее время расширяют спреды, возможно, accompanied перетеканием корреляции акций роста.
Грубая оценка: около 1/3 биткоин-ETF принадлежит институциональным типам, и about 50% (возможно, больше) из них, как считается, принадлежат хедж-фондам. Это значительный объём «быстрых денег», которые легко капитулируют и закрываются, когда стоимость финансирования или требования к марже растут в условиях current высокой волатильности и вмешиваются риск-менеджеры, особенно когда доходность базиса больше не оправдывает принимаемую премию за риск. Стоит отметить, что сегодня объём торгов MSTR в долларах является одним из самых высоких в its истории.
Вот почему最大的因素, способствующий最容易倒闭 хедж-фондов, это печально известный «риск совладельца»: несколько seemingly независимых фондов hold高度相似的 экспозиции, и когда рынок идёт вниз,все одновременно устремляются к одному узкому выходу, заставляя все нисходящие корреляции стремиться к 1. Продажа в условиях such плохой ликвидности today — это классическое поведение «закрытия риска», которое мы сегодня и наблюдаем. В конечном итоге это отразится в данных о потоках ETF. Если эта гипотеза верна, я подозреваю, что после всей этой清算 цены будут быстро переоценены, однаковосстановление доверия займёт некоторое время.
Это подводит нас к третьей подсказке. Поскольку мы поняли, почему IBIT был распродан на фоне широкого снижения плеча, вопрос заключается в следующем: что именно ускоряло падение? Возможным «катализатором» могли выступить структурированные продукты. Хотя я не считаю, что рынок структурированных продуктов достаточно велик, чтобы单独 вызвать эту распродажу,但当 все факторы аномально и идеально выстроились одновременно способом, выходящим за рамки любых ожиданий моделей VaR (стоимости под риском), они完全可以 стать острым событием, запускающим каскад ликвидаций.
Это сразу же напомнило мне мой опыт работы в Morgan Stanley. Там структурированные продукты с knock-in put барьерами (опцион «активируется» и становится действующим пут-опционом только тогда, когда цена базового актива достигает/преодолевает определённый барьерный уровень) часто имели极具разрушительные последствия. В некоторых случаях дельта опциона могла изменяться более чем на 1, что явление, которое даже не рассматривается в стандартной модели Black-Scholes — потому что в стандартного Black-Scholes для обычных ванильных опционов (самые basic европейские кол/пут опционы), дельта опциона никогда не может превышать 1
Возьмём, к примеру, note, выпущенный JPMorgan в ноябре прошлого года,可以看到其 барьер knock-in был установлен как раз на уровне 43,6. Если эти notes продолжали выпускаться в декабре, а цена биткоина упала ещё на 10%, то можно представить, что в диапазоне 38–39 скопилось бы большое количество барьеров knock-in, что и является所谓的«глазом бури».
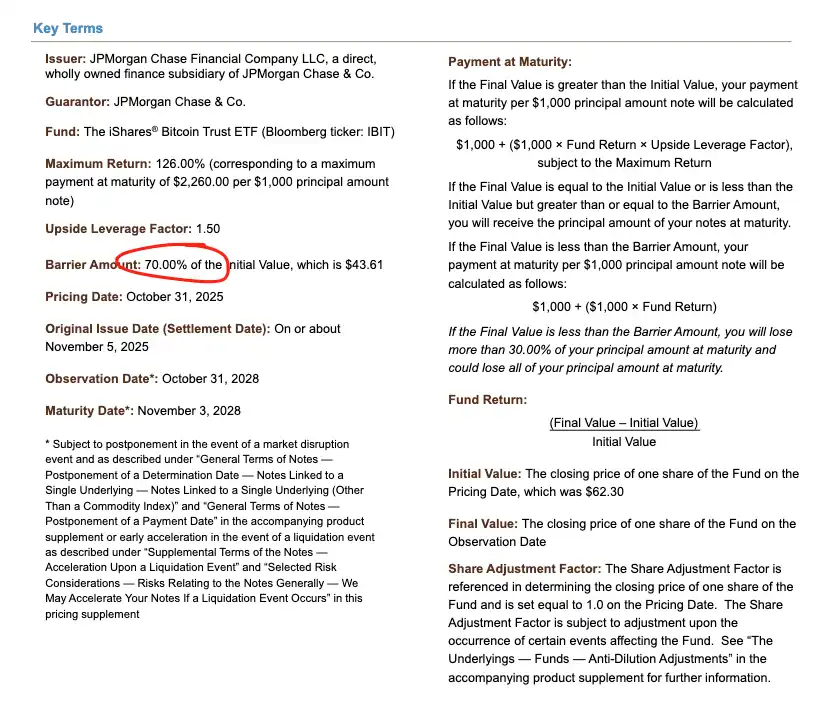
В случае пробития этих барьеров, если дилеры хеджировали риск knock-in путем продажи пут-опционов и т.д., то при отрицательной динамике Vanna скорость изменения Gamma была бы极其стремительной. В this случае, как дилер, единственный可行ный способ действий — это агрессивно продавать базовый актив на ослаблении рынка. Именно это мы и наблюдали: подразумеваемая волатильность (IV) рухнула до исторических экстремумов,接近 90%, почти до состояния катастрофического сжатия, в such ситуации дилеры были вынуждены увеличить规模шортовой позиции по IBIT до степени, когда в конечном итоге создавались чистые новые паи ETF. Эта часть действительно требует определённой доли домысливания, и её трудно полностью подтвердить при отсутствии более подробных данных о спредах, но учитывая рекордный объём торгов в тот день и активное участие уполномоченных участников (AP), такая ситуация完全有可能.
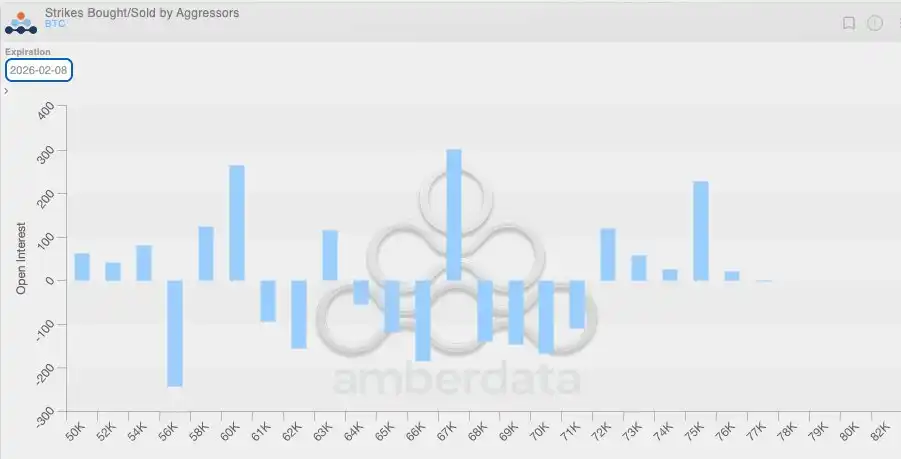
Сочетание этой отрицательной динамики Vanna с другим фактом делает логику ещё более清晰. Из-за generally низкой волатильности в предыдущий период клиенты нативно криптовалютного рынка в последние несколько недели generally были склонны покупать пут-опционы. Это означает, что крипто-дилеры сами по себе находились в состоянии естественной короткой гаммы, и moreover недооценивали в ценообразовании возможные сверх幅波动. Когда произошло真正大幅ное движение, этот структурный дисбаланс further усилил нисходящее давление. График распределения позиций ниже также чётко показывает это: в диапазоне 64–71 тысяча долларов дилеры в основном были сосредоточены на коротких гамма-позициях по пут-опционам.
Это возвращает нас к 6 февраля, когда биткоин совершил strong отскок более чем на 10%. Здесь值得注意的现象 заключается в том, что открытый интерес (OI) на CME расширялся明显быстрее, чем на Binance(再次感谢 @dlawant за синхронизацию почасовых данных до 16:00 по восточному времени США). С 4 по 5 февраля可以清楚看到明显的 collapse OI на CME, что再次 подтверждает вывод о массовом закрытии базисных сделок 5 февраля; а 6 февраля эти позиции, возможно, были重建лены, чтобы воспользоваться более высоким уровнем базиса, thereby компенсировав влияние оттока средств.
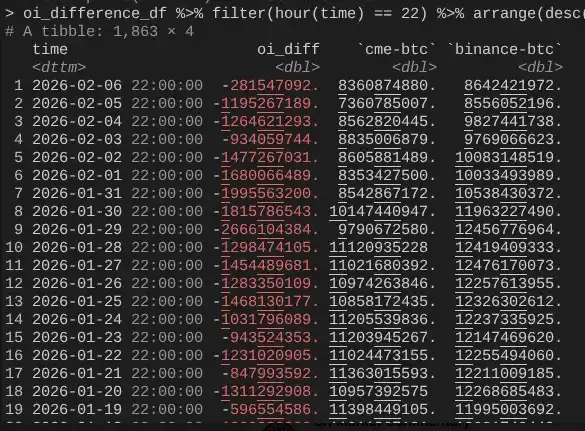
На этом логическая цепочка замыкается: IBIT в плане подписки и погашения в целом остался на прежнем уровне, потому что базисные сделки на CME восстановились; но цены оставались偏低, потому что OI на Binance показал明显的 collapse, что означает, что значительная часть давления на снижение плеча исходила от коротких гамма-позиций и форс-мажорных ликвидаций в нативно криптовалютном рынке.
Вышеизложенное — моё лучшее объяснение поведения рынка 5 февраля и последующего 6 февраля. Это рассуждение основано на нескольких предположениях и не полностью удовлетворительно, потому что у него нет чёткого «виновника», которого можно было бы винить (как, например, в случае с FTX). Но ключевой вывод таков: спусковым крючком本轮распродажи послужило снижение рисков в традиционных финансах вне криптосферы, и этот процесс恰好 подтолкнул цену биткоина к диапазону, где хеджирование короткой гаммы ускоряло падение. Это падение было вызвано не направленным медвежьим настроем, а потребностью в хеджировании, и в конечном итоге迅速развернулось 6 февраля (к сожалению, это разворот в основном принесло пользу рыночно-нейтральным капиталам в традиционных финансах, а не направленным стратегиям в криптосекторе). Хотя этот вывод может быть не самым exciting, но, по крайней мере, можно быть несколько спокойнее, зная, что распродажа предыдущего дня, вероятно, не имеет отношения к событиям 10/10.
Да, я не считаю, что произошедшее на прошлой неделе является продолжением процесса снижения плеча 10/10. Я читал статью, в которой暗示, что эта нестабильность могла исходить от неамериканского фонда со штаб-квартирой в Гонконге, который участвовал в кэрри-трейде иен и в конечном итоге потерпел неудачу. Но у этой теории есть два очевидных изъяна. Во-первых, я не верю, что не-криптовалютный prime broker согласился бы предоставлять услуги для such сложной мульти-ассетной сделки,同时还 предоставляя缓冲 по марже长达 90 дней, и при ужесточении risk-фреймворка ещё не погрузился бы в состояние неплатежеспособности заранее. Во-вторых, если кэрри-трейд资金 «спасался» путем покупки опционов на IBIT, то падение цены биткоина само по себе не ускорило бы высвобождение риска — эти опционы просто стали бы вне денег, их греки быстро归零. Это означает, что сама сделка должна была содержать реальный нисходящий риск. Если кто-то longing кэрри-трейд USD/JPY и одновременно selling пут-опционы на IBIT, то such prime broker, откровенно говоря,根本不配继续存在.
Следующие несколько дней будут极其关键, потому что мы получим больше данных, чтобы определить, используют ли инвесторы это падение для создания нового спроса, и если да, то это будет очень бычий сигнал. На данный момент я довольно воодушевлён потенциальным притоком средств в ETF. Я по-прежнему firmly верю, что настоящие покупатели ETF в стиле RIA (а не хедж-фонды относительной стоимости) — это проницательные инвесторы, и на институциональном уровне мы наблюдаем множество реальных и глубоких进展, что十分明显 в процессе продвижения всей отрасли, а также среди моих друзей в Bitwise. В связи с этим я уделяю пристальное внимание чистому притоку средств, который не сопровождается расширением базисных сделок.
Наконец, всё это также再次表明, что биткоин интегрировался в глобальные финансовые рынки капитала极其复杂和成熟的方式. Это также означает, что когда рынок в будущем окажется на стороне обратного сжатия, восходящий тренд будет более крутым, чем когда-либо прежде.
Хрупкость правил маржи в традиционных финансах — это и есть антихрупкость биткоина. Как только начнётся отскок цен — а я считаю это неизбежным, особенно после того, как Nasdaq повысил лимиты на открытый интерес по опционам — это будет极其壮观ное зрелище.


