Автор: Curry, Deep Tide TechFlow
Престижным трейдерам на американском фондовом рынке последние полгода живется довольно привольно.
Индексы S&P 500 и Nasdaq 100 по очереди обновляют исторические максимумы, история капитальных затрат на ИИ становится все масштабнее, а чистая стоимость счетов растет как на дрожжах. В то же время биткойн откатился примерно с 126 000 долларов в октябре прошлого года до уровня около 80 000 долларов, просев на 37%, и у держателей монет, вероятно, осталось лишь одно ощущение:
Томительное ожидание.
Эта разница в настроениях превращается в социальных сетях в новую нарративную линию: покупать акции технологических компаний США лучше, чем покупать биткойн, и так было большую часть времени.
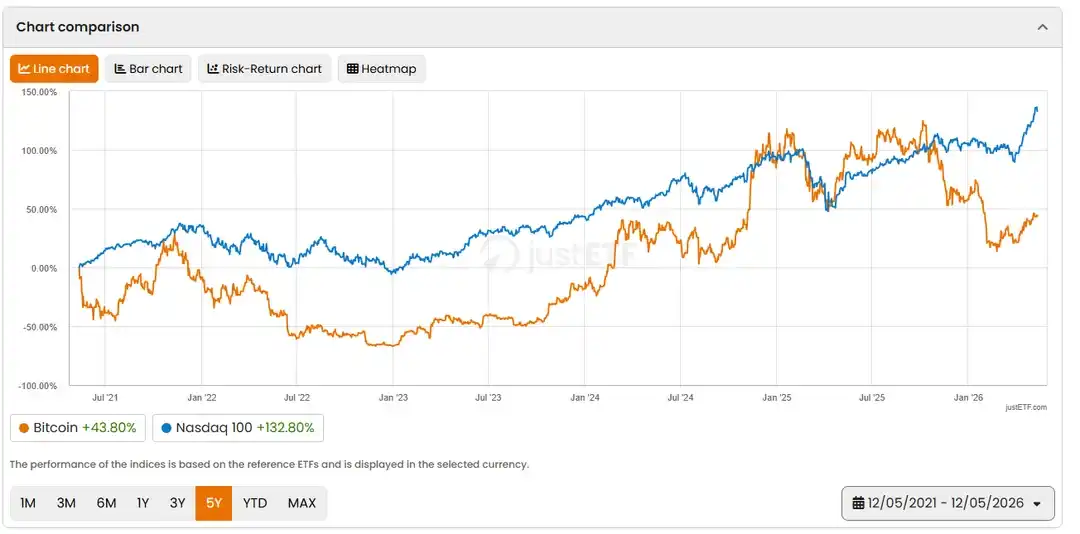
В сегодняшней крипто-секции Reddit даже появился пост, который материализовал эти настроения. Один пользователь опубликовал сравнительный график: за последние 5 лет Nasdaq 100 вырос на 132,8%, а биткойн всего на 43,8%.
Стоит обратить внимание, что на графике используется европейский формат даты ДД/ММ/ГГГГ, фактический временной промежуток — с 12 мая 2021 года по 12 мая 2026 года, а за основу взяты ETF, номинированные в евро.
С 2021 года доллар подорожал примерно на 18% по отношению к евро, и эффект курсовой разницы дополнительно усилил рост активов в долларах с точки зрения евро. Если пересчитать в чистую цену в долларах, рост Nasdaq 100 за тот же период составил около 121%, биткойна — около 43%, разница остается значительной.
Резюме самого автора поста еще более неприятное: «Что вообще происходит? Думаю, ответ в том, что ИИ все изменил».
В феврале этого года Bloomberg также публиковал аналогичный отчет, название которого было еще более беспощадным: «Пятилетняя доходность биткойна отстала от S&P 500, Nasdaq 100 и золота».
У инвестиций есть срок годности
Начальная точка 5-летнего окна на графике выше — декабрь 2021 года.
В то время биткойн только что откатился с максимума цикла в 69 000 долларов до уровня около 48 000 долларов, а Nasdaq 100 находился на отметке около 16 300 пунктов, нарратив об ИИ еще не был запущен. Это означает, что стартовая позиция биткойна была установлена на высокой платформе на завершающей стадии бычьего рынка, а стартовая позиция Nasdaq — накануне супер-ралли, связанного с ИИ.
Эмоционально понять пропаганду того, что американские акции сильнее BTC, можно; но если немного продлить данные во времени, действительно ли это так? Если сместить начальную точку на несколько месяцев или лет вперед или назад, соотношение сил может резко измениться.
Мы провели небольшое простое статистическое исследование. Вот пять временных окон, конечная точка для всех — май 2026 года (BTC около 80 000 долларов, Nasdaq 100 около 29 000 пунктов), а начальные точки соответствуют пяти ключевым моментам на крипторынке и макроэкономическом рынке:
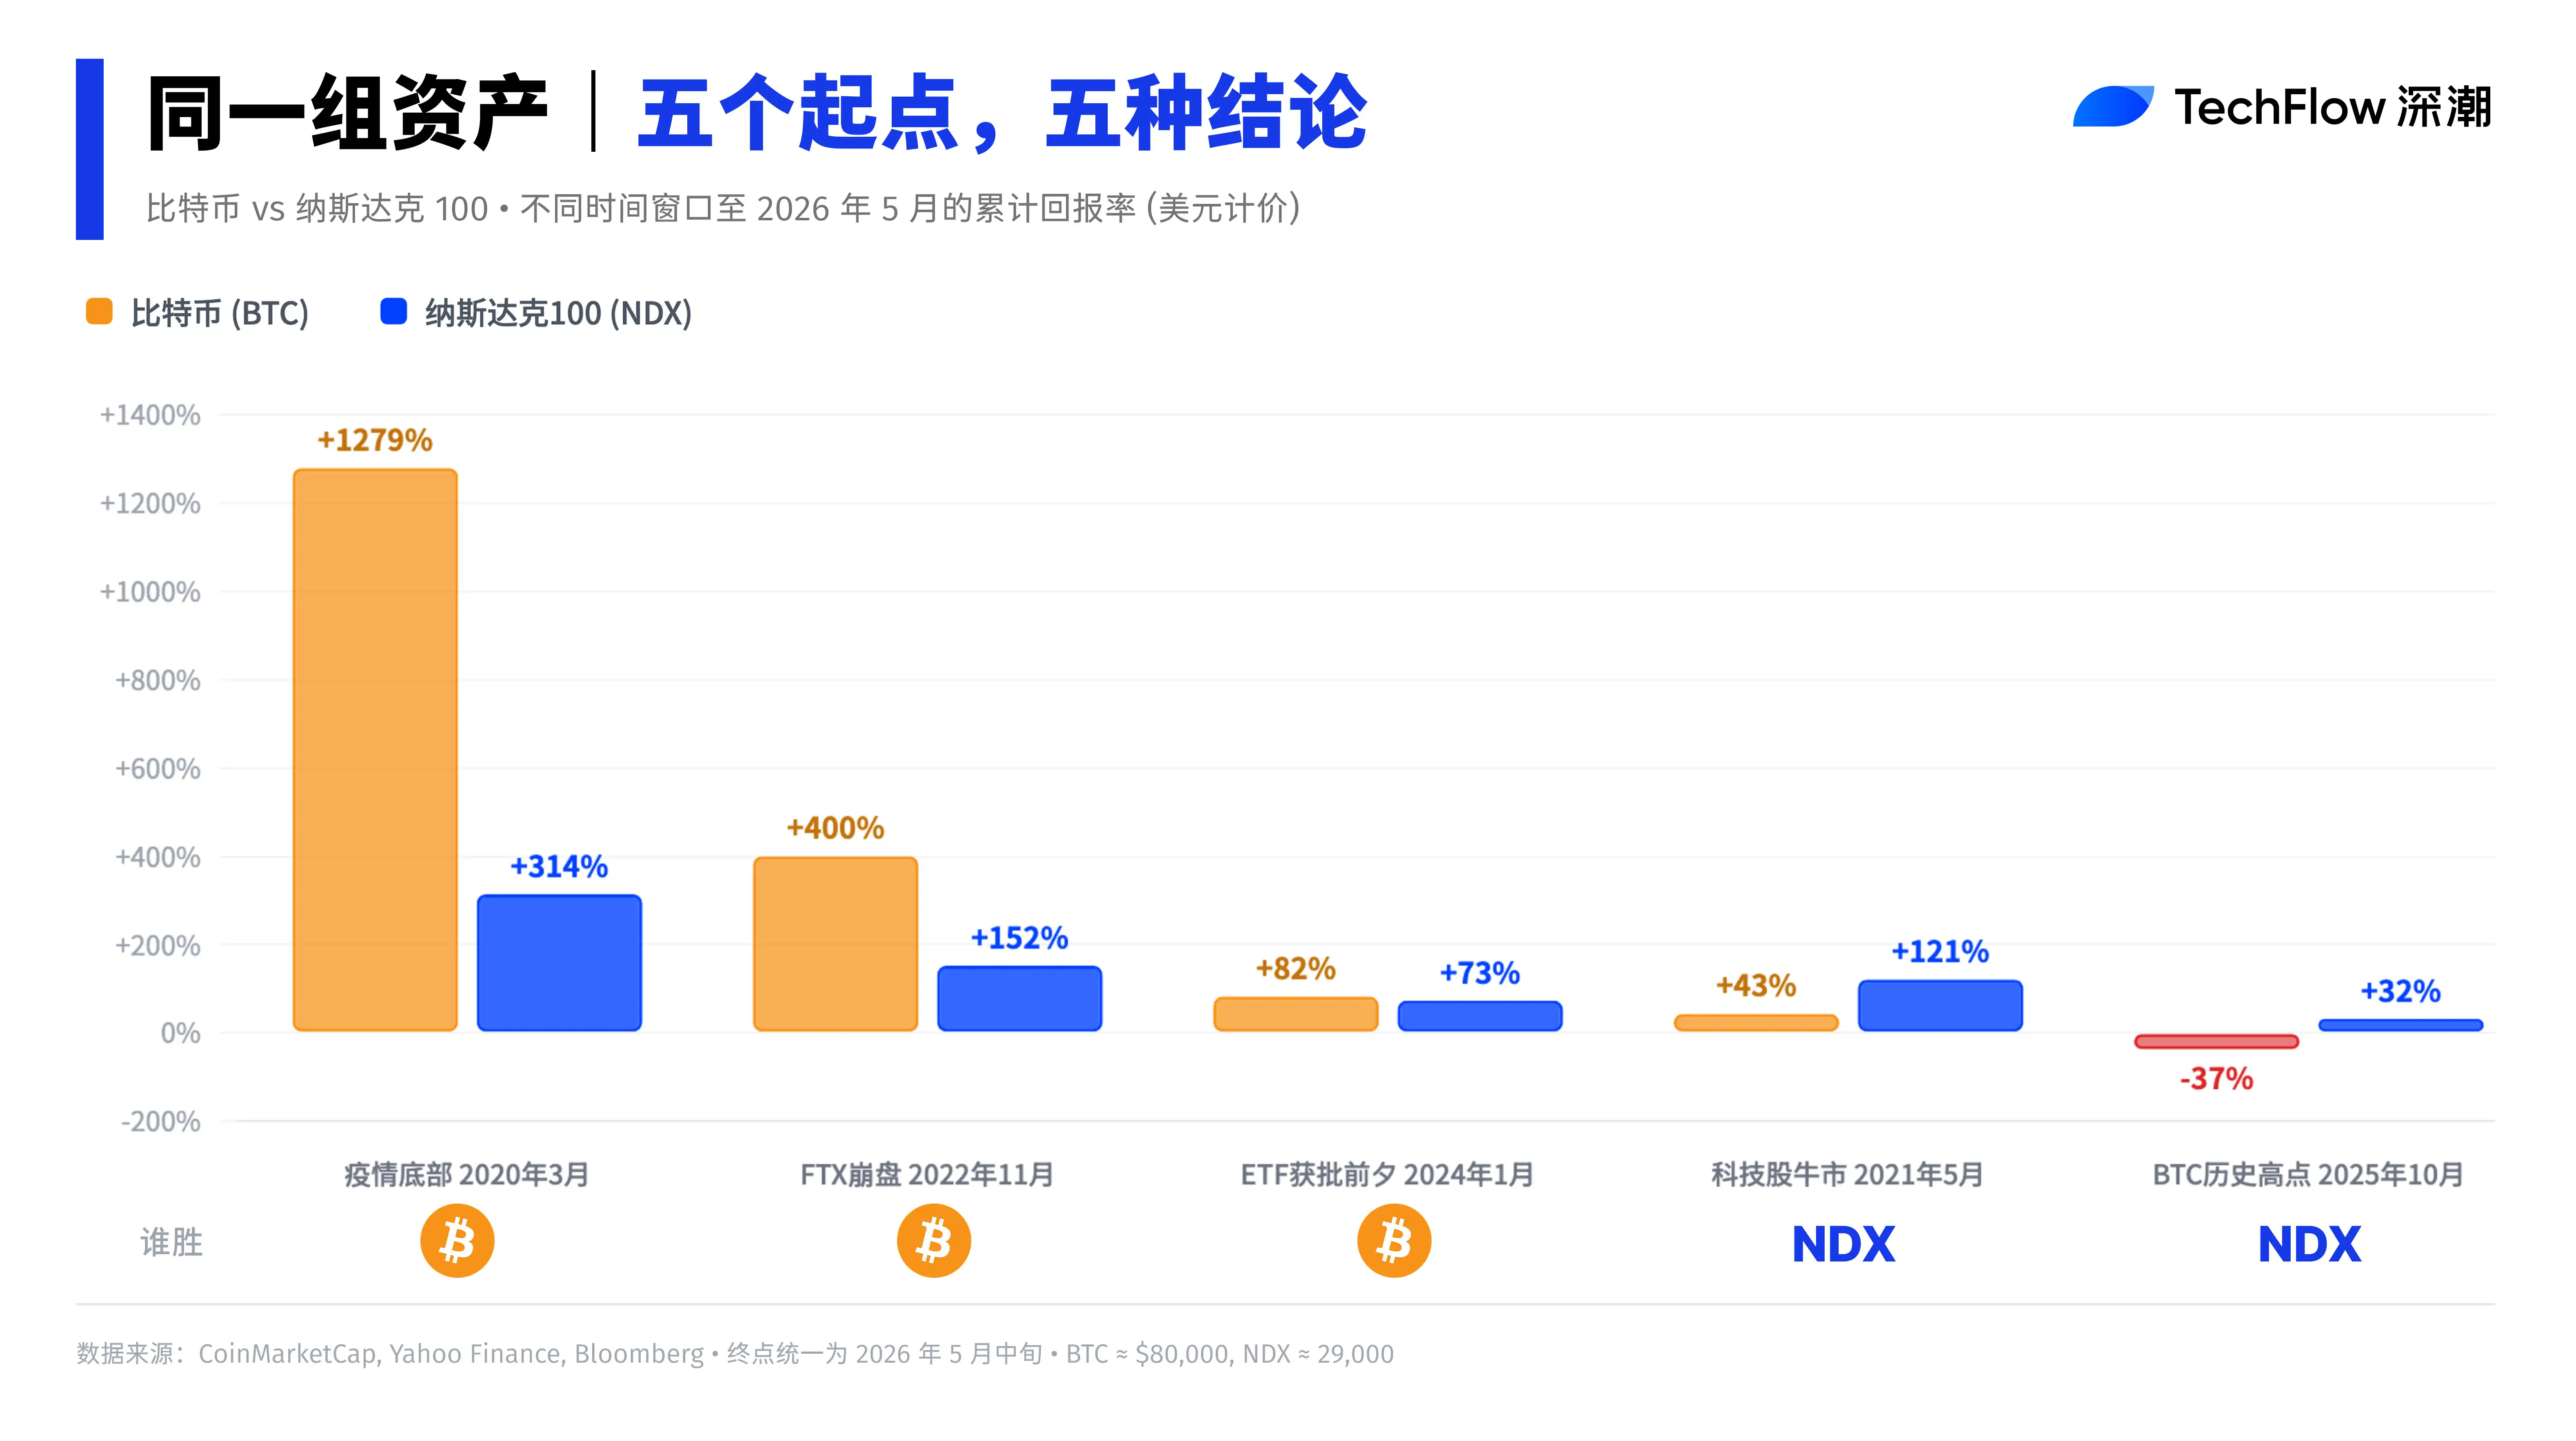
Дно пандемии (март 2020 г.) → настоящее время:
Биткойн вырос примерно с 5 800 долларов до 80 000 долларов, прирост около 1 279%. Nasdaq 100 вырос примерно с 7 000 пунктов до 29 000 пунктов, прирост около 314%. Доходность биткойна более чем в 4 раза выше, чем у Nasdaq.
Дно после краха FTX (ноябрь 2022 г.) → настоящее время:
Биткойн вырос примерно с 16 000 долларов до 80 000 долларов, прирост около 400%. Nasdaq 100 вырос примерно с 11 500 пунктов до 29 000 пунктов, прирост около 152%. Доходность биткойна все еще в 2,6 раза выше, чем у Nasdaq.
Накануне одобрения биткойн-ETF (январь 2024 г.) → настоящее время:
Биткойн вырос примерно с 44 000 долларов до 80 000 долларов, прирост около 82%. Nasdaq 100 вырос примерно с 16 800 пунктов до 29 000 пунктов, прирост около 73%. Результаты практически равны, биткойн с небольшим отрывом впереди.
Текущий цикл акций технологического сектора (май 2021 г.) → настоящее время:
Биткойн вырос примерно с 48 000 долларов до 80 000 долларов, прирост около 67%. Nasdaq 100 вырос примерно с 16 300 пунктов до 29 000 пунктов, прирост около 78%. Nasdaq лидирует.
Исторический максимум биткойна (октябрь 2025 г.) → настоящее время:
Биткойн упал примерно со 126 000 долларов до 80 000 долларов, снижение около 37%. Nasdaq 100 вырос примерно с 22 000 пунктов до 29 000 пунктов, прирост около 32%. Nasdaq значительно лидирует, и направления движения полностью противоположны.
Итак, вывод: из пяти окон в трех побеждает биткойн, в двух — Nasdaq. Пост на Reddit выбрал как раз одно из окон с наибольшими шансами на победу Nasdaq.
Циклический актив VS трендовый актив
Разница в чувствительности биткойна и Nasdaq 100 к выбору начальной точки коренится в совершенно различной структуре волатильности этих двух активов.
Nasdaq 100 состоит из 500 крупных нефинансовых компаний, за которыми стоят денежные потоки и прибыль, его динамика имеет долгосрочный восходящий трендовый характер. Даже после отката на 33% в 2022 году скорость восстановления была относительно плавной.
Если выбрать любую неэкстремальную начальную точку, долгосрочная доходность окажется в относительно стабильном диапазоне.
Биткойн — типичный циклический актив. В каждом бычье-медвежьем цикле в истории амплитуда отката от пика до дна составляла от 75% до 85% (так было в 2014, 2018 и 2022 годах), откат с октября 2025 года по начало 2026 года также достиг около 50%.
Такие резкие колебания означают, что позиция в цикле, в которую попадает начальная точка, почти определяет итоговую цифру доходности.
Анализ на Nasdaq.com подводит еще более прямолинейный итог: по своей сути биткойн — это левериджированная версия S&P 500.
В 2024 году S&P вырос на 24%, биткойн на 135%; в 2023 году S&P вырос на 26%, биткойн на 147%; в 2022 году S&P упал на 19%, биткойн на 65%. Направление то же, амплитуда увеличена в 3-5 раз.
Это означает, что вывод «акции полностью превосходят биткойн», сделанный на основе сравнения с начальной точкой, приходящейся как раз на пик цикла биткойна, статистически почти неизбежен. Верно и обратное.
Текущий BTC, возможно, находится в «зоне циклической недооценки»
Оставив в стороне игру с выбором начальной точки, сама текущая рыночная структура заслуживает внимания.
После достижения пика в октябре 2025 года биткойн пережил типичный циклический откат. В феврале 2026 года он временно упал примерно до 65 000 долларов, после чего отскочил до уровня около 80 000 долларов, что все еще примерно на 37% ниже пика. В то же время Nasdaq 100, подпитываемый продолжающимся расширением капитальных затрат на ИИ, неоднократно обновлял исторические максимумы.
Такая дивергенция в истории не редкость. В 2019 году, в процессе роста биткойна с 3 000 до 12 000 долларов, он практически отвязался от S&P 500. В 2022 году они синхронно рухнули, а корреляция временно взлетела до 0,92. Корреляция крипторынка с американским фондовым рынком динамична, циклична и не является фиксированной положительной.
В декабре 2025 года Алекс Торн, глава отдела исследований Galaxy Digital, предложил интересную перспективу:
Если измерять в покупательной способности доллара 2020 года, номинальный максимум биткойна в 126 000 долларов на самом деле так и не преодолел 100 000 долларов. Инфляция с 2020 по 2025 год составила около 24%, что создает систематическую погрешность при сравнении номинальных цен за разные годы.
В момент, когда биткойн откатился на 37% от исторического максимума, а индексы американского фондового рынка одновременно обновляют исторические максимумы, нарратив «акции превосходят биткойн» естественным образом захватывает социальные сети.
Но в прошлом каждый раз, когда этот нарратив звучал громче всего, обычно он совпадал с приближением к зоне дна цикла биткойна. В конце 2022 года, после краха FTX, аналогичные призывы «биткойн мертв» также были широко распространены, а затем за 18 месяцев биткойн вырос с 16 000 до 126 000 долларов.
Говорить задним числом легко, делать ставки заранее сложно, спорить о том, какой актив вырос больше, не имеет смысла на микроуровне. Любой вывод типа «A всегда лучше B», сделанный на основе единичного временного окна, не выдержит проверки смещением начальной точки.
Каждому времени — свои герои, а сложность каждого времени — в выборе момента для входа и выхода.