Odaily приглашенный аналитик рынка Conaldo, магистр финансовой статистики Колумбийского университета (США), со времен учебы в университете специализируется на количественной торговле акциями США и постепенно расширил свою деятельность до биткоина и других цифровых активов, разработав на практике систематическую модель количественной торговли и систему управления рисками; обладает острым аналитическим восприятием рыночной волатильности и стремится к постоянному углублению в профессиональную торговлю, добиваясь стабильной доходности; еженедельно будет глубоко анализировать изменения в технических, макроэкономических и денежных аспектах BTC, проводить разборы и демонстрировать практические стратегии, а также анонсировать важные события на ближайшее время для вашего сведения.

Ключевые выводы еженедельного торгового отчета:
- Проверка эффективности выполнения стратегии (краткосрочной): На прошлой неделе торговля строго следовала установленной стратегии, было успешно проведено две операции, совокупная доходность составила 3,62%.
- Подтверждение ключевой точки зрения (краткосрочной): Наша ключевая точка зрения, высказанная на прошлой неделе, о том, что «рынок будет демонстрировать широкий диапазонный флэт», полностью подтвердилась рыночной динамикой. Определенные ключевые уровни наблюдения 89 500~91 000 долларов и зона поддержки ниже 86 500~87 500 долларов неоднократно тестировались рынком. Особенно важно, что достигнутый на прошлой неделе максимум цены в 90 598 долларов отличался от верхней границы нашей ключевой зоны (91 000 долларов) всего на 402 доллара; минимум в середине недели (86 400 долларов) отличался от нижней границы зоны поддержки (86 500 долларов) всего на 100 долларов, что в полной мере подтвердило точность наших прогнозов по уровням.
- С макротехнической точки зрения, с момента достижения исторического максимума в 126 200 долларов 6 октября биткоин корректируется уже 82 дня, с максимальным падением примерно на 36%, подтвердив среднесрочный медвежий тренд. Однако, согласно наблюдениям за множеством технических индикаторов, сейчас рынок вошел в зону низких значений, и время, и пространство коррекции постепенно приближаются к историческим условиям перепроданности. С 22 ноября цена продолжает консолидироваться в диапазоне на низких уровнях, что свидетельствует об относительном балансе сил быков и медведей и накоплении импульса для направленного пробоя. Несмотря на то, что в настоящее время на рынке все чаще звучат призывы к росту, мы считаем, что при исключении вмешательства внезапных новостей последующее движение все же имеет одну ключевую возможность: если рынком управляют основные средства, то для медведей более оптимальной стратегией может быть сначала пробить вниз ключевой психологический уровень в 80 000 долларов, используя панические настроения для вымывания оставшихся длинных позиций, завершив таким образом последнее формирование дна. После этого средства могут顺势 осуществить «разворот из медвежьего в бычий», быстро подняв цену из зоны своих затрат, и затем запустить технический восстановительный ралли с достаточно сильным импульсом. Важно подчеркнуть, что上述走势仅为基于市场行为逻辑的一种推演,并非必然路径。Независимо от того, как будет развиваться ситуация, следует всегда помнить: «Рынок всегда прав». До выбора направления сохранение наблюдательности и гибкости реагирования остается ключевым на текущем этапе.
一、回顾 торговых результатов за прошлую неделю:(12.22~12.28)
1、Разбор краткосрочных сделок (без плеча):
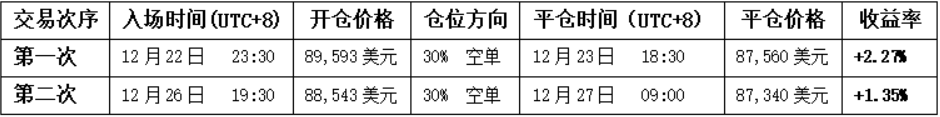
• Первая сделка (прибыль 2,27%): Следование модели «короткая продажа при отскоке к ключевой зоне сопротивления». Когда цена достигла зоны 89 500~91 000 долларов и встретила сопротивление, одновременно модель торговли по спреду также выдала сигнал вершин, была открыта короткая позиция объемом 30%, которая в конечном итоге была закрыта с прибылью при приближении цены к зоне поддержки.
• Вторая сделка (прибыль 1,35%): Логика сделки аналогична предыдущей. Когда цена снова достигла зоны 89 500~91 000 долларов и встретила сопротивление, добавились два резонирующих сигнала от моделей, что позволило успешно завершить сделку.
2、Обзор прогноза движения и торговой стратегии на прошлой неделе:
В предварительном анализе на прошлой неделе четко указано: ожидалось, что рынок в основном будет демонстрировать широкий диапазонный флэт. Ключевой зоной наблюдения был диапазон 89 500~91 000 долларов, результат борьбы в этой зоне должен был определить краткосрочное направление. Ниже приведен разбор и анализ стратегии.
1、Обзор прогноза движения:
• Ключевые уровни сопротивления: Первое сопротивление – зона 89 500~91 000 долларов; второе сопротивление – зона 93 000~94 500 долларов.
• Ключевые уровни поддержки: Первая поддержка – зона 86 500~87 500 долларов; вторая поддержка – зона 83 500~84 500 долларов.
2、Обзор торговой стратегии:
• Среднесрочная стратегия: Сохранение среднесрочной позиции (шорт) объемом около 65%.
• Краткосрочная стратегия: На прошлой неделе мы предварительно разработали два варианта краткосрочных операций A/B. Учитывая фактическое движение рынка, мы в конечном итоге выполнили стратегию на основе варианта B.
(Вариант B: Проверка отскоком, ключевая зона 89 500~91 000 долларов была эффективно пробита вниз)
• Открытие позиции: При появлении сигналов сопротивления в процессе проверки отскоком можно открыть короткую позицию объемом 30%.
• Управление рисками: Стоп-лосс установлен выше 92 000 долларов.
• Закрытие позиции: При снижении цены до зоны 83 500~84 500 долларов и появлении признаков сопротивления考虑部分或全部清仓,获利了结.(可以考虑部分或全部 закрыть позицию с прибылью).
二、Технический анализ: оценка среднесрочного тренда Биткоина
Объединяя рыночные движения прошлой недели, автор проведет углубленный анализ эволюции внутренней структуры и тренда Биткоина с использованием многомерных аналитических моделей.
Недельный график Биткоина: (Модель количественной оценки импульса + Модель количественной оценки настроений)
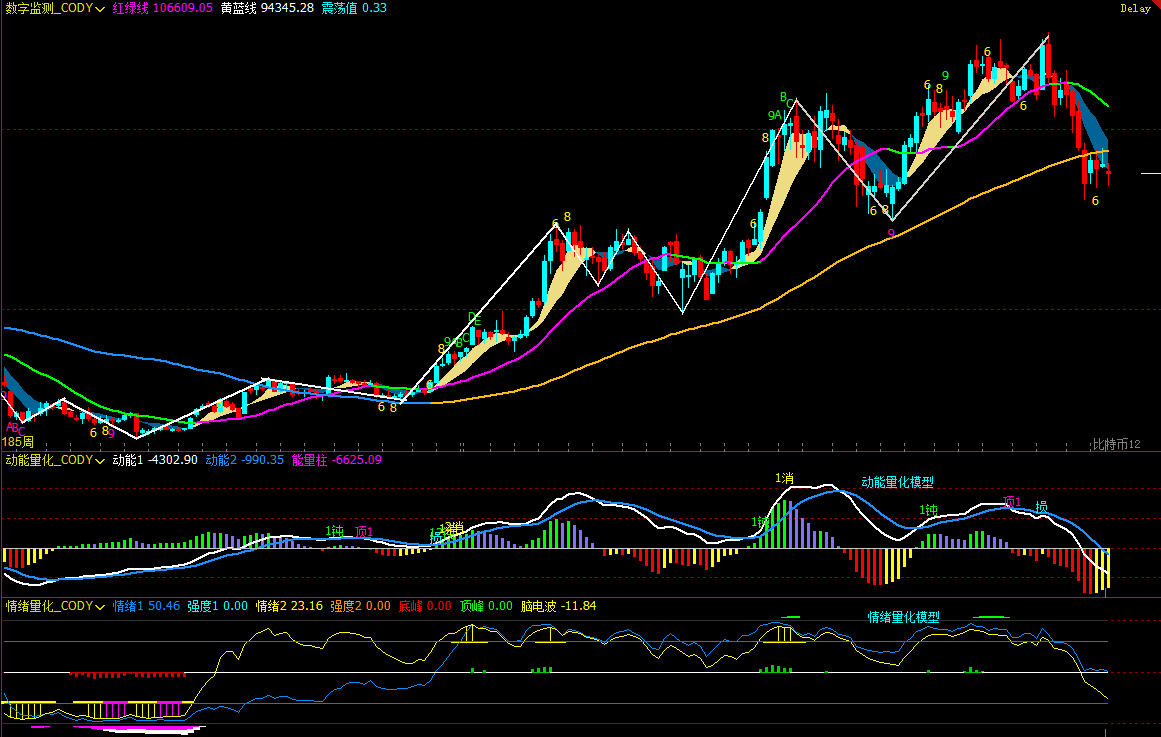
Рисунок 2
1、Как показано на (Рисунке 2), анализ недельного графика:
• Модель количественной оценки импульса: После коррекции на прошлой неделе две линии индикатора импульса все еще работают ниже нулевой оси, отрицательные столбцы импульса постепенно сокращаются, что указывает на то, что, хотя недельный график уже вошел в медвежий рынок, медвежий импульс еще не fully высвобожден.
Модель количественной оценки импульса предвещает: Индекс падения цены: Высокий
• Модель количественной оценки настроений: Значение синей линии настроений 49.74, интенсивность ноль; значение желтой линии настроений 19.99 (близко к нижнему порогу), интенсивность ноль, пиковое значение 0.
Модель количественной оценки настроений предвещает: Индекс давления и поддержки цены: Нейтральный
• Модель цифрового мониторинга: Цена跌破 линию раздела быков и медведей (желто-синяя линия) уже 6 недель; краткосрочный сигнал достижения дна (выше 9) еще не появился.
Вышеуказанные данные预示:На недельном графике Биткоина установился медвежий тренд,需警惕后续释放 медвежьей силы.
Дневной график Биткоина:
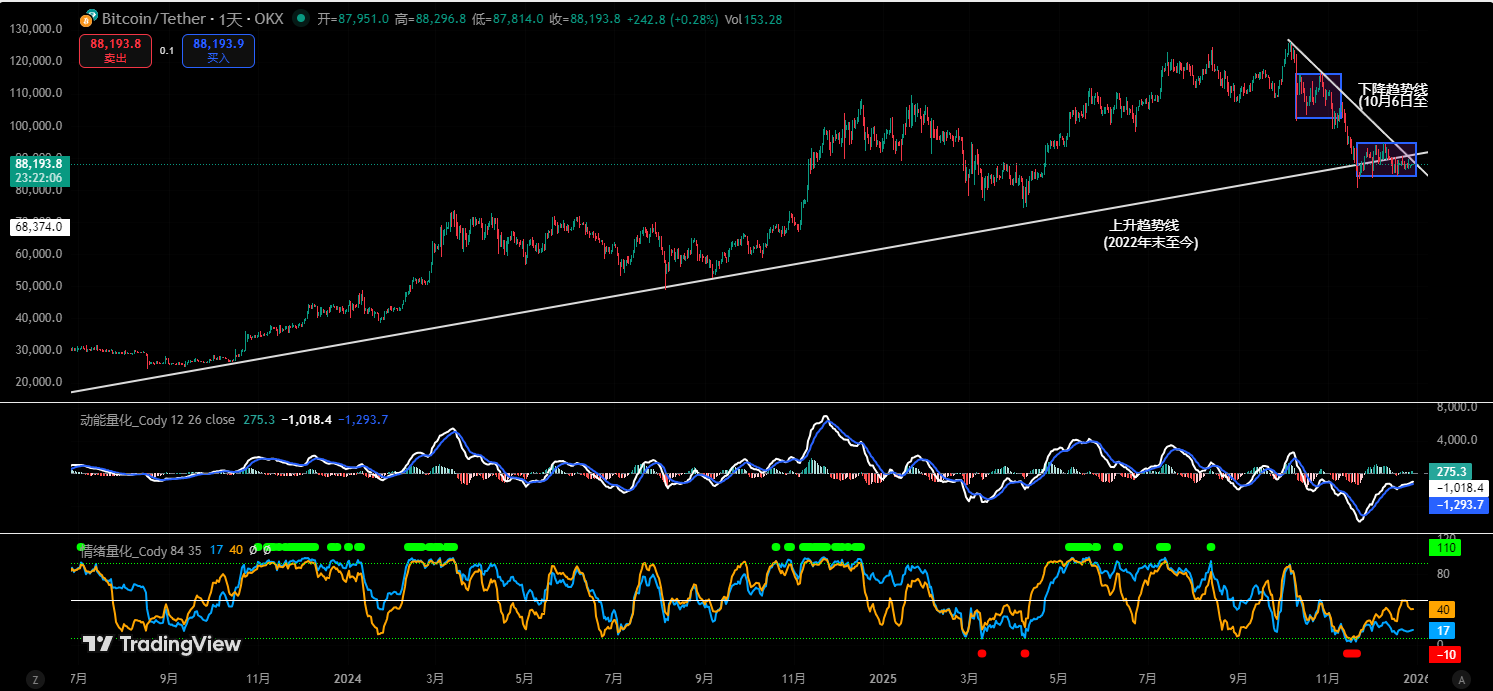
Рисунок 3
2、Как показано на (Рисунке 3), анализ дневного графика:
• Модель количественной оценки импульса: На прошлой неделе две линии импульса почти слились, медленно поднимаясь ниже нулевой оси и постепенно приближаясь к ней. Из-за праздников每日 объем торгов持续萎缩, положительные столбцы импульса变化不明显.
Модель количественной оценки импульса предвещает: Импульс покупок слабый, столбцы объема сократились до «точечного» состояния, что указывает на временное равновесие сил быков и медведей.
• Модель количественной оценки настроений: После закрытия прошлой недели значение синей линии настроений 16 (близко к нижнему порогу), интенсивность ноль; значение желтой линии настроений 40, интенсивность ноль.
Модель количественной оценки настроений предвещает: Индекс давления и поддержки: Нейтральный
以上数据提示:Дневной таймфрейм находится в медвежьем рынке, краткосрочный рынок готовится к выбору направления.
三、Прогноз движения Биткоина на текущей неделе:(12.29~01.04)
1、Ожидается, что на этой неделе рынок, скорее всего, будет в основном колебаться с探底, ключевая зона наблюдения – 86 000~86 500 долларов.
• При эффективном пробитии вниз: Цена может продолжить снижение, testing зону поддержки ниже 83 500~84 500 долларов.
• При эффективном закреплении выше: Рынок может продолжить текущий диапазонный флэт 86 500~91 000 долларов.
2、Ключевые уровни сопротивления:
• Первая зона сопротивления: 89 500~91 000 долларов
• Вторая зона сопротивления: 93 000~94 500 долларов
• Важная зона сопротивления: около 97 000 долларов
3、Ключевые уровни поддержки:
• Первый уровень поддержки: зона 86 000~86 500 долларов
• Второй уровень поддержки: зона 83 500~84 500 долларов
• Важный уровень поддержки: около 80 000 долларов.
四、Торговая стратегия по Биткоину на текущей неделе (исключая влияние внезапных новостей):(12.29~01.04)
1、 Среднесрочная стратегия: Сохранять среднесрочную позицию (шорт) объемом около 65%.
2、 Краткосрочная стратегия: Использовать 30% объема, устанавливать стоп-лосс, искать возможности для «спреда» на основе уровней поддержки и сопротивления. (используя 30-минутный таймфрейм для операций).
3、 Внимательно наблюдать за борьбой быков и медведей в зоне 86 000~86 500 долларов. Для应对 рыночных изменений мы拟定A/B两套短线操作预案:
• Вариант A: Если эффективно закрепится above зоны 86 000~86 500 долларов:
• Открытие позиции: Когда цена отскочит к зоне 89 500~91 000 долларов и появятся сигналы сопротивления, можно открыть короткую позицию объемом 30%.
• Управление рисками: Стоп-лосс для шорта установить выше 92 500 долларов.
• Закрытие позиции: Когда цена упадет до зоны 86 000~86 500 долларов и появятся сигналы стабилизации, закрыть все шорты с прибылью.
• Вариант B: Если эффективно пробьет вниз зону 86 000~86 500 долларов:
• Открытие позиции: Если цена эффективно пробьет вниз, можно открыть короткую позицию объемом 30%.
• Управление рисками: Стоп-лосс установить выше 88 000 долларов.
• Закрытие позиции: Когда цена снизится до зоны 83 500~84 500 долларов и появятся сигналы стабилизации, можно постепенно закрывать позицию с прибылью.
五、Особые указания:
1. При открытии позиции: Немедленно установить начальный уровень стоп-лосса.
2. При достижении прибыли в 1%: Переместить стоп-лосс на цену открытия (точку безубыточности), обеспечивая безопасность本金.
3. При достижении прибыли в 2%: Переместить стоп-лосс на уровень прибыли в 1%.
4. Постоянное отслеживание: Впоследствии с каждым дополнительным 1% прибыли уровень стоп-лосса同步移动 1%, динамически защищая и фиксируя已有щую прибыль.
(Примечание:上述 1%的盈利触发阈值, инвесторы могут гибко调整 в зависимости от собственных предпочтений по риску и волатильности актива.)
六、Важные события на предстоящей неделе:(12.29~01.04)
1、Протоколы заседания ФРС сигнализируют о «реальных разногласиях»
В среду в 03:00 ФРС опубликует протоколы последнего заседания по денежно-кредитной политике. По сравнению с самим решением по ставкам, протоколы更关键的是内部成员在「сроках, размерах и устойчивости снижения ставок」上的分歧程度.
Если протоколы покажут, что уверенность чиновников в снижении инфляции усилилась, и обсуждались более ранние или быстрые пути смягчения, это укрепит рыночные ожидания «снижения реальных ставок», что станет среднесрочным позитивом для биткоина;反之, если протоколы подчеркнут опасения по поводу повторного роста инфляции или слишком быстрого ослабления финансовых условий, это может временно повысить美元 и доходность казначейских облигаций, оказывая эмоциональное давление на BTC.
Для биткоина это не сигнал краткосрочного направления, а важный节点, влияющий на среднесрочный якорь定价 средств.
2、Количество первичных заявок на пособие по безработице: барометр ожиданий ликвидности
В среду в 21:30 США опубликуют количество первичных заявок на пособие по безработице за неделю по 27 декабря.
Сейчас рынок更关注「наблюдается ли структурное охлаждение рынка труда», а не колебания отдельных данных.
Если количество заявок持续高于 трендового уровня, это further подтвердит логику охлаждения экономики, укрепит ожидания延续宽松政策, что благоприятно для восстановления оценки активов, не приносящих доход, таких как биткоин; если данные снова снизятся, это может укрепить判断「экономика все еще устойчива», что в краткосрочной перспективе неблагоприятно для расширения аппетита к риску BTC.
Влияние этого показателя на биткоин主要体现在 ожиданиях по ставкам, а не на fundamentals本身.
3、Окончательное значение PMI обрабатывающей промышленности подтверждает направление реальной экономики
В пятницу в 22:45 будет опубликовано окончательное значение индекса менеджеров по закупкам (PMI) обрабатывающей промышленности от S&P Global за декабрь.
PMI作为领先指标, поможет рынку判断是否「мягкая посадка」все еще на track.
Если окончательное значение подтвердит стабилизацию или даже улучшение в manufacturing, общие настроения на рынке рисковых активов有望 сохраниться, что ограничит системное давление на BTC; если PMI снова будет пересмотрен в сторону понижения, это может спровоцировать переоценку экономического спада, краткосрочно негативно для рисковых активов, но в среднесрочной перспективе反而 может укрепить ожидания monetary easing.
Финансовые рынки瞬息万变, все анализ рынка и торговые стратегии требуют динамической调整. Все观点, аналитические модели и операционные стратегии, изложенные в данной статье, основаны на личном техническом анализе и предназначены исключительно для личного торгового журнала, не являются инвестиционной рекомендацией или основанием для действий. Рынок有风险, инвестиции需谨慎, DYOR (проводите собственное исследование).