В еженедельном отчете на прошлой неделе мы четко указали, что рынок находится в зоне ловушки быков, и рекомендовали инвесторам не спешить с покупками на росте, сохраняя медвежий тренд. На этой неделе движение рынка подтвердило это — Bitcoin не смог преодолеть зону сопротивления и затем明显 снизился, подтверждая логику медведей.
Ниже представлены прогнозы на неделю, рекомендации по стратегии и разбор прошлых сделок, чтобы помочь читателям ориентироваться на сложном рынке и принимать точные решения.
Краткое содержание отчета:
• Результаты краткосрочных сделок с HYPE: завершена одна сделка на покупку (леверидж 1x) с прибылью около 4.41% (подробности в части 2).
• Результаты краткосрочных сделок с BTC: завершена одна сделка на продажу (леверидж 1x) с прибылью около 5.37% (подробности в части 4).
• Прогноз и стратегия для HYPE на неделю: см. части 1 и 2.
• Прогноз и стратегия для BTC на средний и короткий срок: см. части 3 и 4.
• Подтверждение основной идеи: Bitcoin сохранил медвежий тренд, полностью соответствуя прогнозу; предупреждение о ловушке быков сработало.
1. Прогноз и стратегия для HYPE
1. Основная идея недели:
На основе текущей структуры мы считаем, что текущая коррекция на часовом таймфрейме, начавшаяся с максимума 19 марта (около точки 27), вероятно, завершится в ближайшее время. Дальнейшее движение зависит от того, сможет ли цена выйти из диапазона центра C, чтобы подтвердить окончание коррекции. Если пробой состоится, сигнал продолжения тренда усилится. Ожидается широкий диапазон колебаний на неделе, в операциях следует сохранять гибкость.
2. Предупреждение о рисках роста HYPE:
Стоит отметить, что хотя движение HYPE независимо, оно все же зависит от общего фона Bitcoin. Если Bitcoin скорректируется, это может замедлить восстановление HYPE. Инвесторы должны сохранять бдительность и иметь план управления рисками.
3. Стратегия на неделю:
Используйте 30% капитала, установите стоп-лосс, ищите возможности для сделок по уровням поддержки и сопротивления (таймфрейм 30/60 минут). Действуйте с малыми объемами и соблюдайте дисциплину стоп-лосса.
2. Анализ структуры HYPE и разбор сделок
1. Отслеживание динамики и возможностей HYPE
С конца февраля мы持续 отслеживаем HYPE, и все предыдущие оценки подтверждались движением рынка:
• Обзор от 23 февраля: впервые указано, что HYPE может войти в инвестиционное окно, находясь в коррекции волны II, с прогнозом запуска основной волны роста III.
• Обзор от 3 марта: определено, что минимум 24 февраля ($25.60) может быть точкой старта волны III, подтверждая потенциальный разворот тренда.
• Обзор от 9 марта: отмечено, что цена пробила несколько скользящих средних на дневном графике, после чего вошла в фазу консолидации, ожидается быстрый рост после завершения.
• Обзор от 16 марта: указано, что рынок находится в тренде волны III, формируя восходящий центр (центр B). Ожидается широкий диапазон колебаний после завершения.
2. Обзор дневной структуры HYPE (с 21 января):
Текущее движение четко показывает три волны:
• Волна I (движущая): с минимума 21 января ($20.46) до максимума 3 февраля ($38.41), за 14 дней, рост на 87.73%, сильный импульс.
• Волна II (корректирующая): с максимума 3 февраля ($38.41) до минимума 24 февраля ($25.60), за 20 дней, падение на 33.35%, нормальная коррекция.
• Волна III (основная): с минимума 24 февраля ($25.60) по настоящее время, прошло 27 дней, рост на 71.02%, основной тренд продолжается, структура целостна.
3. Детальная структура на часовом таймфрейме (с 16 марта):
График HYPE_60 минут
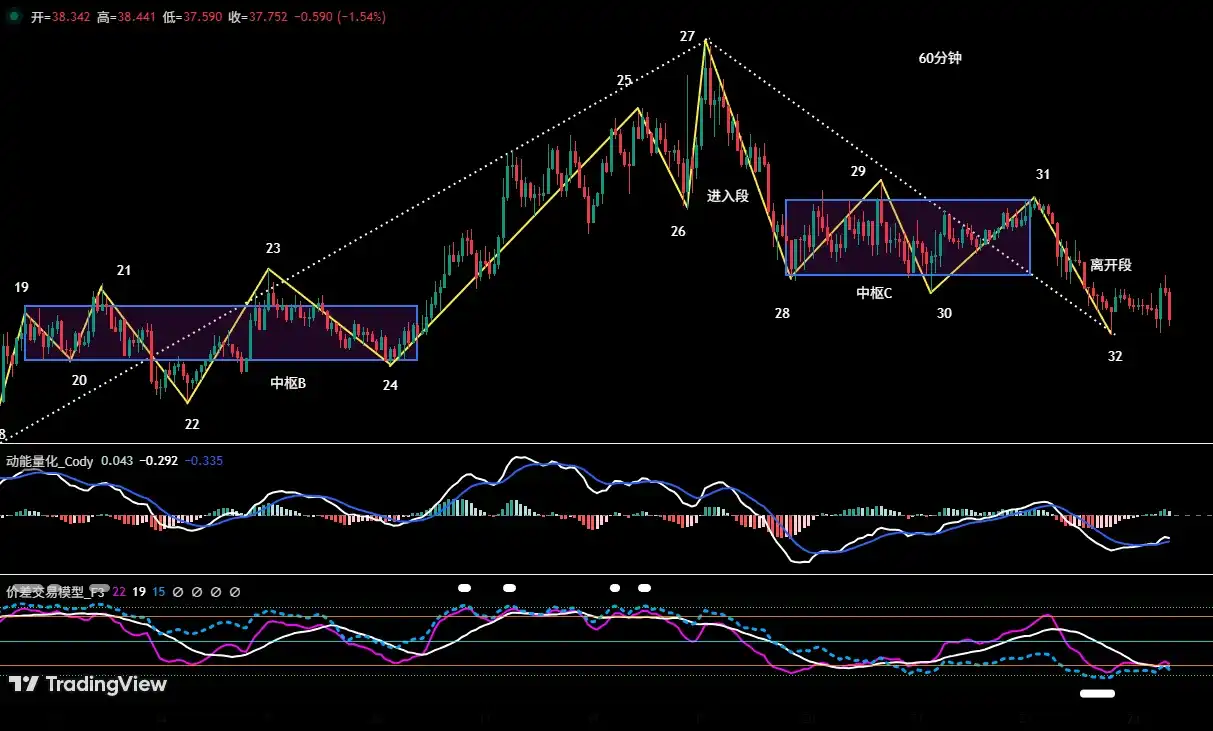
Рис. 1
• Обзор: как показано, цена с 9 по 15 марта формировала восходящий центр (центр B),接近 завершения, соответствуя нашему прогнозу.
• Детали структуры (16.03~22.03):
a、Как на (Рис. 1), с точки 24, восходящий центр (центр B) завершен. Затем движение развилось в сложную структуру из 8 сегментов: 24-25, 25-26, 26-27, 27-28, 28-29, 29-30, 30-31, 31-32. На момент анализа сегмент 31-32还在运行, структура清晰.
b、Сегменты 24-25, 25-26, 26-27 формируют восходящую структуру.
c、Сегменты 27-28, 28-29, 29-30, 30-31, 31-32 формируют корректирующую структуру с консолидацией.
d、Сегменты 28-29, 29-30, 30-31 перекрываются, формируя нисходящий центр (центр C), ядро коррекции.
4. Разбор краткосрочных сделок HYPE (леверидж 1x) (16.03~22.03):
На прошлой неделе мы выполнили одну сделку на покупку на основе сигналов нашей модели торговли разницей цен и модели量化 импульса, с прибылью 4.41%, строго по плану.
• Детали сделки HYPE (леверидж×1):
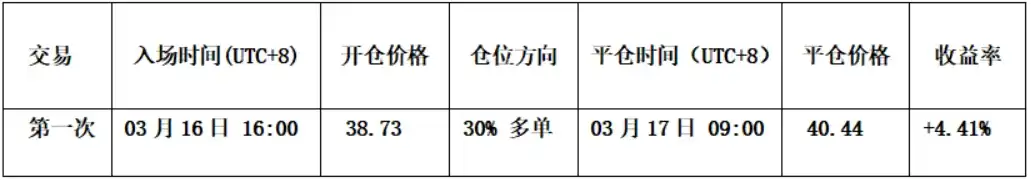
• Решение на вход: основано на прогнозе продолжения тренда после завершения центра B. Сигналом было пробой сопротивления верхней границы центра (~$38.54), и модели разницы цен и импульса показали сигнал на покупку.多重依据 повысили надежность. Мы открыли лонг с 30% капитала по $38.73.
• Решение на выход: модель разницы цен показала сигнал верха, в сочетании с комбинацией «сильный медвежий паттерн» на свечах, признаки верха четкие, поэтому мы закрыли позицию около $40.44, фиксируя прибыль.
• Итог: прибыль ~4.41%, вход и выход поддержаны сигналами моделей, качество исполнения высокое.
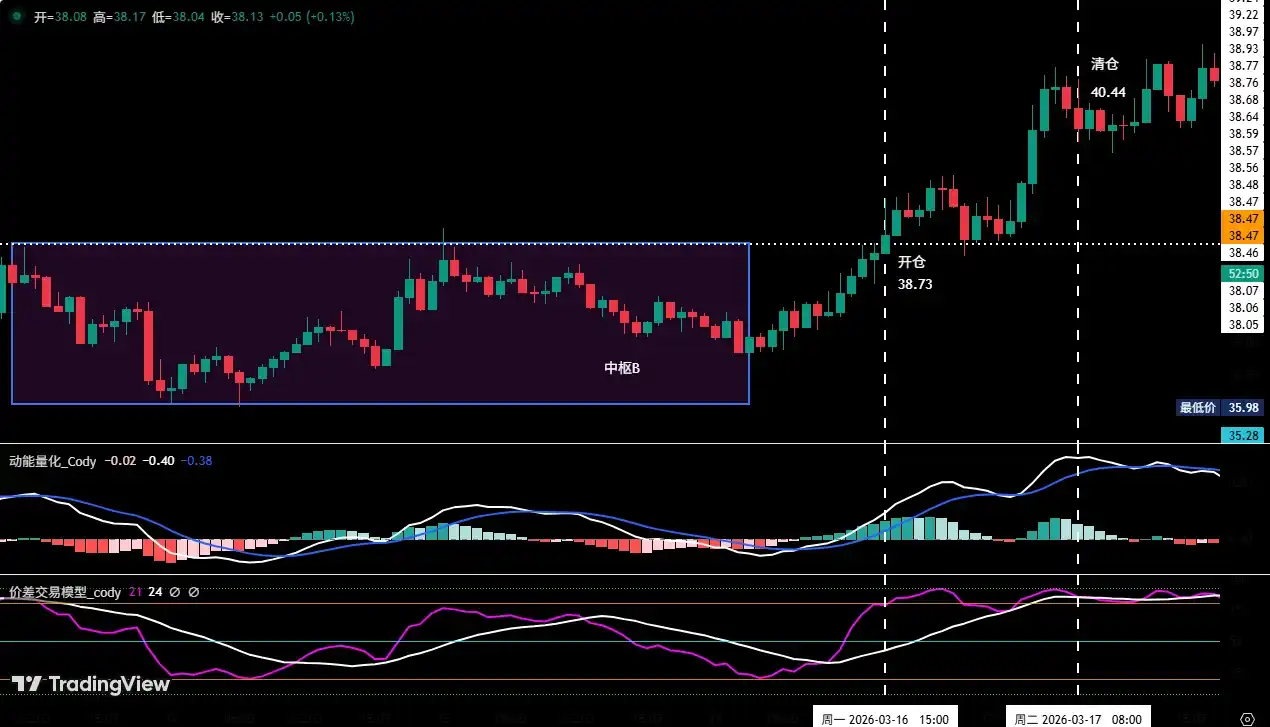
Рис. 2
3. Прогноз и стратегия для BTC на неделю (23.03~29.03)
1. Анализ структуры Bitcoin (с минимума 6 февраля):
На 4-часовом таймфрейме:
• Сохраняем основную框架: рост Bitcoin с минимума 6 февраля (~$60,000) является коррекцией волны C-2 внутри большой коррекционной волны C, отскок имеет ограниченный потенциал, после последует коррекция волны C-3.
• Интерпретация текущей структуры: на 4-часовом таймфрейме краткосрочная восходящая структура с минимума 24 февраля разрушена, защита быков ослабла. Если не удастся удержать текущую поддержку,可能测试 нижнюю линию восходящего канала с минимума 6 февраля. Если этот уровень будет пробит, вероятность завершения отскока C-2 около максимума $76,000 significantly возрастет, и рынок может снова测试 уровень $60,000, давление усилится. В целом, рынок остается в медвежьем тренде.
• Условие для волны C-3: если цена Bitcoin пробивает минимум 6 февраля (~$60,000), волна C-3 активируется, открывая цели вниз, необходимо иметь план.
Рис. 3
2. Прогноз на неделю:
Ожидается консолидация, ключевое наблюдение за борьбой у нижней линии канала (с минимума 6 февраля), объемы и реакция цены будут важны для определения направления.
3. Ключевые уровни сопротивления:
• Первая зона: $69,500~$71,500 (предыдущий диапазон, основное сопротивление для отскока)
• Вторая зона: $74,500~$76,000 (около минимума ноября 2025, важный уровень для среднесрочной медвежьей стратегии)
4. Ключевые уровни поддержки:
• Первая поддержка: $65,000~$66,000 (важная предыдущая зона)
• Вторая поддержка: $60,000~$62,500 (около минимума 6 февраля, пробой усилит медвежью структуру)
• Третья поддержка: около $57,400 (важный технический уровень ниже)
5. Стратегия на неделю (исключая внезапные новости):
1 Среднесрочная стратегия:
Дневной график Bitcoin (модель мониторинга позиций):
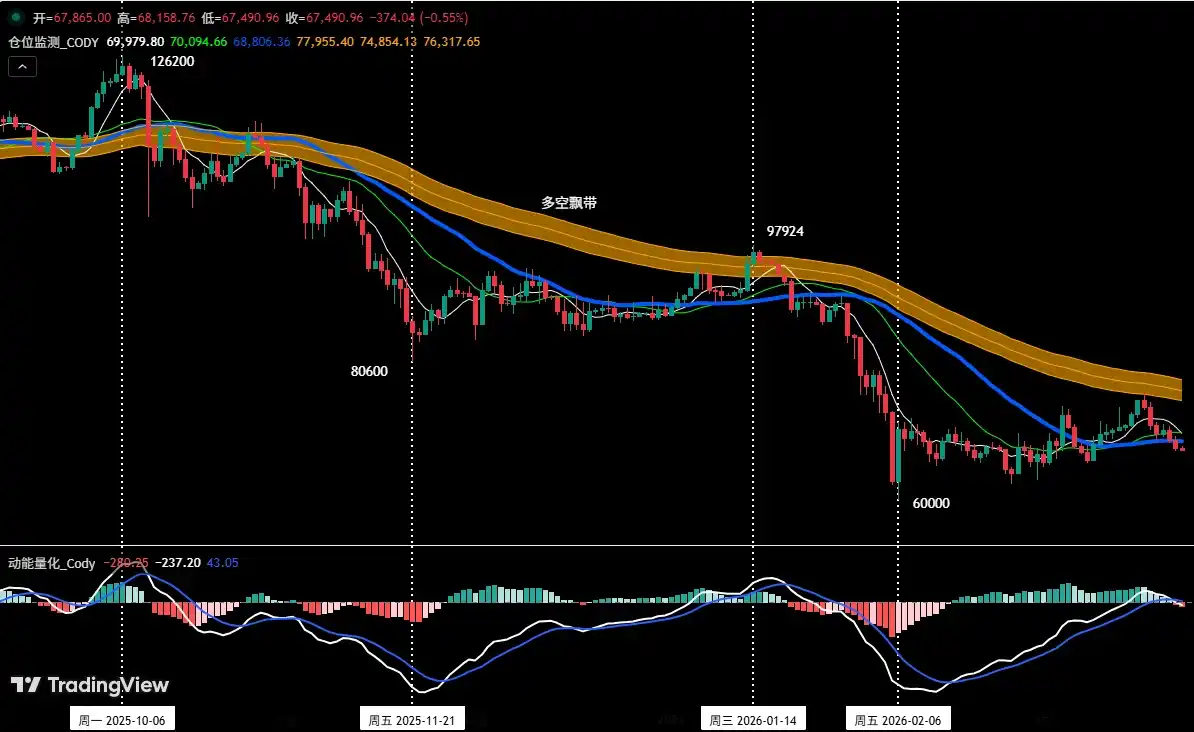
Рис. 4
Модель показывает: цена ниже ленты быков/медведей (желтая), медвежья структура действует. Согласно правилам, мы сохраняем 60% короткую позицию, открытую по ~$89,000 (28 января), среднесрочный方向不变.
• Если цена отскочит и пробьет $74,500, уменьшим среднесрочную позицию до 40%, снижая риск.
• Если цена пробьет и закрепится выше ленты, закроем среднесрочную позицию полностью, adjusting стратегию.
2 Краткосрочная стратегия:
Используйте 30% капитала, установите стоп-лосс, ищите возможности по уровням поддержки/сопротивления (таймфрейм 30/60 минут). Строго соблюдайте дисциплину стоп-лосса.
3 Краткосрочные планы A/B:
Поскольку среднесрочный тренд медвежий, следует придерживаться принципа «продавать на росте». Для динамичного response и based on сигналов нашей модели, мы подготовили два плана:
• План A: отскок встречает сопротивление, продавать на пиках.
Для сценария с limited отскоком и четким сопротивлением:
• Вход: когда цена отскакивает к зоне $69,500~$71,500 и встречает сопротивление + сигнал верха от модели, открываем 15% шорт.
• Добавление: если цена продолжает рост к $74,500~$76,000 и встречает сопротивление, добавляем еще 15% шорт, контролируя среднюю цену.
• Управление риском: стоп-лосс для обоих шортов установлен выше $77,000,严格执行.
• Выход: когда цена падает к важной поддержке + сигнал модели, постепенно закрываем позицию, фиксируя прибыль.
• План B: продажа по пробою.
Для сценария с continued падением и структурным пробоем:
• Вход: когда цена пробивает нижнюю линию канала и не может закрепиться выше при откате + сигнал верха от модели, открываем 30% шорт, используя инерцию.
• Управление риском: стоп-лосс установлен на ~2% выше цены входа, строго контролируя убытки.
• Выход: когда цена падает к поддержке + сигнал модели, постепенно закрываем позицию.
4. Разбор краткосрочных сделок Bitcoin (16.03~23.03)
1. Разбор краткосрочных сделок:
Мы строго следовали сигналам наших моделей разницы цен и量化 импульса, выполни одну краткосрочную сделку на продажу на прошлой неделе, с прибылью 5.37%, с соблюдением дисциплины.
1 Детали сделки Bitcoin (леверидж×1):
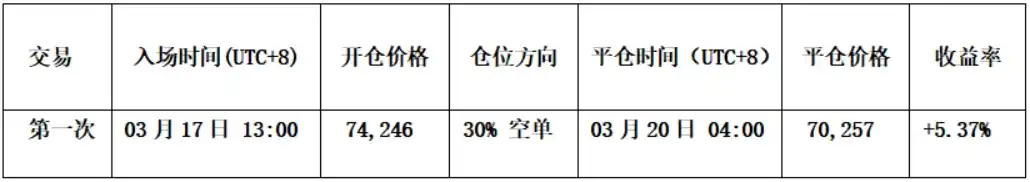
• Вход: когда цена отскочила к ~$76,000 и встретила сопротивление, модель разницы цен triggered сильный сигнал верха (зеленая точка на графике), совпав с моделью импульса. Сигналы двух моделей一致, признаки давления на вершине четкие. Based on это, мы открыли 30% шорт по $74,246, основание для входа достаточное.
• Выход: когда цена упала до ~$69,000 и стабилизировалась, модель разницы цен triggered сигнал низа, признаки поддержки появились, поэтому мы закрыли всю позицию по ~$70,257, своевременно фиксируя прибыль.
• Итог: прибыль ~5.37%, направление шорта точное, вход и выход поддержаны сигналами моделей, качество исполнения хорошее.
2. Разбор среднесрочной сделки:
Среднесрочная стратегия稳步推进. Сохраняем 60% шорт, открытый около $89,000 (28 января). На конец прошлой недели (цена закрытия ~$67,865) прибыль ~23.75%, максимальная прибыль достигала 32.58%, позиция в целом работает хорошо.
5. Особое примечание
Управление рисками — основа стабильной прибыли, строго соблюдайте дисциплины:
1. При открытии: немедленно установите начальный стоп-лосс.
2. При прибыли 1%: переместите стоп-лосс в цену входа (безубыток), защищая本金.
3. При прибыли 2%: переместите стоп-лосс на уровень прибыли 1%.
4. Постоянное отслеживание: при каждой последующей прибыли 1% перемещайте стоп-лосс на 1%, динамично защищая и фиксируя прибыль.
Финансовые рынки изменчивы, весь анализ и стратегии требуют динамичной корректировки. Все мнения, модели и стратегии в本文 основаны на личном техническом анализе, предназначены только для личного trading дневника, не являются инвестиционной рекомендацией или основанием для действий. Рынки рисковы, инвестиции требуют осторожности, не принимайте решений на основе этого.


