Accumulation Across the Entire Market, BTC May Challenge the $86,000 Resistance Zone?

marsbitОпубликовано 2026-08-27Обновлено 2026-08-27

Введение

Record-breaking short liquidations ignited a roughly 26% rebound in Bitcoin from the August lows. Unlike previous leverage-driven squeezes, this rally is supported by substantial buy-side demand. U.S. spot ETFs recorded their strongest weekly inflows of the year, with $2.23 billion, while bitcoin continued to flow out of exchanges. On-chain data shows all wallet cohorts are simultaneously accumulating coins, confirming broad-based buying. Leverage has been effectively cleared post-squeeze, with bitcoin-denominated futures open interest contracting. The funding rate has hovered around neutral, indicating the move was driven more by short covering than new speculative longs. A key challenge lies ahead: a significant supply wall in the $81k to $86k range. This zone is defined by the cost basis of long-term holders, concentrated sell-side order book liquidity, and pending short liquidation clusters. Market structure appears top-heavy, with large-cap assets outperforming smaller ones, a pattern typical of early-cycle rallies. Bitcoin has also decoupled from equities during this move. Cycle indicators have risen from a prolonged "cool" phase, positioning the market in an early stage, far from historical top readings. The path forward hinges on whether this overhead supply can be absorbed. A sustained close above ~$83.3k with continued ETF inflows would signal strength. Conversely, a break below the ~$70k short-term holder cost basis, and ultimately the ~$62k-$65k support floor, ...

Author: Glassnode

Compilation: AididiaoJP, Foresight News

Core Summary

  • Record short liquidations triggered a rebound; Bitcoin faces a test in the $81,000 to $86,000 supply concentration zone.
  • ETFs recorded a weekly net inflow of $2.23 billion; all market cohorts are accumulating synchronously, providing clear capital support.
  • Leverage unwound as the market churns; the $81,000-$86,000 range becomes the key resistance band overhead.

Introduction

A historically large short liquidation event ignited a rebound of approximately 26% from the mid-August low. Unlike past short-term squeezes driven solely by leverage, this rally has been backed by substantial buying pressure: U.S. spot ETFs recorded their strongest weekly inflows of the year, Bitcoin continued to flow out of exchanges, and all wallet size cohorts on-chain showed synchronized accumulation. At present, whether the rebound can extend to the January high depends crucially on whether the supply-concentrated zone between $81,000 and $86,000 can be effectively breached.

The Liquidation Storm: History's Largest Short Squeeze Ignites the Rebound

Record Single-Day Short Liquidations

In dollar terms, August 19, 2026, saw the largest single-day short liquidation volume since data began in 2019. During the entire squeeze window, short liquidations accounted for 85% of total liquidations. It should be noted that our data covers major centralized exchanges but excludes Hyperliquid, so the actual total liquidation value is higher than our statistics.

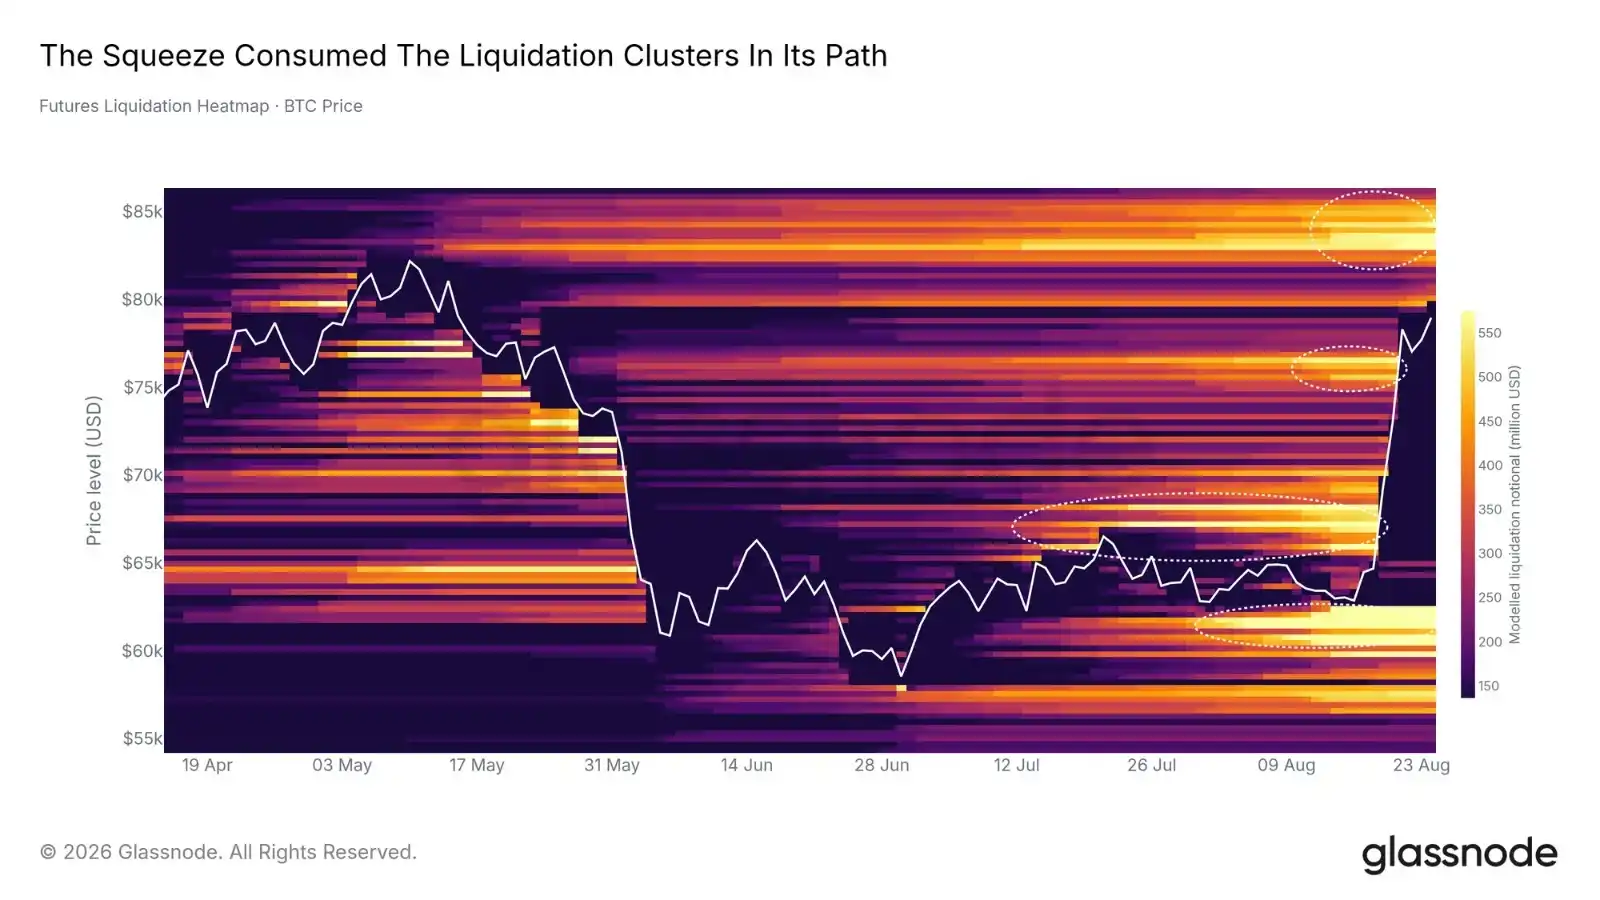
The liquidation heatmap clearly shows how price action consumed this "fuel." Clusters of simulated liquidation levels along the price path were triggered one by one during the rebound, digesting roughly 86% of the liquidation orders along the way. The remaining orders are distributed at both ends: a dense cluster of short liquidation orders sits above in the $82,000-$86,000 range, while residual long liquidation orders linger below in the $60,500-$62,400 area.
Significant Leverage Unwinding

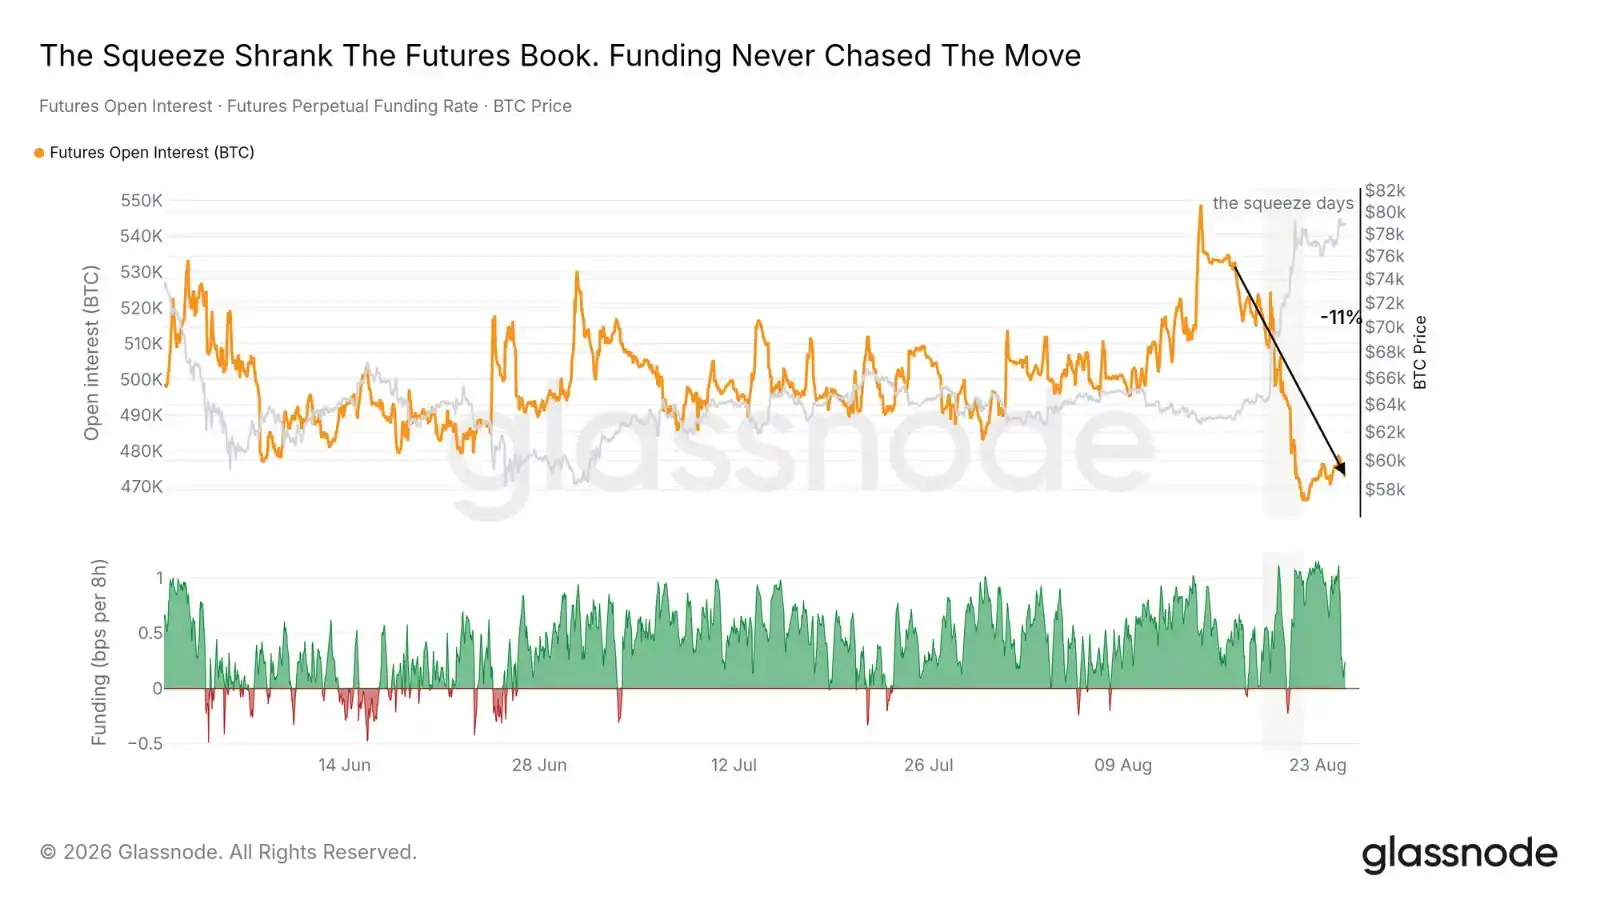
This squeeze effectively cleared leverage from the market it passed through. Measured in Bitcoin terms, futures open interest contracted by 11% during the window. The expansion in dollar-denominated nominal size was entirely due to price appreciation—meaning the liquidated short positions were not quickly replaced by new contracts.

Perpetual swap funding rates also confirm this. Throughout the rebound, funding rates fluctuated mostly around the neutral baseline, occasionally turning negative. This indicates the rally was not driven by new long speculation but rather a passive unwinding triggered by concentrated stop-loss executions. If Bitcoin-denominated open interest begins to expand again alongside rising funding rates, it would be the first warning sign of renewed leverage influx.
Capital Flow Validation: Real Money Backs the Rebound

ETF Channel Reactivated

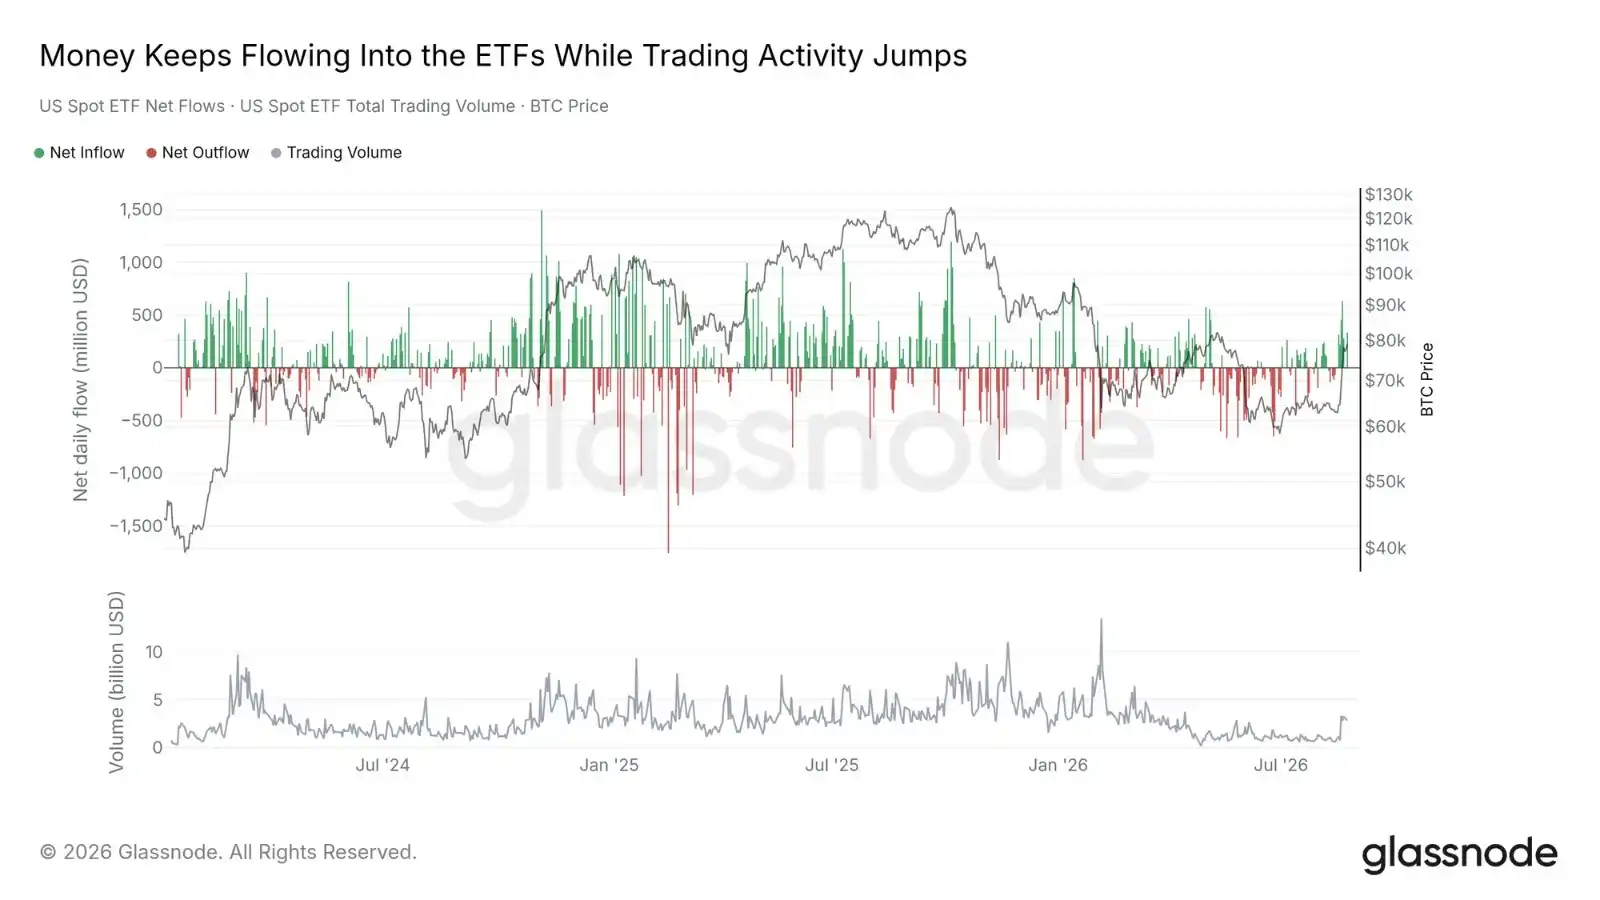
U.S. spot Bitcoin ETFs achieved net inflows of $2.23 billion during the squeeze window, with not a single day of outflows, marking the strongest weekly net absorption record for the year. The largest single-day subscription size during this period was the highest since January 14, 2026. The price also reclaimed the short-term holder cost basis during the rebound.

Trading activity recovered somewhat but remains far from historical peaks: the average daily ETF trading volume during the squeeze week was approximately $2.4 billion, roughly half the levels seen during the January-February peak period and about one-third lower than last August.
On-Chain Supply Shifts Up the Size Ladder

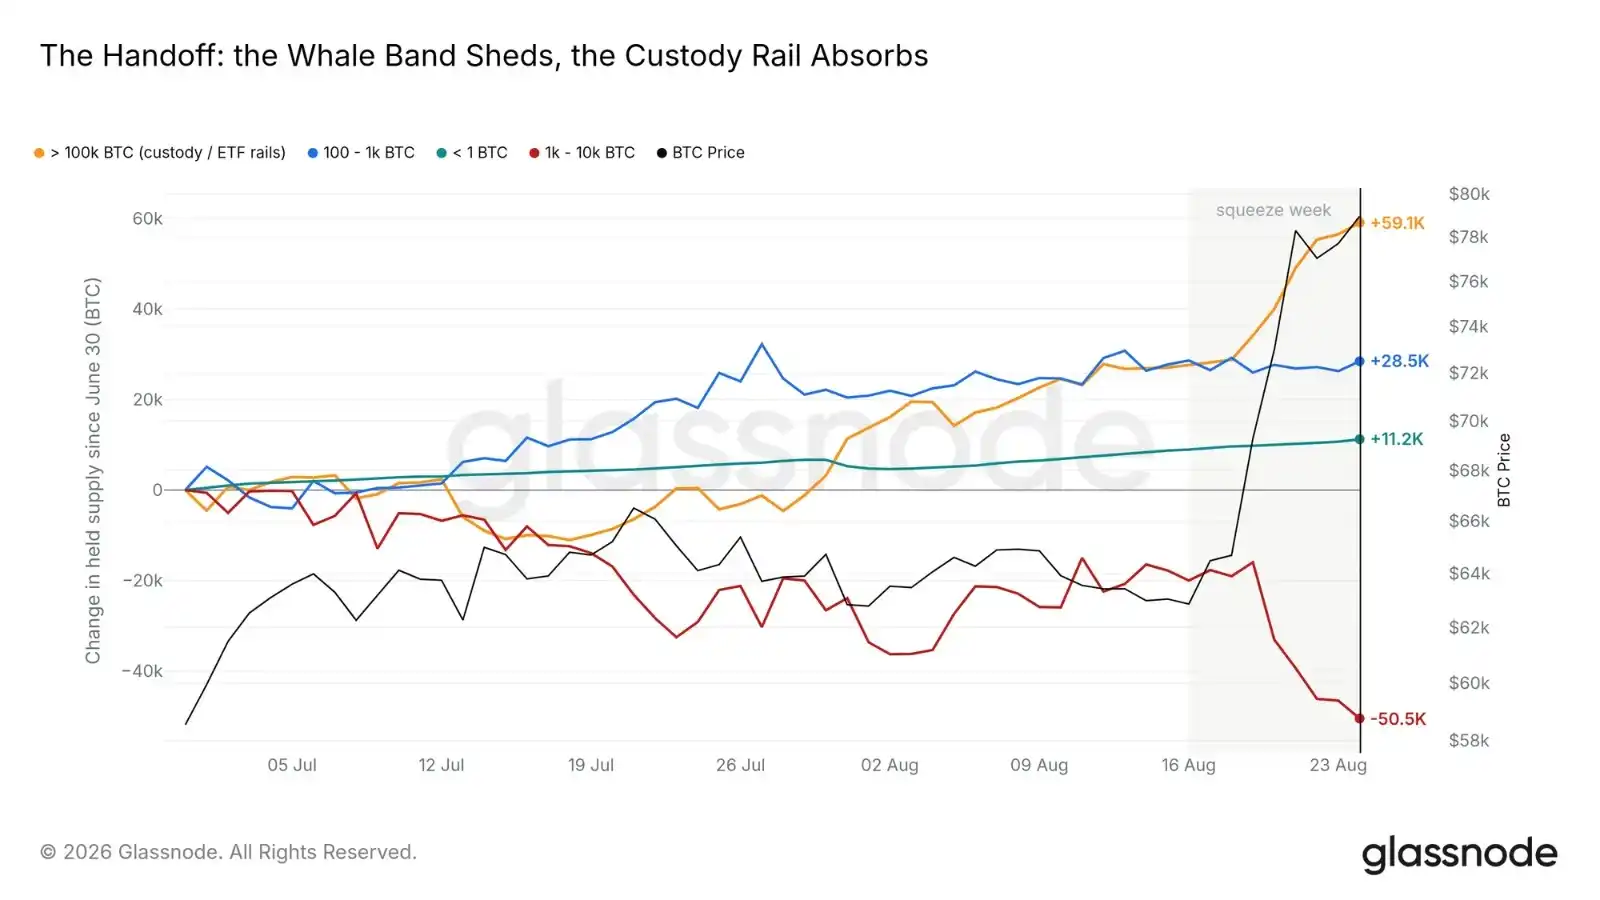
Since the low on June 30, 2026, entities holding 1,000-10,000 BTC have cumulatively reduced their holdings by approximately 50,500 BTC. Meanwhile, the largest cohort (holding over 100,000 BTC, primarily comprising exchanges, custodians, and ETF wrapper products) absorbed about 59,100 BTC during the same period. Capital is flowing up the size ladder from mid-sized and smaller whales toward large custodial institutions.

This trend intensified during the squeeze week: the custodial cohort increased holdings by approximately 31,500 BTC within the window, a magnitude comparable to the weekly ETF net subscriptions (though not a direct coin-for-coin match). BTC flowing from distressed whale wallets is appearing on institutional custodial channels in similar size.
Synchronized Accumulation Across All Market Cohorts

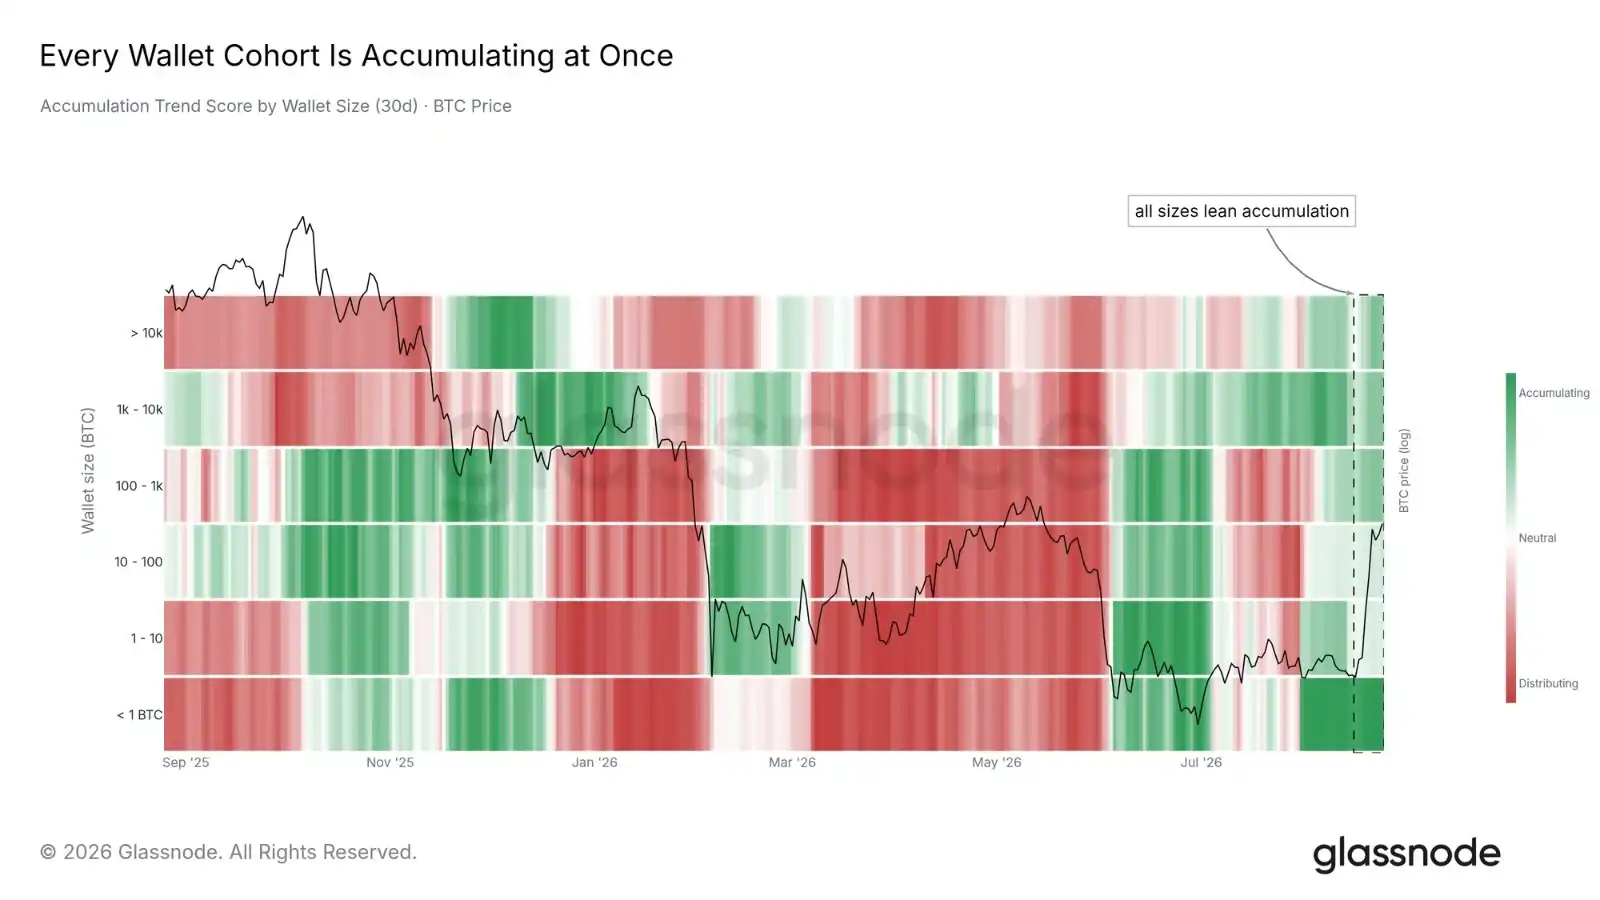
The breadth of buying behavior confirms the authenticity of capital inflows. The 30-day accumulation trend score shows that all six wallet size cohorts are at or above the 0.5 neutral threshold. This state has persisted for 20 days since August 5, marking the longest period of synchronized accumulation across all cohorts since the 22-day record in late 2024.

The squeeze day itself was primarily driven by large wallet accumulation, while smaller cohorts had been gradually building positions throughout August. If the score for any cohort falls back below 0.5, it would be the first signal of a crack in market breadth, indicating that the buying pressure supporting this rebound is narrowing.
Rebound Structure: Cycle Positioning and Cross-Asset Performance

Cycle Indicators Exit the Cooling Zone

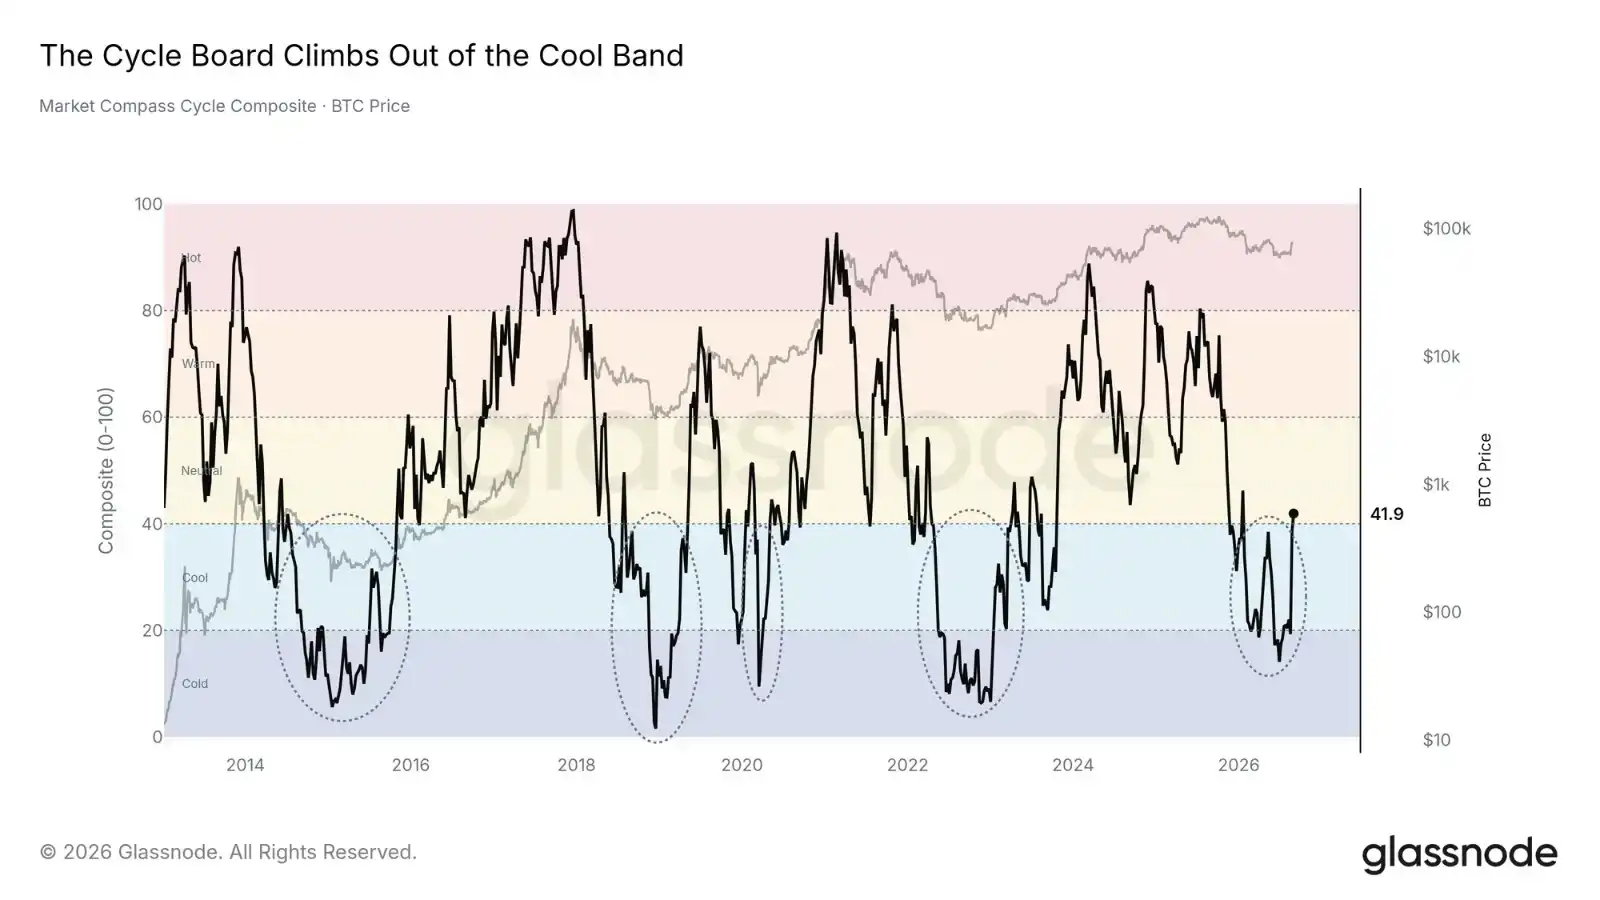
The Cycle Composite Indicator (the median of 45 on-chain cycle metrics) has rebounded to the 40 neutral boundary, after spending a prolonged seven months in the "Cold" to "Cool" range.

The five rings on the chart mark similar extended periods of low readings in history: 2014-2015, 2018-2019, 2020, 2022-2023, and the current cycle. Each corresponded to the low regions of their respective cycles. This indicator does not predict the speed of the rebound but positions the current market action in the early stages of a cycle, far from the readings seen in past top regions.
Rebound Structure Shows "Top-Heavy" Characteristic

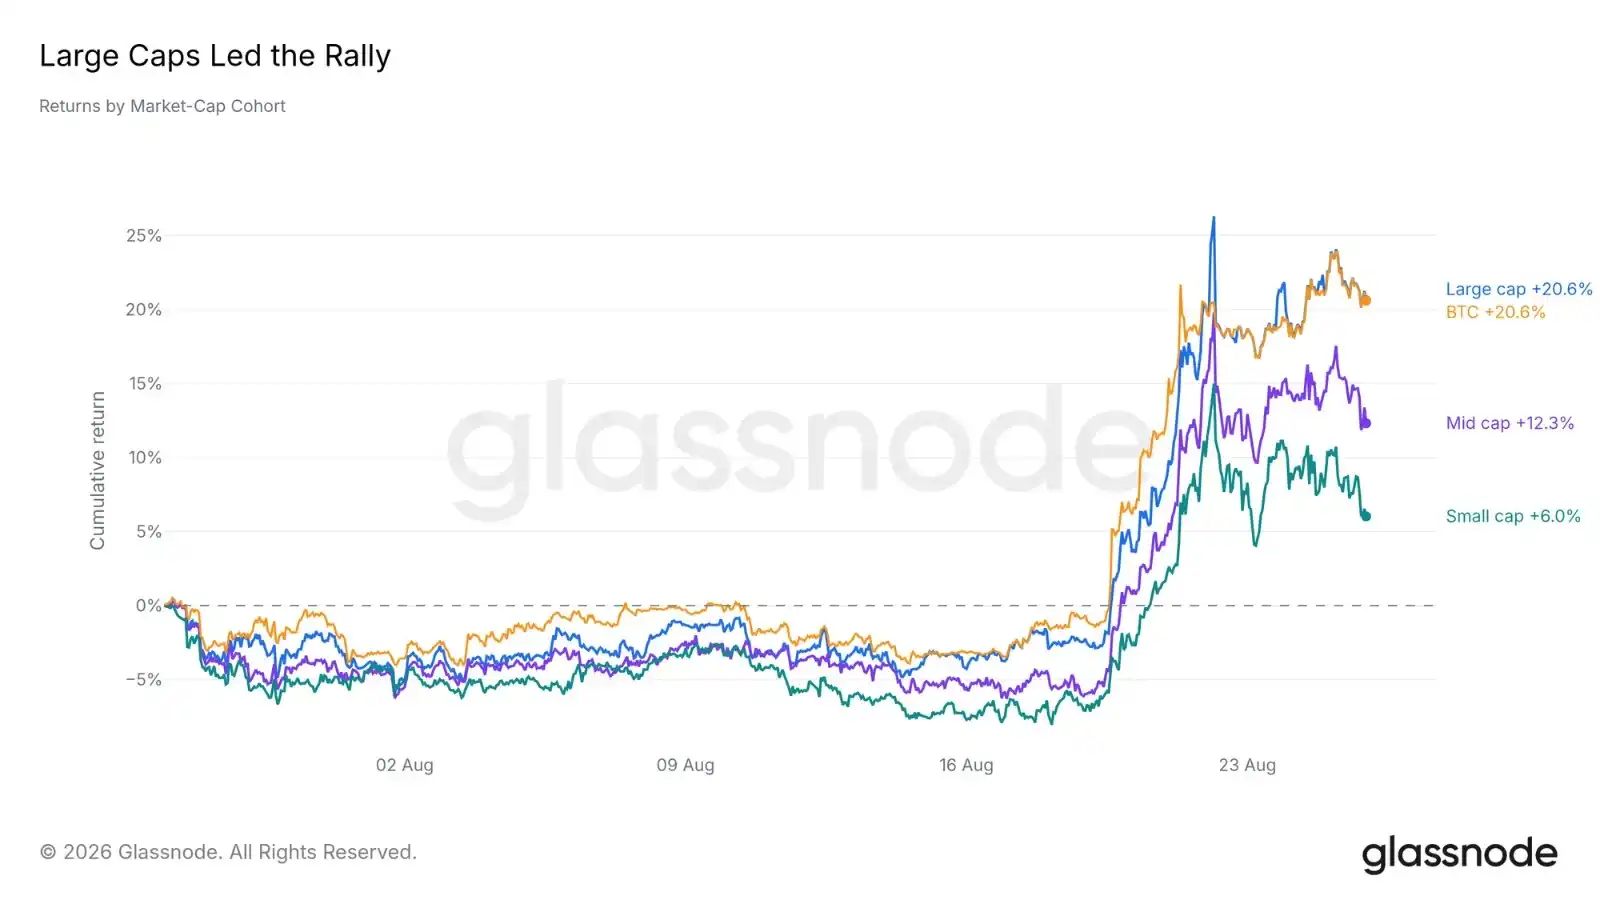
Looking across assets, the breadth of the rally is relatively narrow. Over the past month, the large-cap cohort averaged returns of about 20.6%, roughly in line with Bitcoin; while the small-cap cohort gained only about 6.0%. The smaller the market capitalization, the less capital inflow it received.

This is a typical structure for an early-stage rebound—the most liquid assets get allocated first. If smaller and mid-cap cohorts can catch up later, the rally will diffuse to a broader range; until then, this remains a market led by large-cap coins, with Bitcoin at the forefront.
Significant Decoupling from U.S. Stocks

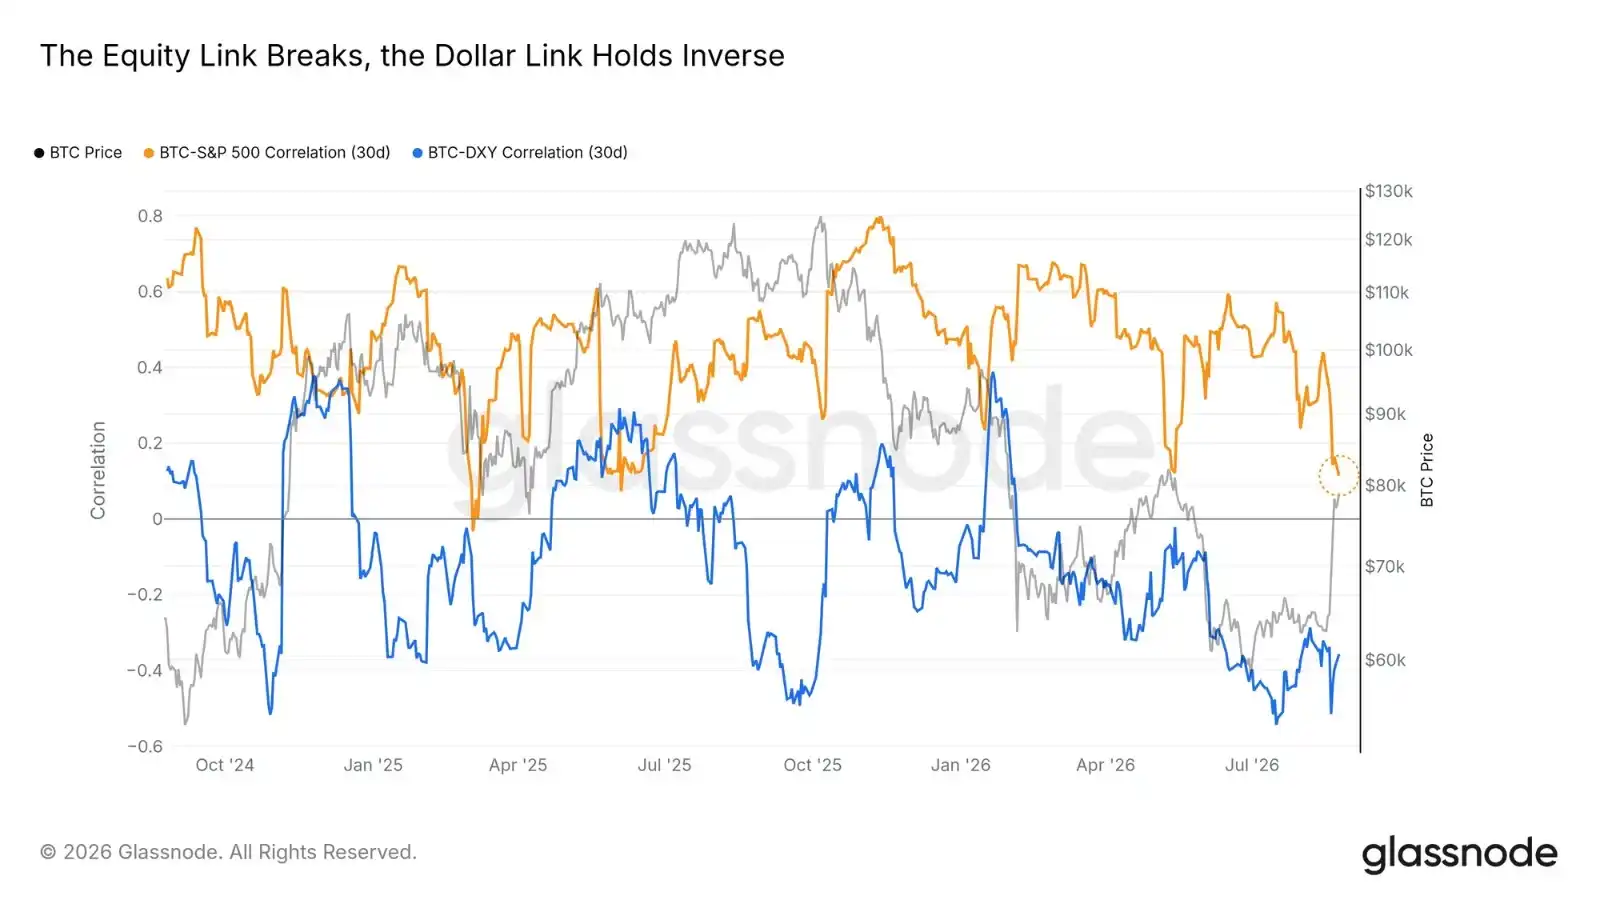
This rebound has diverged from macro trends. During the squeeze window, Bitcoin rose about 25%, while the S&P 500 index fell 1.7%. Their one-month rolling return correlation plunged to near zero. The negative correlation with the U.S. dollar remained intact.

Similar rapid decouplings in 2025 reverted to the mean within weeks on two occasions, so a structural shift cannot yet be asserted—the quarterly-window correlation has only just begun to turn downward. However, a rebound completed against a backdrop of stock market weakness is clearly not a "stock beta" play; its true driving force is capital flowing into the crypto market itself.
Overhead Resistance: The $81,000-$86,000 Supply-Concentrated Zone

Cost Basis: A Floor and Ceiling Coexist

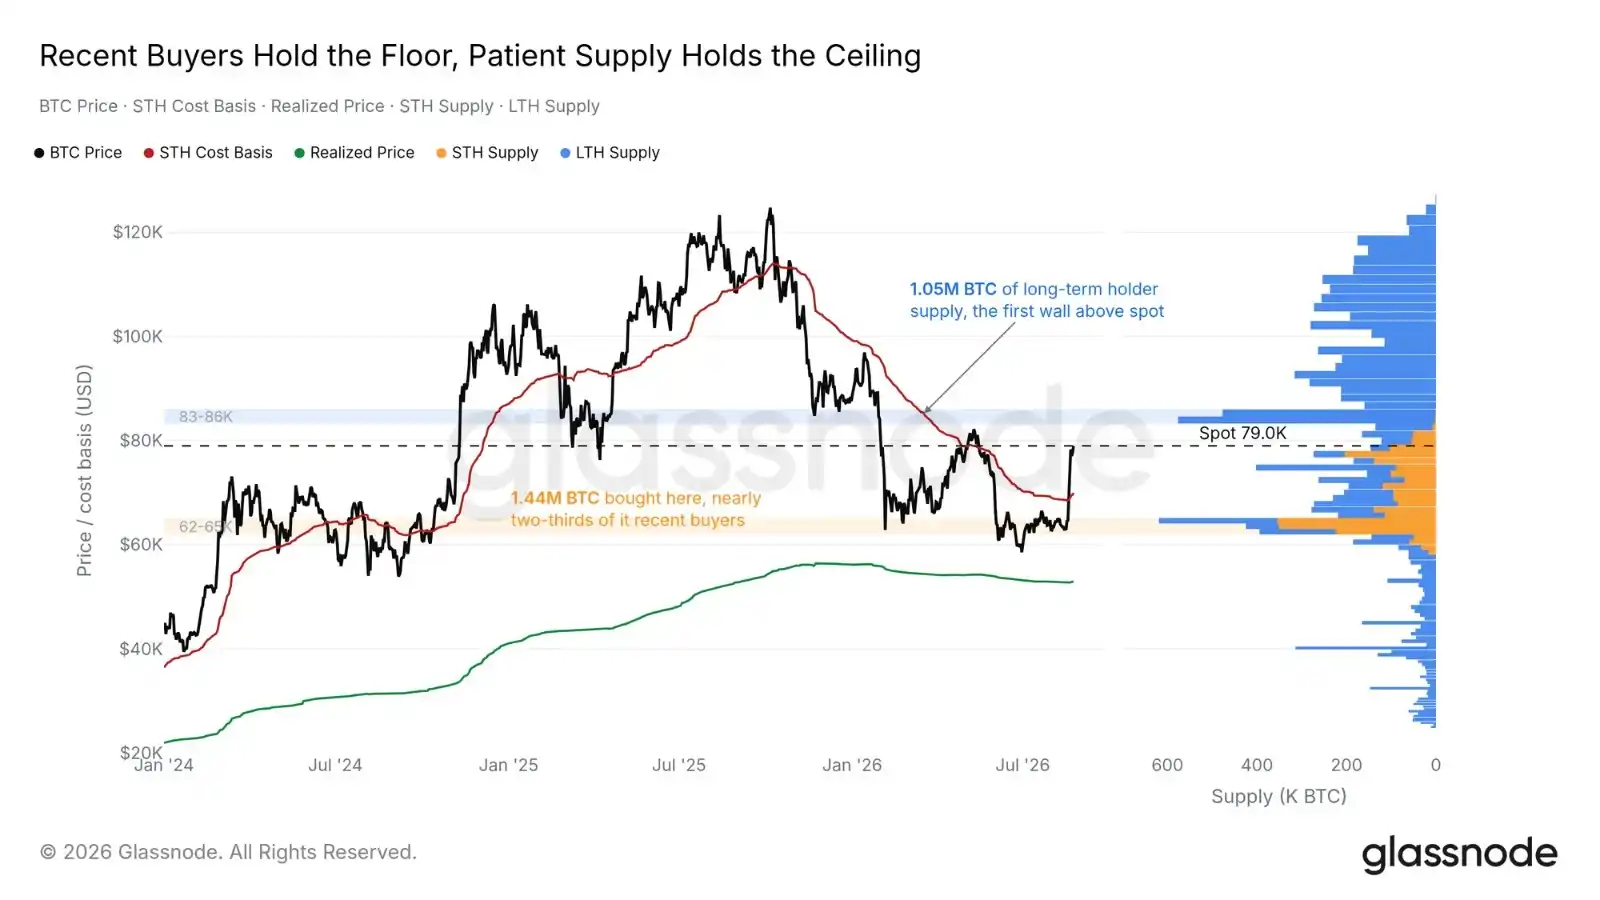
On-chain cost distribution now sandwiches the price. Below, buyers who entered during the June-August bottom hold a cost basis in the $62,000-$65,000 range, with nearly two-thirds belonging to short-term holders—recent buyers inclined to defend their cost line. Above, the first major supply structure sits between $83,000 and $86,000, almost entirely comprised of long-term holders who experienced the full decline.

The current spot price resides in the gap between. The short-term holder cost basis has recovered to around $70,000 (below the price). An assault on the $83,000-$86,000 zone would test whether long-term holders choose to sell near their break-even point.
Sell-Side Orders Regroup Overhead

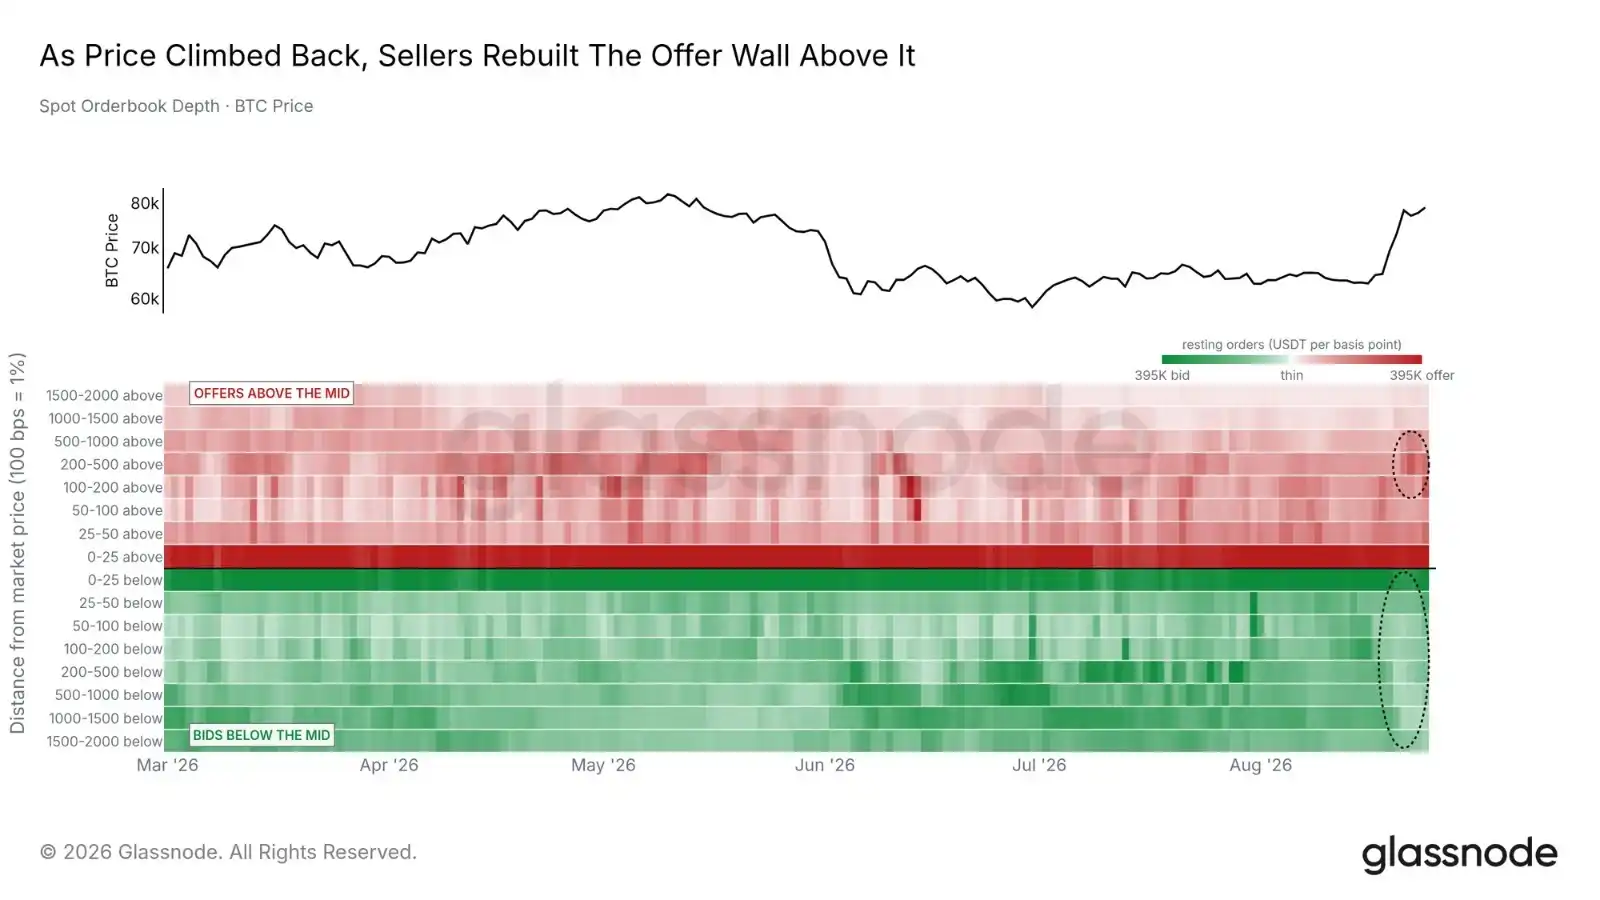
As prices rose, sell orders reappeared on the order books above. Static sell orders in the +100 to +1000 basis point range above the mid-price grew by about 41% in the last five days of the window. Meanwhile, buy-side depth across the visible order book thinned by approximately 32% in the last seven days. Static orders can be canceled instantly, so the order book reflects zones of seller willingness—currently, sellers prefer to place orders above.

This regrouping of sell orders points to the same zone as several independent metrics: the first self-custodied cost basis plateau begins at $80,800, market maker gamma turns negative at $82,300, existing liquidation orders extend to $86,000, and a wall of patient supply fills the $83,000-$86,000 range. All overhead structures we track are currently concentrated between $81,000 and $86,000—this is the true test for the rebound's sustainability.
Options Market Pricing: Stability Expected

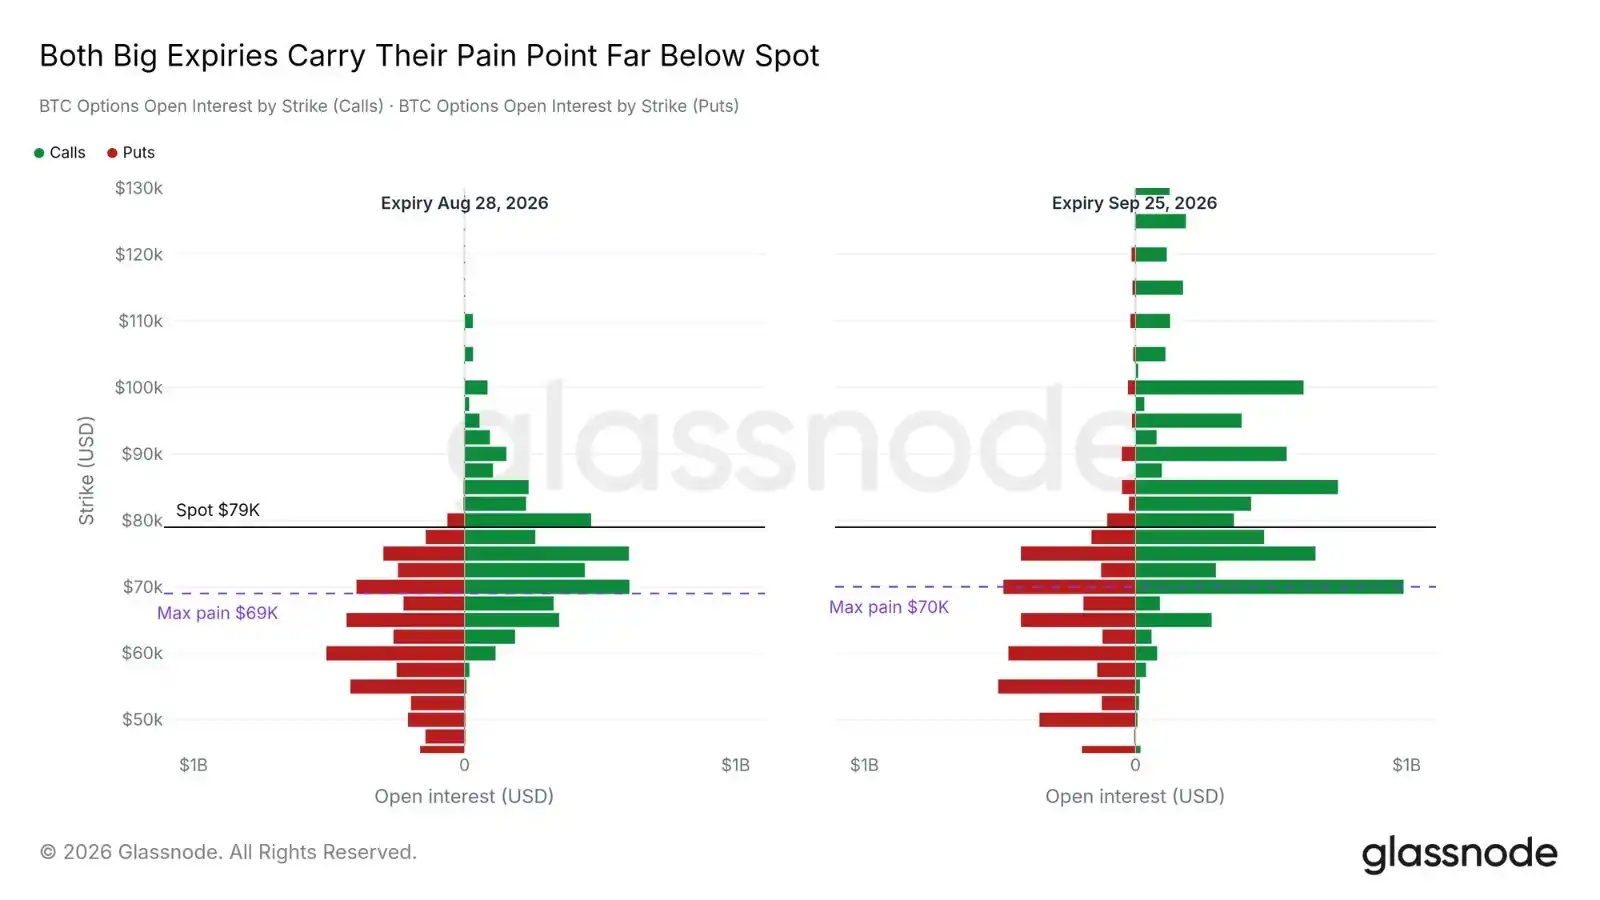
The options market indicates patient expectations. The two most concentrated upcoming monthly expiries—this Friday with about $10.4 billion in notional value and the September quarterly expiry with about $13.7 billion—have their respective max pain points significantly below the spot price. Max pain (the strike price where the largest number of options expire worthless) is at $69,000 and $70,000, respectively, while spot is around $79,000. Below lies a concentration of puts, above a concentration of calls.

The forward distribution is relatively flat. For expiries up to September 25, 2026, about 70% of the strike prices imply outcomes within the $69,000 to $89,700 range, with the median only a few hundred dollars above spot. The options market's base-case scenario prices in stability within the current supply wall: neither expecting a breakout above the $86,000 zone, nor a retreat back to the floor below.
Conclusion

The largest short liquidation event in our data records initiated this rebound; sustained ETF subscriptions, active on-chain buying, and net exchange outflows provided the capital needed for continuation; cycle indicators still position the market in an early stage. This is a typical profile for a phased rally.

Confirmation signals would come from above: a sustained close above $83,300, coupled with continuing ETF inflows, would indicate the supply wall is being absorbed rather than respected. Weakness signals would first manifest with a loss of the $70,000 short-term holder cost basis, followed by the $62,000-$65,000 floor zone defended by recent buyers. A return to the $62,900 squeeze starting point would completely erase the entire move.


Трендовые криптовалюты

Связанные с этим вопросы

QWhat triggered the recent Bitcoin rally according to the article?

AThe rally was triggered by an unprecedented, record-breaking short squeeze event, where a massive amount of short positions were liquidated, sparking a 26% rebound from the mid-August lows.

QWhat key price zone is identified as the major supply and resistance area for Bitcoin's upward movement?

AThe key resistance and supply-dense zone is identified as the $81,000 to $86,000 range. A successful and sustained break above this area is crucial for the rally to continue towards the January highs.

QHow did US spot Bitcoin ETFs perform during the short squeeze window, and why is it significant?

AUS spot Bitcoin ETFs recorded net inflows of $2.23 billion during the short squeeze window, with no single day of outflows. This marked the strongest weekly inflow of the year and provided substantial, real capital backing for the rally, confirming genuine institutional buying interest.

QWhat does the 'Accumulation Trend Score' data reveal about market breadth during this rally?

AThe 30-day Accumulation Trend Score data shows that all six wallet size cohorts were at or above the neutral threshold of 0.5, indicating a synchronized accumulation of Bitcoin across all market participant groups—from small to large holders. This widespread buying confirms the breadth and authenticity of the market's strength.

QAccording to the article, what are the key signals for confirming a continuation of the rally versus a potential failure?

AA bullish confirmation signal would be a sustained close above $83,300 combined with continued ETF inflows, showing the supply wall is being absorbed. A bearish failure signal would be a loss of the $70,000 support (Short-Term Holder cost basis), followed by a break below the $62,000-$65,000 floor defended by recent buyers. A drop back to the $62,900 squeeze starting point would invalidate the entire rally.

Похожее

Только что, Claude Code снова эволюционировал, теперь он помогает пользователям составлять «отчёты об обратной связи»

Только что Claude Code представил новую полезную функцию — автоматическое составление отчетов об ошибках и проблемах. Когда функция выходит из строя, Claude совершает ошибку или пользователь указывает на проблему, ИИ автоматически генерирует черновик отчета. Пользователь может просмотреть, отредактировать его и решить, отправлять ли разработчикам. Функция доступна в Claude Code v2.1.238 и выше. Черновики сохраняются локально (`~/.claude/feedback/drafts/`) и отправляются в Anthropic только после одобрения пользователя. Отчеты создаются при сбоях инструментов, невозможности выполнить запрос, обнаружении ошибок или по прямому запросу пользователя. При появлении черновика в интерфейсе показывается карточка. Пользователь может: просмотреть черновик (1), сразу отправить его (дважды нажать 2) или проигнорировать (0). Команда `/feedback` открывает очередь всех черновиков, где их можно редактировать, отправлять или удалять. Отправленные отчеты удаляются с устройства. Неотправленные черновики автоматически удаляются через 30 дней, в очереди может храниться до 10 штук. Функция недоступна в неинтерактивных режимах, облачных сессиях, при использовании платформ вроде Amazon Bedrock, а также если отключена настройками среды или политиками организации (например, при включенном Zero Data Retention).

marsbit4 мин. назад

Только что, Claude Code снова эволюционировал, теперь он помогает пользователям составлять «отчёты об обратной связи»

marsbit4 мин. назад

TxFlow L1 укрепляет свою инфраструктуру с помощью аудита OpenZeppelin по мере расширения своей ончейн-экосистемы

TxFlow объявляет о завершении независимого аудита безопасности своей критически важной мостовой инфраструктуры ведущей компанией OpenZeppelin. В ходе проверки не было выявлено уязвимостей критического или высокого уровня серьезности, обнаруженная проблема средней тяжести была устранена. Этот аудит является частью комплексного подхода TxFlow к безопасности по мере развития своей финансовой экосистемы L1. Платформа, разработанная специально для финансовых рынков, включает в себя децентрализованную биржу (DEX) для перпетуальных контрактов и работает над инициативой Builder Code для расширения возможностей разработчиков. TxFlow L1 стремится создать единую цепочку для различных финансовых приложений, обеспечивая общую инфраструктуру для исполнения, ликвидности и расчетов. Партнерство с OpenZeppelin подчеркивает приверженность проекта стандартам безопасности, ожидаемым от серьезной финансовой инфраструктуры.

TheNewsCrypto14 мин. назад

TxFlow L1 укрепляет свою инфраструктуру с помощью аудита OpenZeppelin по мере расширения своей ончейн-экосистемы

TheNewsCrypto14 мин. назад

Криптовалютная компания Doppler Finance запускает новый альткоин, 1% которого будет разыгран в рамках аирдропа! Подробности здесь

Компания Doppler Finance анонсировала запуск собственного токена XDP. Он будет выполнять служебную и управляющую функцию в протоколе. Общий объем эмиссии ограничен 10 миллиардами токенов. Более половины из них направят на развитие экосистемы, партнерства и рост сообщества. Доля инвесторов будет иметь условия блокировки для долгосрочного участия. В рамках запуска (TGE) 1% от общего предложения будет разблокирован и распределен через аирдроп Genesis среди первых пользователей и сторонников экосистемы. Еще 43% токенов зарезервированы на стимулирование экосистемы в будущем. Запуск XDP призван увеличить вовлеченность пользователей и укрепить децентрализованное управление. Детальные даты и технические условия распределения будут объявлены позднее.

cryptonews.ru15 мин. назад

Криптовалютная компания Doppler Finance запускает новый альткоин, 1% которого будет разыгран в рамках аирдропа! Подробности здесь

cryptonews.ru15 мин. назад

Торговля

Спот

Популярные статьи

Тест по Bitcoin Биткоина

HTX Learn: Изучите Bitcoin halving и Заработаете Токены USDT

3.4k просмотров всегоОпубликовано 2024.04.16Обновлено 2024.04.16

Тест по Bitcoin  Биткоина

Что такое $BITCOIN

ЦИФРОВОЕ ЗОЛОТО ($BITCOIN): Комплексный анализ Введение в ЦИФРОВОЕ ЗОЛОТО ($BITCOIN) ЦИФРОВОЕ ЗОЛОТО ($BITCOIN) — это проект на основе блокчейна, работающий в сети Solana, который стремится объединить характеристики традиционных драгоценных металлов с инновациями децентрализованных технологий. Хотя он носит имя Биткойн, часто называемого “цифровым золотом” из-за его восприятия как средства хранения ценности, ЦИФРОВОЕ ЗОЛОТО является отдельным токеном, предназначенным для создания уникальной экосистемы в ландшафте Web3. Его цель — позиционировать себя как жизнеспособный альтернативный цифровой актив, хотя детали его применения и функциональности все еще развиваются. Что такое ЦИФРОВОЕ ЗОЛОТО ($BITCOIN)? ЦИФРОВОЕ ЗОЛОТО ($BITCOIN) — это токен криптовалюты, специально разработанный для использования в блокчейне Solana. В отличие от Биткойна, который выполняет широко признанную роль хранения ценности, этот токен, похоже, сосредоточен на более широких приложениях и характеристиках. Примечательные аспекты включают: Инфраструктура блокчейна: Токен построен на блокчейне Solana, известном своей способностью обрабатывать высокоскоростные и недорогие транзакции. Динамика предложения: ЦИФРОВОЕ ЗОЛОТО имеет максимальное предложение, ограниченное 100 квадриллионами токенов (100P $BITCOIN), хотя детали о его обращающемся предложении в настоящее время не раскрыты. Утилита: Хотя точные функциональные возможности не описаны, есть указания на то, что токен может быть использован для различных приложений, потенциально связанных с децентрализованными приложениями (dApps) или стратегиями токенизации активов. Кто создатель ЦИФРОВОГО ЗОЛОТА ($BITCOIN)? На данный момент личность создателей и команды разработчиков, стоящих за ЦИФРОВЫМ ЗОЛОТОМ ($BITCOIN), остается неизвестной. Эта ситуация типична для многих инновационных проектов в области блокчейна, особенно тех, которые связаны с децентрализованными финансами и феноменом мем-криптовалют. Хотя такая анонимность может способствовать культуре, ориентированной на сообщество, она усиливает опасения по поводу управления и ответственности. Кто инвесторы ЦИФРОВОГО ЗОЛОТА ($BITCOIN)? Доступная информация указывает на то, что у ЦИФРОВОГО ЗОЛОТА ($BITCOIN) нет известных институциональных спонсоров или значительных венчурных капиталовложений. Проект, похоже, функционирует по модели пирингового взаимодействия, сосредоточенной на поддержке и принятии сообществом, а не на традиционных путях финансирования. Его активность и ликвидность в основном сосредоточены на децентрализованных биржах (DEX), таких как PumpSwap, а не на устоявшихся централизованных торговых платформах, что еще больше подчеркивает его подход, ориентированный на grassroots. Как работает ЦИФРОВОЕ ЗОЛОТО ($BITCOIN) Операционные механизмы ЦИФРОВОГО ЗОЛОТА ($BITCOIN) можно подробно описать на основе его дизайна блокчейна и характеристик сети: Механизм консенсуса: Используя уникальный механизм доказательства истории (PoH) Solana в сочетании с моделью доказательства доли (PoS), проект обеспечивает эффективную валидацию транзакций, что способствует высокой производительности сети. Токеномика: Хотя конкретные дефляционные механизмы не были подробно описаны, большое максимальное предложение токенов подразумевает, что оно может быть предназначено для микротранзакций или нишевых случаев использования, которые еще предстоит определить. Интероперабельность: Существует потенциал для интеграции с более широкой экосистемой Solana, включая различные платформы децентрализованных финансов (DeFi). Однако детали относительно конкретных интеграций остаются неуточненными. Хронология ключевых событий Вот хронология, которая подчеркивает значимые вехи, касающиеся ЦИФРОВОГО ЗОЛОТА ($BITCOIN): 2023: Первоначальное развертывание токена происходит в блокчейне Solana, отмеченное его адресом контракта. 2024: ЦИФРОВОЕ ЗОЛОТО приобретает видимость, когда оно становится доступным для торговли на децентрализованных биржах, таких как PumpSwap, позволяя пользователям обменивать его на SOL. 2025: Проект наблюдает спорадическую торговую активность и потенциальный интерес к инициативам, возглавляемым сообществом, хотя на данный момент не зафиксировано никаких значительных партнерств или технических достижений. Критический анализ Сильные стороны Масштабируемость: Основная инфраструктура Solana поддерживает высокие объемы транзакций, что может повысить полезность $BITCOIN в различных сценариях транзакций. Доступность: Потенциально низкая цена торговли за токен может привлечь розничных инвесторов, способствуя более широкому участию благодаря возможностям дробного владения. Риски Отсутствие прозрачности: Отсутствие публично известных спонсоров, разработчиков или процесса аудита может вызвать скептицизм относительно устойчивости и надежности проекта. Волатильность рынка: Торговая активность сильно зависит от спекулятивного поведения, что может привести к значительной волатильности цен и неопределенности для инвесторов. Заключение ЦИФРОВОЕ ЗОЛОТО ($BITCOIN) является интригующим, но неоднозначным проектом в быстро развивающейся экосистеме Solana. Хотя он пытается использовать нарратив “цифрового золота”, его отход от установленной роли Биткойна как средства хранения ценности подчеркивает необходимость более четкого различения его предполагаемой утилиты и структуры управления. Будущее принятие и усвоение, вероятно, будут зависеть от решения текущей непрозрачности и более четкого определения его операционных и экономических стратегий. Примечание: Этот отчет охватывает синтезированную информацию, доступную на октябрь 2023 года, и с тех пор могут произойти события.

511 просмотров всегоОпубликовано 2025.05.13Обновлено 2025.05.13

Что такое $BITCOIN

Fractal Bitcoin: масштабирование Биткоина с помощью рекурсивной системы

Fractal Bitcoin — масштабное Layer-1-решнение, созданное на базе кода Биткоина, позволяющего достигать бесконечного масштабирования с помощью рекурсивного подхода.

2.6k просмотров всегоОпубликовано 2025.06.30Обновлено 2025.06.30

Fractal Bitcoin: масштабирование Биткоина с помощью рекурсивной системы

Обсуждения

Добро пожаловать в Сообщество HTX. Здесь вы сможете быть в курсе последних новостей о развитии платформы и получить доступ к профессиональной аналитической информации о рынке. Мнения пользователей о цене на BTC (BTC) представлены ниже.

活动图片