Bitcoin drops to $78K – Decoding the $1.3B liquidation ‘freefall’

ambcrypto发布于2026-02-01更新于2026-02-01

文章摘要

Bitcoin dropped to around $78,000 due to a significant market sell-off driven by heavy leverage and thin liquidity, resulting in approximately $1.3 billion in forced liquidations. The decline was not primarily caused by external factors like geopolitics but rather by a lack of market liquidity, which amplified the downturn. As leveraged positions were automatically closed, prices fell rapidly due to insufficient buyer support, and bearish sentiment further accelerated the sell-off. The crypto market decline coincided with a broader global sell-off, where over $12 trillion was wiped from markets within 48 hours. Precious metals like gold and silver saw sharp declines after rapid rallies, and equities also fell. Margin calls and increased exchange margin requirements exacerbated the selling pressure. Technical analysis indicates Bitcoin traded below its major moving averages for the first time since 2022, suggesting continued volatility. Experts recommend cautious capital management, such as dollar-cost averaging, rather than deploying all funds at once during such periods.

Bitcoin slipped to around $78K after a big selling event hit the crypto market. The drop was caused by heavy leverage and thin liquidity, causing forced liquidations and a fast fall in prices.

A drop of liquidity, not the news

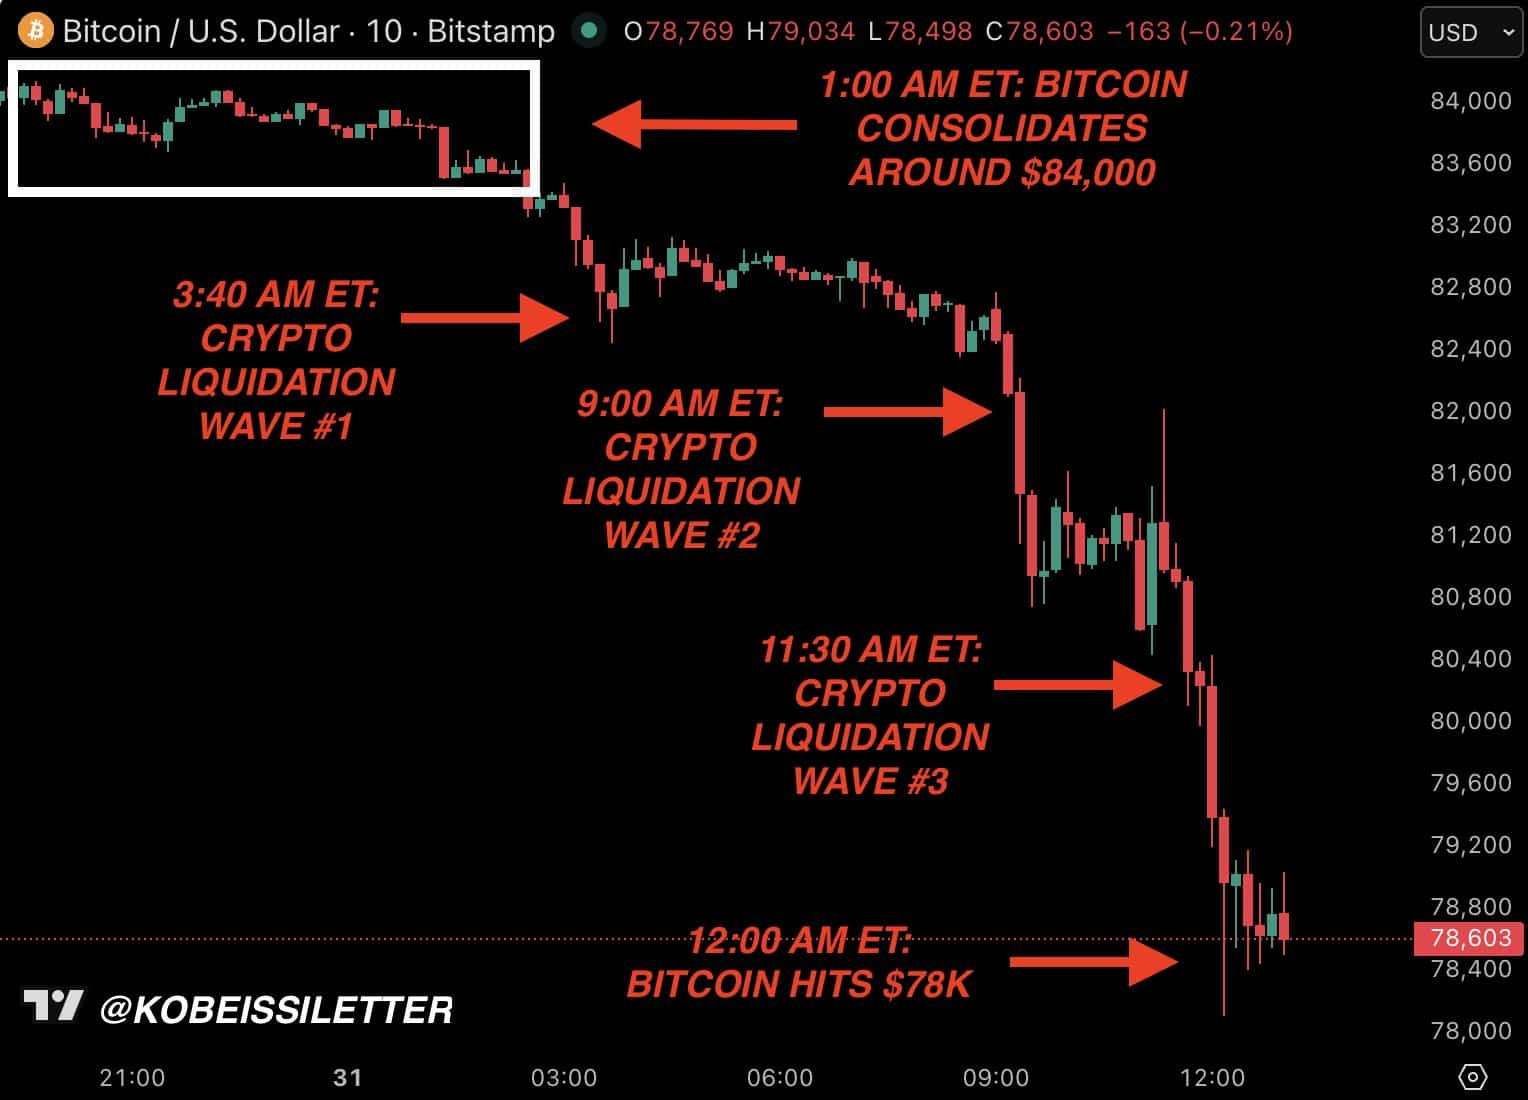
A lot of factors are being thrown around for today’s crypto selloff, from geopolitics to central banks. But the flow data shared by The Kobeissi Letter on X draws it down to one simple reason.

The market just ran out of liquidity.

Source: X

Bitcoin’s freefall state happened alongside three distinct liquidation events over about 12 hours, wiping out roughly $1.3 billion in positions. Each wave pushed prices lower as leveraged trades were automatically closed.

When liquidity is thin, heavy leverage leaves very little room for error. Prices can fall quickly because there aren’t enough buyers stepping in. Once liquidations start, they cause more selling, which pushes prices down even faster.

Crowd behavior amplified this.

As sentiment went bearish, traders rushed to the exit at the same time. A response like that stretches far beyond what the fundamentals alone would tell you.

Beyond crypto

According to Bull Theory, more than $12 trillion was wiped out from global markets in just 48 hours, as metals and equities sold off at the same time.

Precious metals took the hardest hit: gold fell over 16%, silver nearly 39%, and platinum and palladium dropped sharply as well. Equities followed, with losses across major U.S. indices.

Metals had rallied too far, too fast.

Silver, for example, had posted nine straight green monthly candles. That’s something we’ve never seen before.

Prices attracted late buyers using leverage.

When prices turned, margin calls kicked in, and it caused selling. Exchanges then raised margin requirements, which poured fuel on the fire. Traders were forced to post more collateral in falling markets, leading to even more liquidations.

A sudden shift in Federal Reserve leadership expectations (which removed a key bullish narrative) added to the unwind.

What the charts say about the future

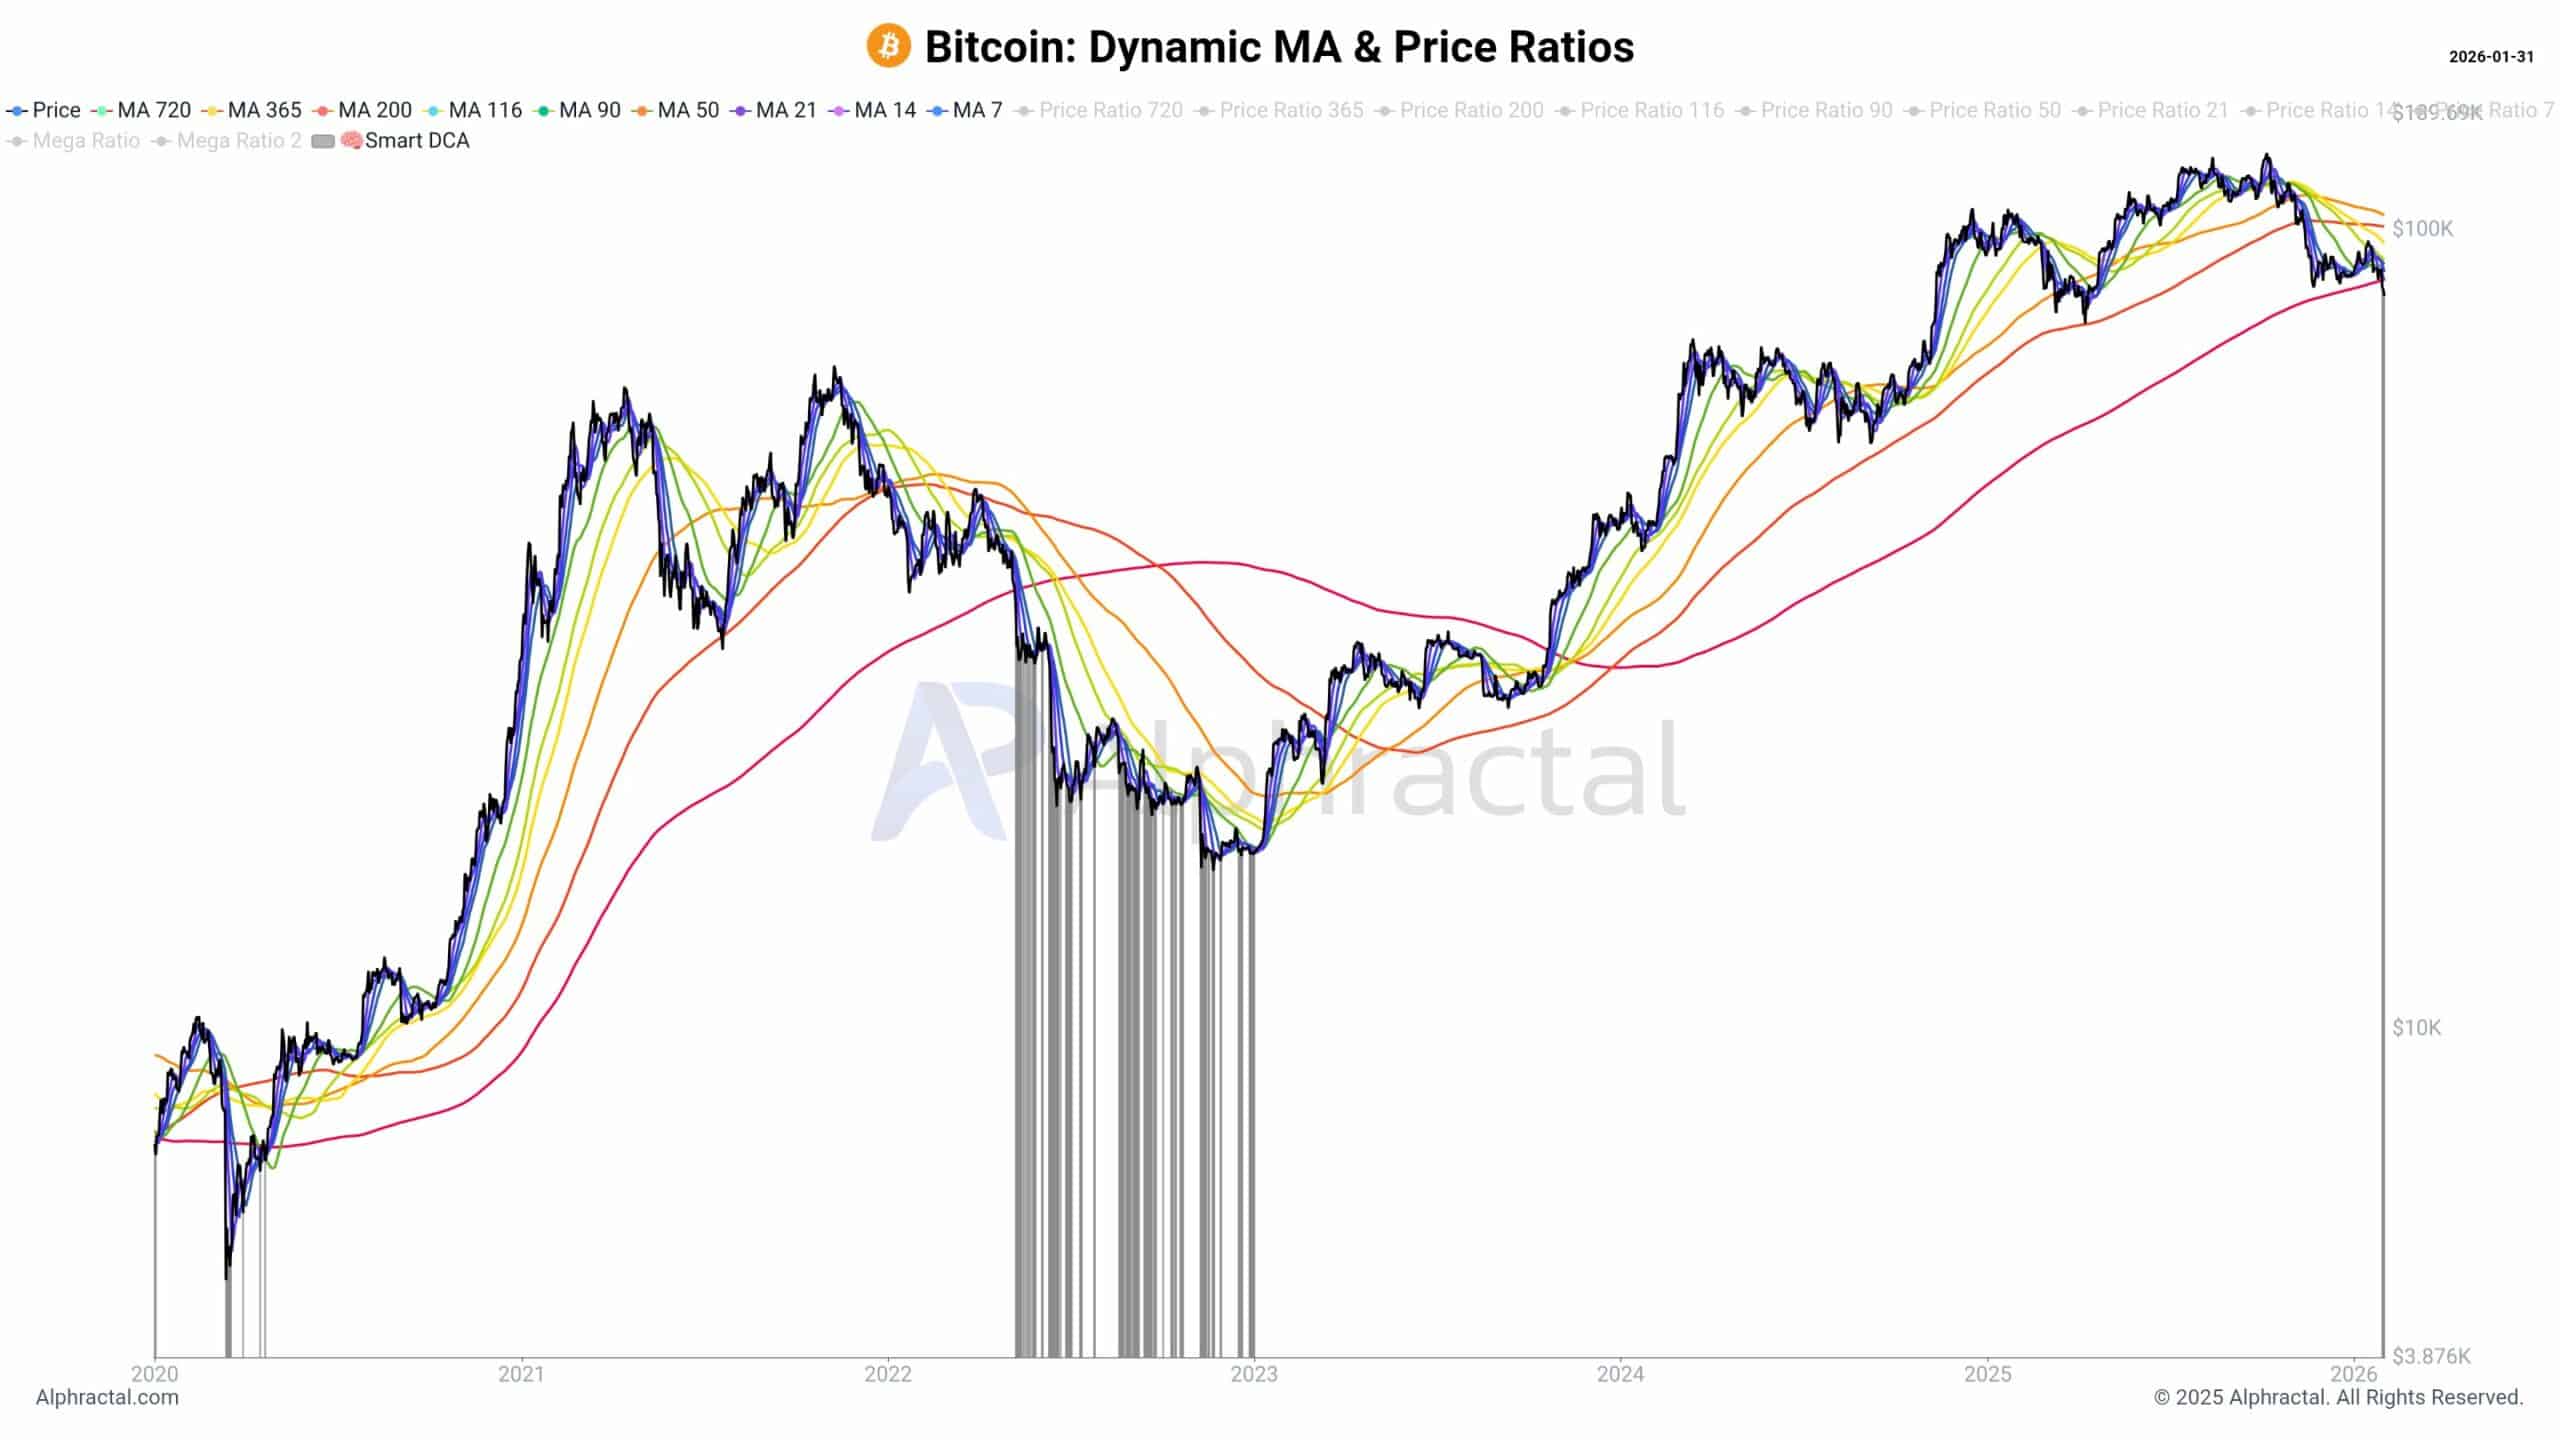
Source: Alphractal

According to Alphractal CEO Joao Wedson, Bitcoin [BTC] traded below its major moving averages for the first time since 2022. Price is going beneath long-term trend lines that often mean broader phases.

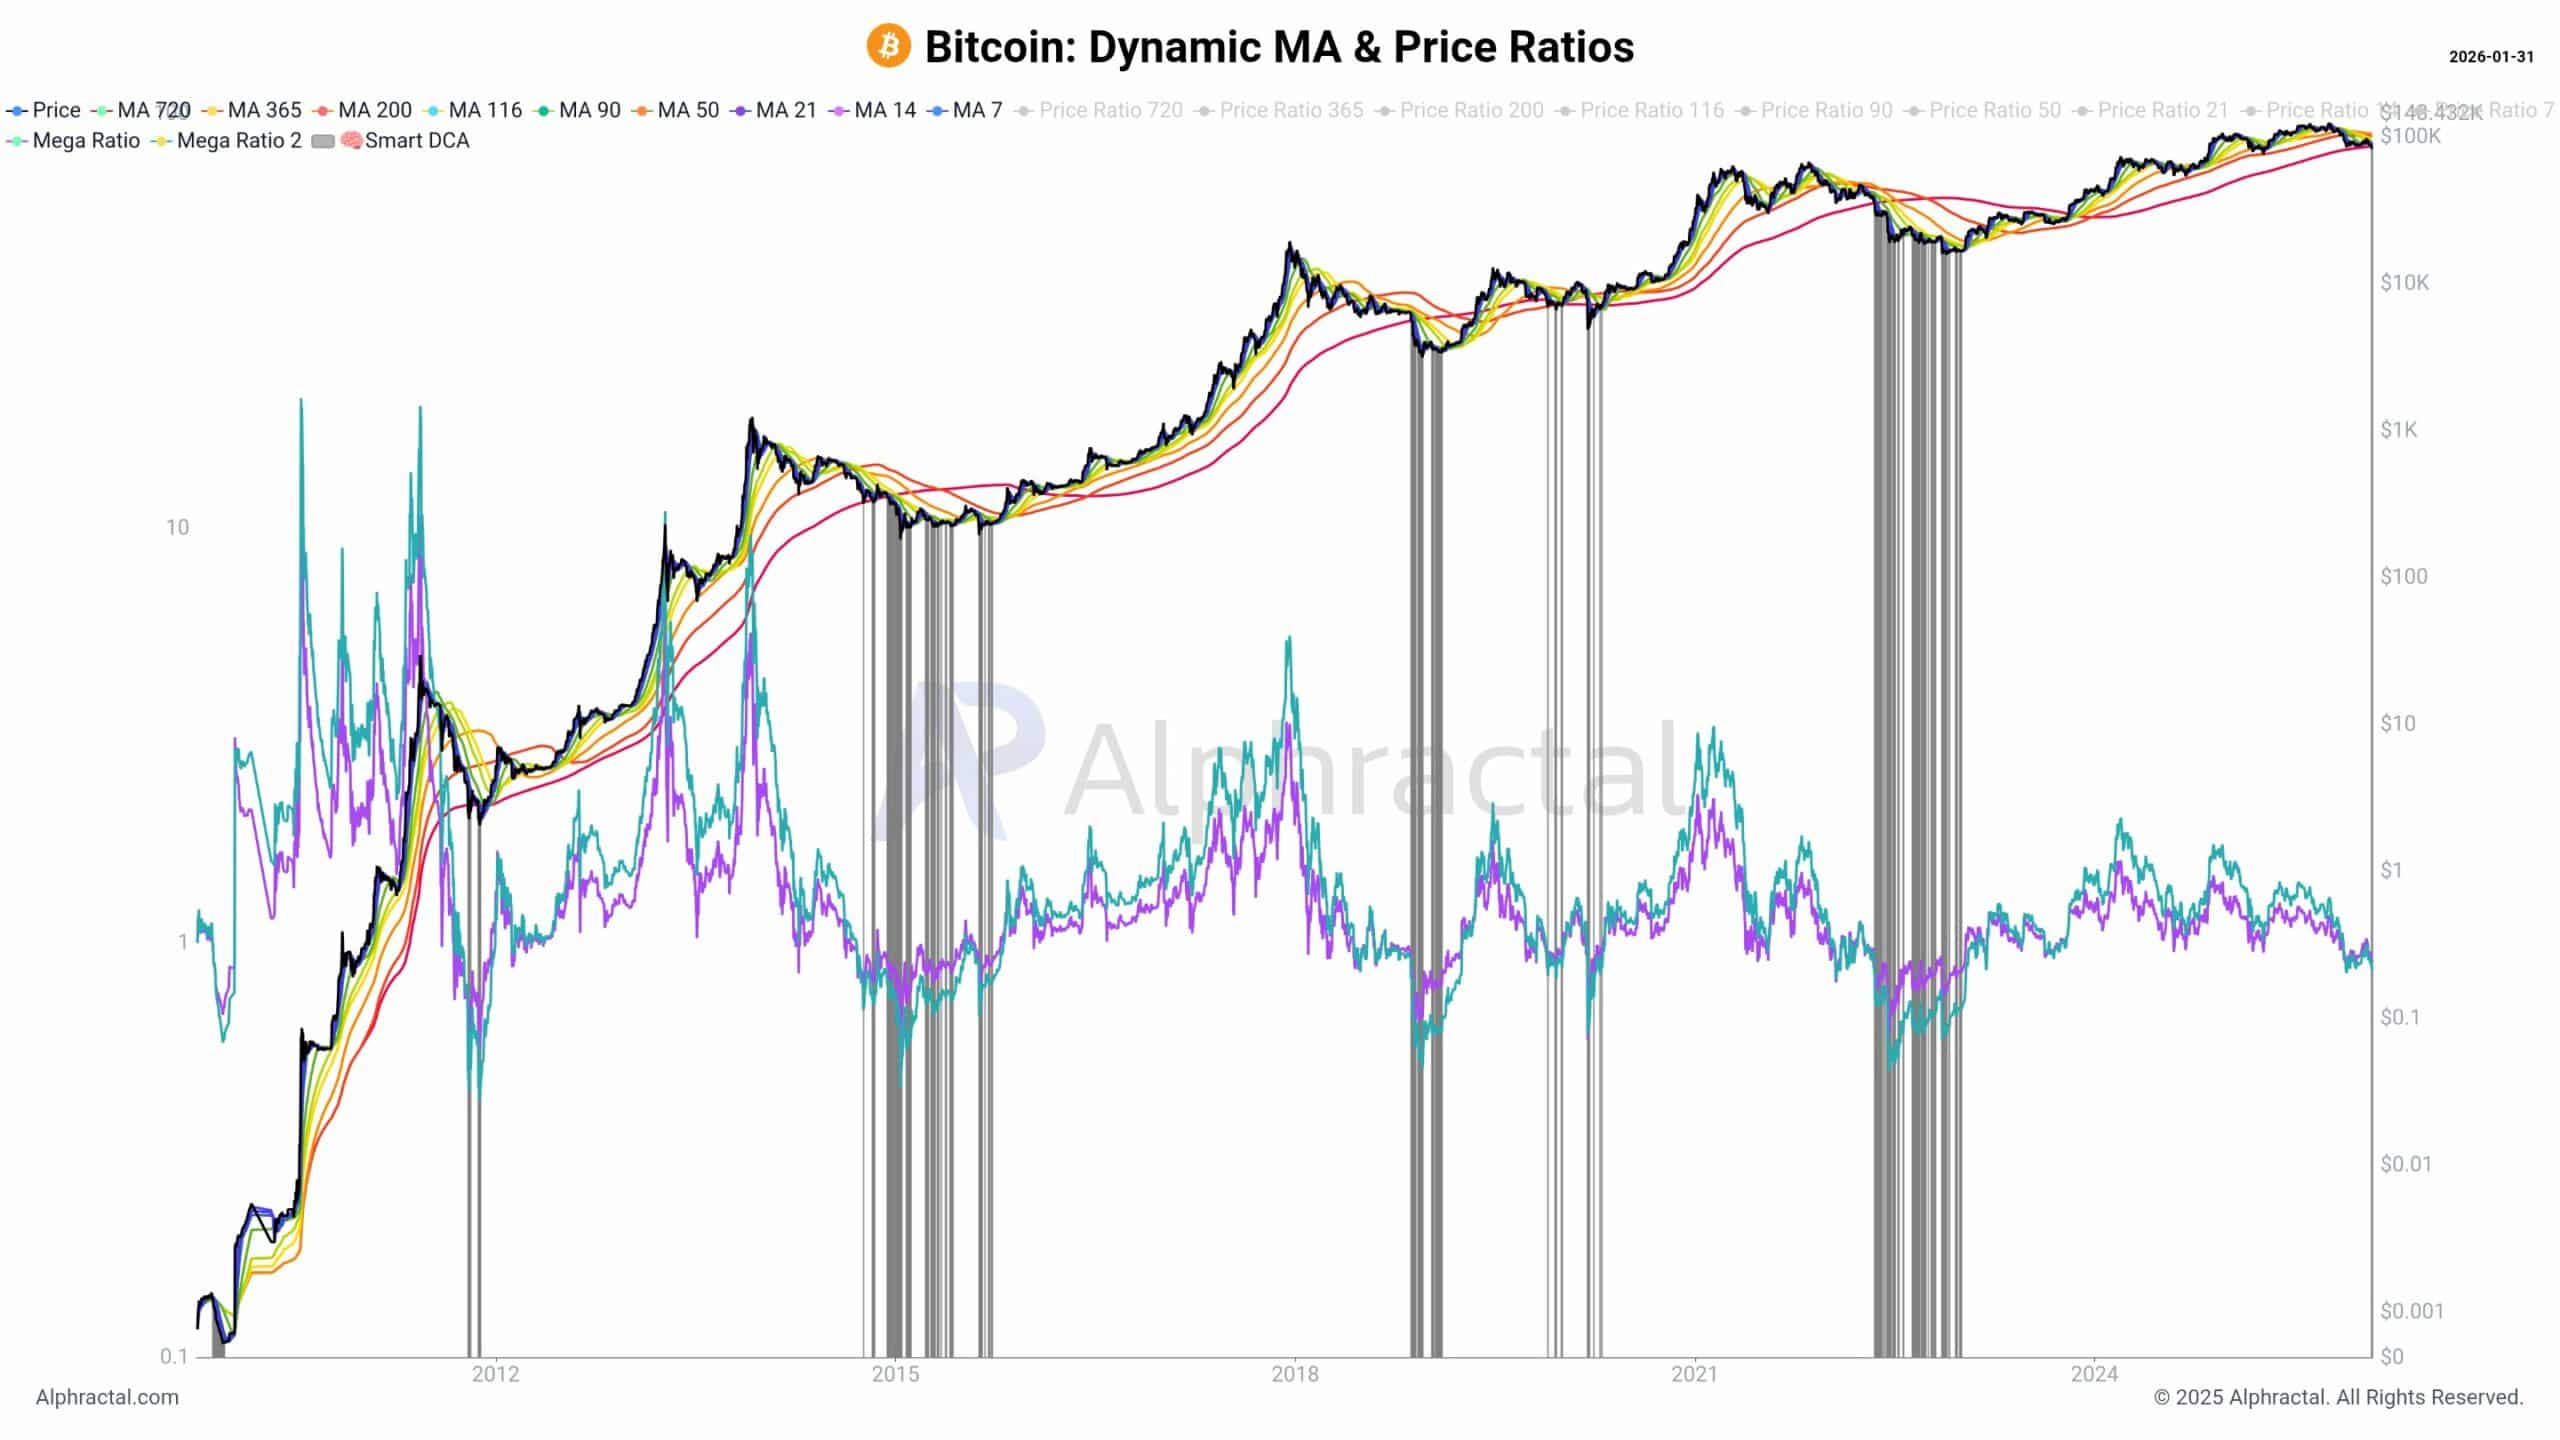
Source: Alphractal

This has so far been an early buying zone, with these phases lasting months! For more conservative investors, this is where gradual dollar-cost averaging has worked best.

Wedson noted that the key is capital management. Deploying everything at once rarely pays off in periods like this.

Instead, past cycles have said to hold back some cash and add exposure slowly. This is especially when fear is abound and most people expect things to get worse.


Final Thoughts

  • Bitcoin’s drop to $78K was caused by liquidations and thin liquidity.
  • With BTC now below key MAs, volatility is here to stay for a while.
Next: Solana: On-chain activity rises, but SOL isn’t done falling – Here’s why
Share
  • Share
  • Tweet

热门币种推荐

相关问答

QWhat was the primary cause of Bitcoin's sharp drop to $78,000 according to the article?

AThe drop was primarily caused by heavy leverage and thin liquidity, which led to forced liquidations and a rapid decline in prices.

QHow much in leveraged positions was wiped out during Bitcoin's three liquidation events?

ARoughly $1.3 billion in leveraged positions was wiped out during the three liquidation events over about 12 hours.

QBeyond the crypto market, what other assets experienced significant losses according to Bull Theory?

APrecious metals and equities experienced significant losses, with over $12 trillion wiped out from global markets in 48 hours. Gold fell over 16%, silver nearly 39%, and platinum and palladium dropped sharply.

QWhat key technical indicator did Bitcoin break below for the first time since 2022?

ABitcoin traded below its major moving averages for the first time since 2022, breaking beneath long-term trend lines that often indicate broader market phases.

QWhat investment strategy does the article suggest for conservative investors during this volatile period?

AThe article suggests gradual dollar-cost averaging as the best strategy for conservative investors, holding back some cash and adding exposure slowly during periods of high fear and volatility.

你可能也喜欢

富达Q3报告:BTC、ETH与SOL持续筑底,本轮加密熊市还要走多远?

富达数字资产发布了2026年第三季度加密市场信号报告。报告指出,当前加密市场整体仍处于熊市筑底阶段。 **市场总览:** * **加权NUPL(净未实现盈亏):** 已降至-0.01,表明市场整体略低于盈亏平衡线。仅比特币(BTC)仍录得未实现盈利,以太坊(ETH)和Solana(SOL)均处于亏损状态,BTC起到了市场稳定器的作用。 * **BTC主导率:** 升至68%,资金仍高度集中于BTC,尚未出现向其他数字资产的轮动迹象。 * **资产表现:** BTC、ETH、SOL过去一年及年初至今价格全线下跌,多项指标接近历史投降区间。现货ETP持续净流出,宏观环境及市场情绪构成拖累。 **比特币(BTC):** * **NUPL(0.09):** 处于“希望-恐惧”区间,情绪谨慎。 * **动能信号:** 负面,下跌形成偏空脉冲。 * **Yardstick(算力市盈率):** 正面,接近历史低位,显示BTC相对于网络能源投入可能被低估。参照历史底部周期(约300天),当前约203天的调整可能已走完三分之二,2026年10月是可观察的时间窗口。 * **相对黄金表现:** 负面,但近期跌势趋缓。 * **算力:** 负面,受价格低迷及AI算力资源竞争影响,算力从高点回落。 **以太坊(ETH):** * **NUPL(-0.43):** 处于“投降”区间,但历史显示较低NUPL往往对应较高长期回报。 * **动能信号:** 负面,上涨动能未恢复。 * **使用指标:** 中性,链上活动随价格下跌有所降温。 * **稳定币转账额:** 正面,持续创历史新高,显示真实使用需求增强。 * **网络费用:** 负面,受扩容影响持续下降。 **Solana(SOL):** * **NUPL(-0.72):** 处于“投降”区间,历史波动大。 * **动能信号:** 负面,但短期波动率已高于中期,需关注企稳可能。 * **使用指标:** 正面,链上交易活动在熊市中仍保持韧性并增长。 * **稳定币转账额:** 正面,长期上升趋势完好。 * **网络费用:** 中性,下降趋势可能接近底部。 **总结:** 报告认为,市场正处于寻找底部的修复过程中。BTC凭借其流动性优势相对抗跌,而ETH和SOL承受更大压力。虽然多项指标显示市场情绪低迷且接近历史投降区域,为长期投资者可能提供了有吸引力的入场位置,但全面复苏仍需等待更广泛的市场风险偏好恢复和基本面改善。

marsbit1小时前

富达Q3报告:BTC、ETH与SOL持续筑底,本轮加密熊市还要走多远?

marsbit1小时前

HIVE首席执行官:用于AI的GPU每小时收入比挖矿业务高10倍

加拿大上市公司HIVE首席执行官近期指出,人工智能(AI)计算业务的经济效益已远超比特币挖矿。据其透露,公司部署在曼尼托巴省贝尔加拿大AI基础设施中的504块NVIDIA B200 GPU集群,每小时每GPU收入约2.90美元,而比特币挖矿设备每小时仅产生约0.12美元,前者收益是后者的20倍以上。 基于此,HIVE将下半年战略重点转向更高收益的AI基础设施投资,同时维持其比特币挖矿业务。2026财年,公司比特币平均算力达22.2 EH/s,同比增长290%,占全网算力约3%,共开采2,885枚BTC。全年总收入达2.978亿美元,其中比特币挖矿收入增长164%,而专注于AI与高性能计算(HPC)的BUZZ HPC部门收入为1950万美元,同比增长94%。 HIVE的转型始于三年前对NVIDIA芯片的7000万美元投资,这使其在AI计算需求激增时占据了先机。公司近期获得了Chardan Capital的“买入”评级及7.50美元目标价,并与贝尔及AI初创公司Cohere签署了价值约2.2亿美元的GPU云服务协议,同时通过债券融资7500万美元用于进一步发展AI基础设施。 其最雄心勃勃的项目是多伦多地区在建的320兆瓦AI数据中心,预计2027年下半年全面运营后可容纳超10万块GPU,实现约3.6亿美元的年经常性收入。HIVE并非孤例,竞争对手如MARA、Hut 8和Terawulf也纷纷将有限电力资源转向利润更高的AI与HPC合约,这反映了在比特币挖矿利润缩减的背景下,上市矿企的普遍战略转移。 HIVE的近期目标是在本财年末将AI与HPC业务年收入提升至当前水平的十倍,这很大程度上取决于多伦多数据中心及后续GPU云服务合约能否按时推进。

cryptonews.ru3小时前

HIVE首席执行官:用于AI的GPU每小时收入比挖矿业务高10倍

cryptonews.ru3小时前

交易

现货

热门文章

加密市场宏观研报:《GENIUS Act》法案取得重大进展,BTC突破历史新高,后市全新展望

2025年5月22日,比特币价格正式突破11万美元大关,创下历史新高。在政策面、宏观经济、资金面与投资者结构共同作用下,一场结构性牛市浪潮正在展开。而此轮上涨背后的核心驱动,是美国《GENIUS稳定币法案》的实质性进展以及多项利好的叠加。本文将从政策端突破、宏观环境转向、链上与ETF资金结构、交易行为演化,以及重点受益赛道五大维度,全面解析此轮BTC再创新高的深层逻辑,并前瞻下半年市场的潜在趋势。

1.8k人学过发布于 2025.05.22更新于 2025.05.22

加密市场宏观研报:《GENIUS Act》法案取得重大进展,BTC突破历史新高,后市全新展望

相关讨论

欢迎来到HTX社区。在这里,您可以了解最新的平台发展动态并获得专业的市场意见。以下是用户对BTC(BTC)币价的意见。

活动图片