Ethereum перешел в медвежий тренд после реакции рынка на заседание Федеральной резервной системы (ФРС), но его цена остается стабильной выше уровня в $2100. В условиях медвежьего рынка динамика ETH начинает меняться, поскольку ключевые показатели сигнализируют о возможной ловушке ликвидности на текущих уровнях.
Появляется сигнал о ловушке ликвидности Ethereum
После недавних ценовых движений индикатор в блокчейне вызывает новые опасения относительно Ethereum и его рыночной динамики. Подобные сигналы обычно наблюдаются в периоды волатильности и могут сыграть решающую роль в формировании следующей ценовой траектории альткоинов в краткосрочной перспективе.
Объединив сигналы нескольких метрик, Борис, криптотрейдер и ончейн-аналитик, описал потенциальное формирование ловушки ликвидности для ETH. Хотя ценовая активность на поверхности может казаться стабильной, базовые данные указывают на то, что ликвидность концентрируется таким образом, что может удивить трейдеров.
По мере того как цена ETH приближалась к уровню $2400, дельта «Киты против розницы» продолжала уходить в отрицательную территорию. Этот тренд подчеркивает ключевое расхождение в активности между крупными держателями и мелкими инвесторами на рынке. Проще говоря, крупные держатели или киты сокращают свою относительную активность или экспозицию, в то время как мелкие трейдеры становятся более активными на рынке.
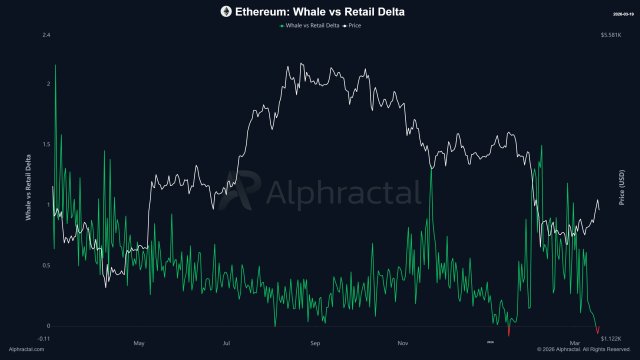
В настоящее время инвесторы-киты закрывают свои длинные позиции в Ethereum и открывают больше коротких позиций. В то же время розничные держатели делают противоположное, агрессивно открывая длинные позиции. Когда институциональные игроки отступают, а вовлеченность розницы растет, этот дисбаланс часто указывает на изменение настроений под поверхностью. Тренд такого рода считается классической иллюзией ликвидности.
Борис отметил, что покупательское давление какое-то время демонстрировало robust strength, но эти покупки были поглощены ликвидностью продавцов. В результате рынок вошел в фазу охлаждения. Исторически сложилось так, что текущая рыночная конфигурация указывает на дальнейшее давление в сторону снижения.
Дополняет рыночный тренд метрика Уровни ликвидации ETH. Данные показывают значительное наращивание длинных позиций за последний месяц с ключевыми целями по ликвидности на уровне $1850 и ниже. В то время как цена движется вверх, рынок явно демонстрирует ослабевающую силу под поверхностью.
ETH закрывает недавний гэп CME
Недавнее ценовое движение Ethereum столкнулось с гэпом CME. Однако CW, рыночный эксперт и инвестор, сообщил, что ведущее движение заполнило гэп, который находился на уровне $2117. Поскольку рынок пытается исправить неэффективности, эти гэпы, часто создаваемые в периоды интенсивных ценовых движений, могут служить магнитами для последующих ценовых действий.
После закрытия гэпа сформировалась стена покупок вокруг $2100, и этот уровень совпадает с уровнем Фибоначчи 0.382. Если после достижения уровня $2100 произойдет отскок, следующей целью будет уровень около $2686, что соответствует урову фибо 0.382. Между тем, если ETH поднимется до этого уровня, будет заполнен еще один гэп CME впереди.