Криптоаналитик утверждает, что история цены Биткоина (BTC) раскрывает последовательную модель макроцикла, характеризующуюся длительными бычьими рынками, за которыми следуют более короткие медвежьи рынки. Эта повторяющаяся структура проявлялась в течение нескольких рыночных циклов и теперь используется для формирования ожиданий относительно текущих и будущих движений цены Биткоина.
Макроциклы Биткоина раскрывают повторяющуюся модель
Макроциклы Биткоина часто служили историческим планом для типичного 4-летнего цикла. На протяжении многих лет BTC формировал ключевые модели и циклические движения, которые служат основой для интерпретации текущих рыночных условий и, в некоторой степени, отслеживания будущего движения цены. На этом фоне псевдонимный криптоаналитик Rekt Fencer представил анализ графиков, выделяя исторические макродлительности Биткоина, которые раскрывают последовательную повторяющуюся структуру, способную помочь предугадать следующий крупный шаг криптовалюты.
Анализ Rekt Fencer восходит к бычьему циклу 2015-2017 годов, когда Биткоин пережил свою первую крупную фазу расширения, движимую глобальной осведомленностью и растущим участием ранних инвесторов. На графике показано, как цены неуклонно росли в течение 1064 дней с 12 января 2015 года, прежде чем достигнуть эйфорического пика 11 декабря 2017 года. Биткоин вырос примерно со $160 до более чем $12 500 в то время, закладывая основу для первого крупномасштабного медвежьего тренда на рынке.
Медвежий рынок 2017-2018 годов отражал последствия спекулятивного избытка, поскольку настроения инвесторов быстро сменились с оптимизма на осторожность. Примерно за 364 дня Биткоин отыграл большую часть своих достижений, упав ниже $3950 и достигнув дна.
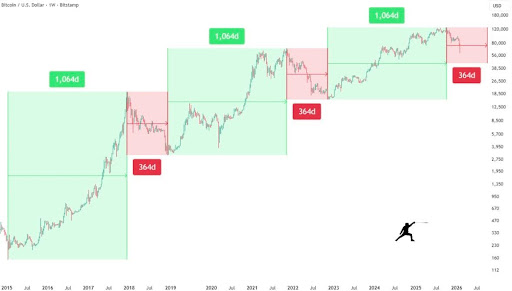
В течение бычьего цикла с 2018 по 2021 год Биткоин пережил более зрелый, институционально обусловленный ралли, длившийся приблизительно 1064 дня. В этот период ведущая криптовалюта получила признание в mainstream-финансах и широкое распространение. Ажиотаж во время этого цикла поднял цену BTC с отметки ниже $3950 10 декабря 2018 года до прежнего ATH (исторического максимума) свыше $60 000 8 ноября 2021 года.
Медвежий рынок, последовавший за этим циклом, длился приблизительно 364 дня, с 8 ноября 2021 года по 7 ноября 2022 года. Этот спад последовал за серией провалов известных криптокомпаний и сменой настроений, что привело к падению Биткоина ниже $18 500 с его ATH.
Главный фактор, который выделяется в анализе Rekt Fencer, — это последовательность в продолжительности фаз рынка Биткоина. Каждый бычий цикл длился 1064 дня, за которым следовала 364-дневная коррекция. Основываясь на этой модели, аналитик предполагает, что текущий цикл может развиваться по схожему графику.
Где находится рынок в текущем цикле
Согласно графику Rekt Fencer, бычий цикл с 2022 по 2025 год официально завершился и сейчас находится в фазе медвежьего рынка. Цикл также длился 1064 дня, при этом цена BTC пересекла отметку в $126 000 6 октября 2025 года. Теперь, когда криптовалюта находится на медвежьем рынке, Rekt Fencer предсказывает, что он также может продлиться 364 дня с 6 октября 2025 года по 5 октября 2026 года. В течение этого времени ожидается, что BTC достигнет дна около $38 500, что ознаменует падение примерно на 40% от текущих уровней выше $69 000.