Odaily приглашенный аналитик рынка Conaldo, магистр финансовой статистики Колумбийского университета (США), со времен университета специализируется на количественной торговле акциями США и постепенно расширяет свою деятельность до цифровых активов, таких как биткоин; на практике разработал систематическую модель количественной торговли и систему управления рисками; обладает острым пониманием данных рыночной волатильности и стремится к постоянному углублению в профессиональную торговлю,追求稳健回报; будет еженедельно глубоко анализировать технические, макроэкономические и денежные аспекты BTC, проводить разборы и демонстрировать практические стратегии, а также анонсировать важные события на ближайшее время для справки.

Ключевые выводы:
• С макротехнической точки зрения (см. Рис. 3 ниже): На дневном графике биткоина восходящая линия тренда (с конца 2022 года), представляющая долгосрочный бычий рынок, и нисходящая линия тренда (с максимума октября 2025 года), определяющая недавнюю коррекцию, вот-вот сойдутся. В настоящее время рынок находится в периоде восстановительных колебаний после пробоя долгосрочного тренда, цена биткоина находится под двойным давлением, и до тех пор, пока цена не прорвется выше этого двойного давления с сильным объемом, все восходящие движения следует рассматривать лишь как отскоки в рамках медвежьей структуры. Окончательным критерием для определения среднесрочного выбора направления рынка будет являться эффективный пробой этих двух ключевых линий тренда.
• Подтверждение основной идеи: Основной вывод, предложенный на прошлой неделе, о том, что «рынок, вероятно, перейдет в режим корректирующих колебаний»,高度一致 с фактическим движением рынка. Медведи и быки反复 боролись за区域 87,500~89,000 долларов, при этом минимум коррекции в середине недели 84,456 долларов имел относительную погрешность около 1.18% по сравнению с верхней границей预测支撑区域 83,500 долларов.
• Подтверждение эффективности выполнения стратегии: Торговля на прошлой неделе строго следовала установленной стратегии, было успешно выполнено четыре операции,累计实现收益 2.14%.
Далее следует подробный обзор прогноза行情, выполнения стратегии и具体交易过程.
一、Обзор行情 биткоина за прошлую неделю (15.12~21.12)
1、回顾上周走势预测与操作策略:
В前瞻分析 на прошлой неделе было четко указано: 行情将大概率转入震荡调整格局. При этом区域 87,500~89,000 долларов был определен как ключевая зона наблюдения, результат борьбы между быками и медведями в которой будет напрямую определять краткосрочный выбор направления рынка. Особое внимание уделялось тому, что если эта区域 будет эффективно пробита, это также напрямую повлияет на силу и глубину последующей коррекции цены. Ниже приведены复盘 стратегии и解析.
1、回顾行情走势预测:
• Ключевые уровни сопротивления: Первое сопротивление в区域 92,500~94,500 долларов; второе сопротивление в区域 96,500~98,500 долларов.
• Ключевые уровни поддержки: Первая поддержка в区域 87,500~89,000 долларов; вторая поддержка в区域 80,000~83,500 долларов.
2、回顾操作策略:
• Среднесрочная стратегия: Поддержание средней позиции (короткой) на уровне около 65%.
• Краткосрочная стратегия: Для应对行情走势 мы предварительно разработали два варианта краткосрочных操作预案 A/B. В соответствии с фактическим развитием рынка мы最终 приняли 方案B в качестве核心 стратегии и выполнили ее.
• Открытие позиции: Если цена跌破 区域 87,500~89,000 долларов и это подтвердится,建立 30% короткой позиции.
• Управление рисками: Стоп-лосс установлен выше 89,000 долларов.
• Закрытие позиции: Когда цена下探至区域 80,000~83,500 долларов и出现抵抗,清仓 все короткие позиции,获利了结.
2、На прошлой неделе в соответствии с установленным планом было успешно выполнено четыре краткосрочных операции (Рис. 1),累计实现收益 2.14%. Конкретные交易明细 и复盘如下:
График биткоина с 30-минутными свечами: (Модель количественного анализа импульса + Модель торговли по спреду)
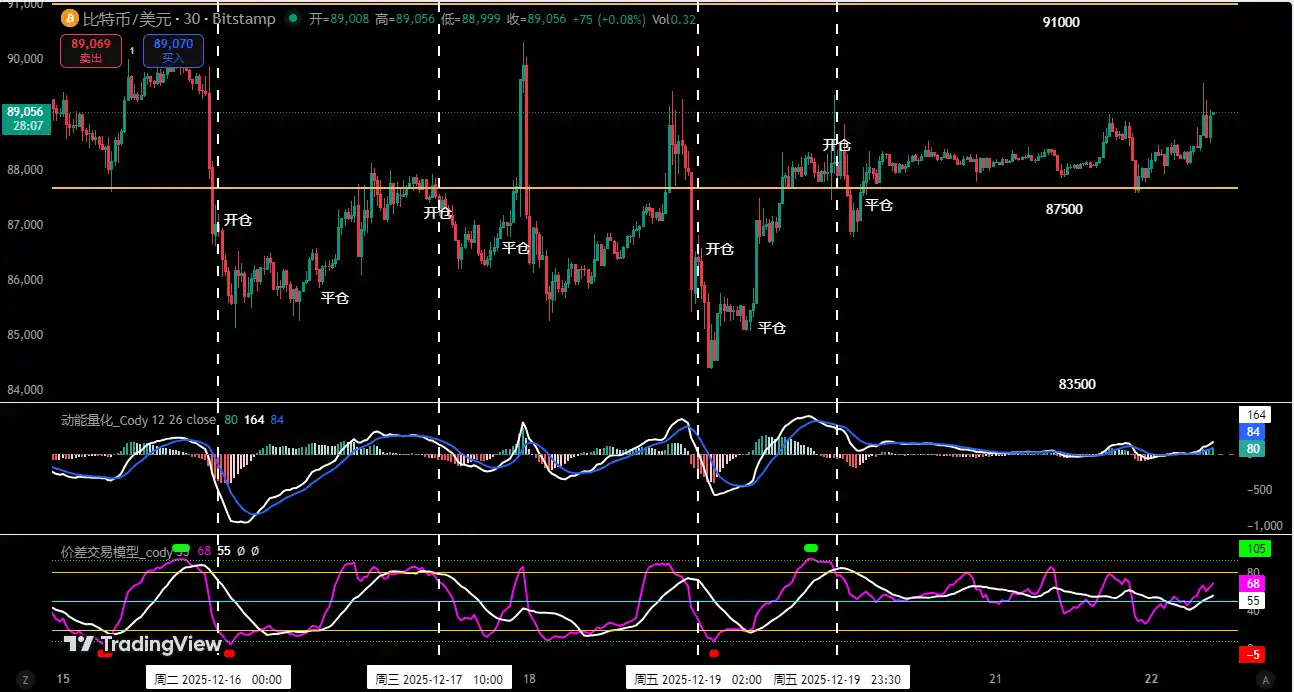
Рисунок 1
1、Сводка деталей сделок:
2、复盘 краткосрочных сделок:
• Первая сделка (прибыль 0.73%): Мы строго придерживались идеи «открывать короткие позиции по тренду при эффективном пробитии ключевых точек». Когда行情 сработал, модель торговли по спреду одновременно выдала сигнал на вершине, на основании этого мы果断建立 30% короткую позицию и в最终获利了结, когда цена回落至区域 поддержки near前低.
• Вторая и третья сделки (累计 прибыль 1.41%): Основаны на模式操作 «продавать на сопротивлении при отскоке к ключевой区域 сопротивления». Когда цена冲击区域 87,500~89,000 долларов и встретила сопротивление,叠加共振ные сигналы от двух моделей, эти две сделки были успешно завершены.
• Четвертая сделка (прибыль 0): Логика открытия этой позиции была такой же, как и у предыдущих двух сделок. Особо следует подчеркнуть, что в этой сделке мы строго соблюдали принцип «немедленно переместить стоп-лосс на цену открытия позиции, когда плавающая прибыль достигает 1%», что привело к最终 закрытию этой сделки с нулевым результатом.
二、Количественно-технический анализ: Операции на основе множественных моделей и измерений
Объединяя运行 рынка на прошлой неделе, автор проведет углубленный анализ эволюции внутренней структуры биткоина с помощью комплексных многомерных аналитических моделей.
График биткоина с недельными свечами: (Модель количественного анализа импульса + Модель количественного анализа настроений)
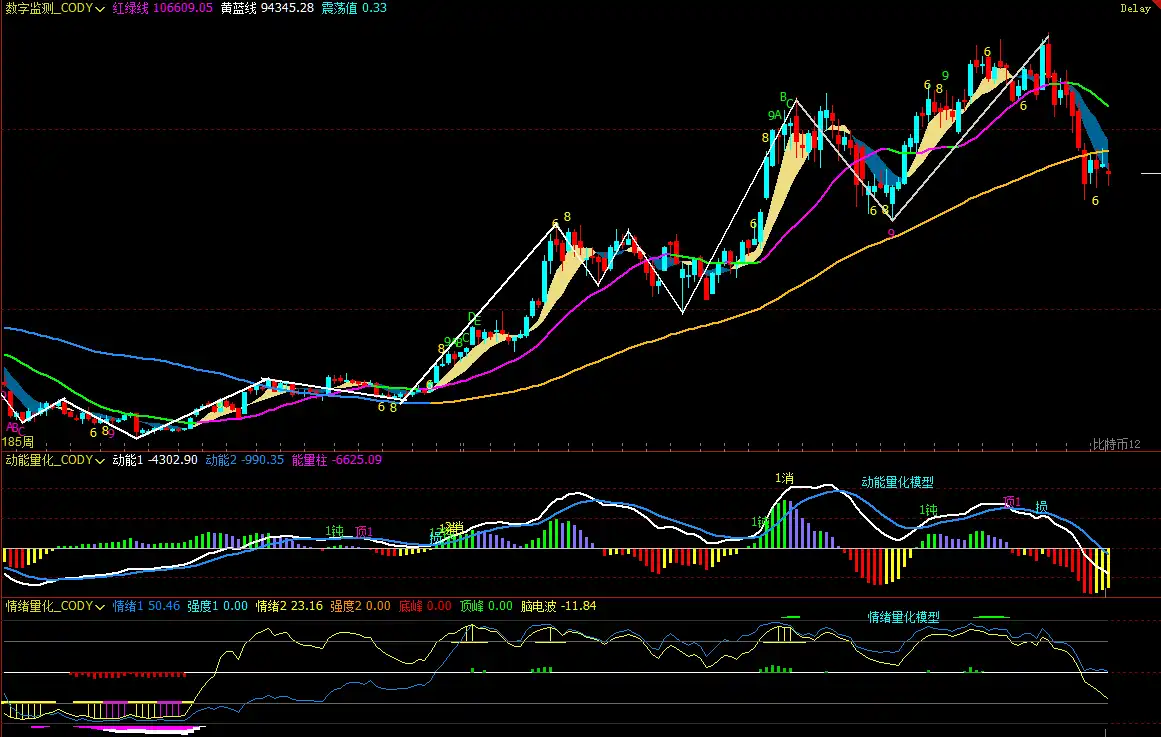
Рисунок 2
1、Как показано на (Рис. 2), анализ на недельном графике:
• Модель количественного анализа импульса: После коррекции на прошлой неделе две линии индикатора импульса продолжают работать ниже нулевой оси. Хотя восстановление в течение предыдущих недель не привело к значительному увеличению отрицательного столбца импульса, текущая рыночная структура остается слабой, необходимо警惕 рисков дальнейшего высвобождения давления коррекции.
Модель количественного анализа импульса预示: Индекс падения цены: Высокий
• Модель количественного анализа настроений: Синяя линия настроений имеет значение 50.46, интенсивность ноль; желтая линия настроений имеет значение 23.16, интенсивность ноль, пиковое значение 0.
Модель количественного анализа настроений预示: Индекс давления и поддержки цены: Нейтральный
• Модель цифрового мониторинга: На графике видно, что цена跌破 линию раздела быков и медведей (желто-синяя линия) уже 5 недель, вероятность эффективного пробития увеличивается. Краткосрочные цифровые сигналы дна (9 и выше) еще не появились.
Вышеуказанные данные预示: Биткоин находится в нисходящем тренде, на недельном таймфрейме вошел в медвежий рынок,警惕 рисков коррекции.
Дневной график биткоина:
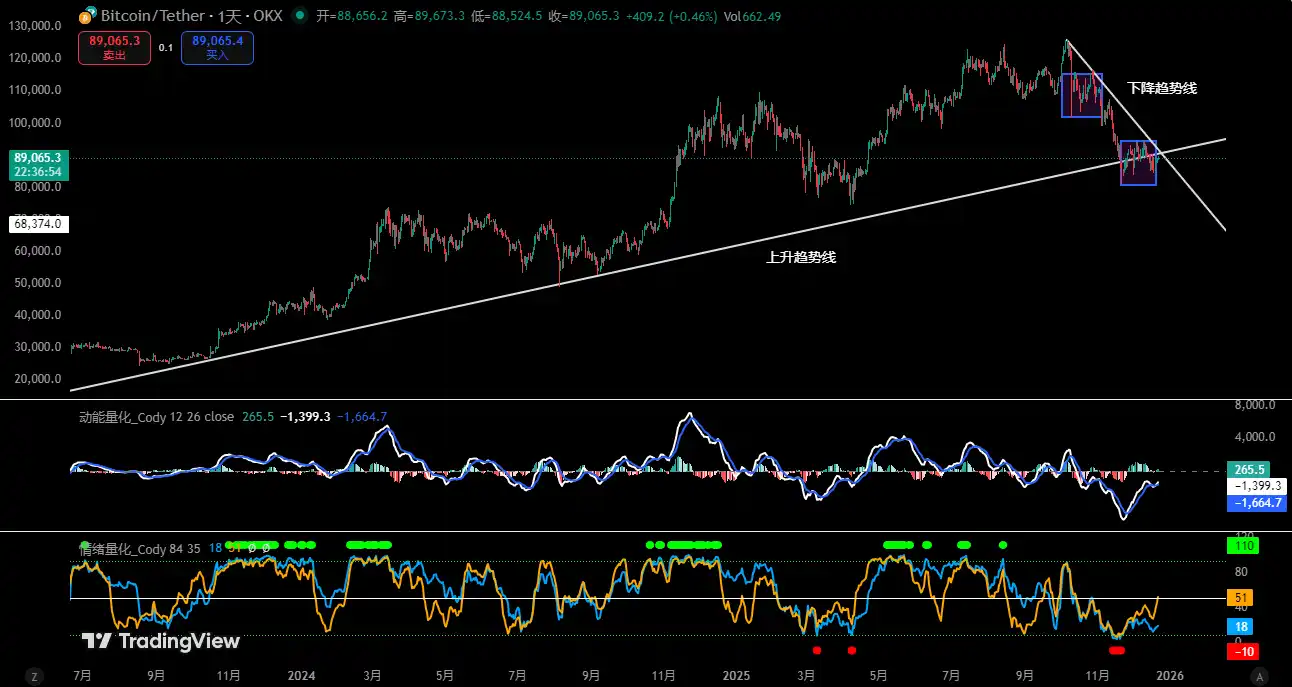
Рисунок 3
2、Как показано на (Рис. 3), анализ на дневном графике:
• Модель количественного анализа импульса: На прошлой неделе две линии импульса ниже нулевой оси прошли через反复交叉 процесс «золотой крест—мертвый крест—золотой крест», объем торговли не увеличился, рост положительных столбцов импульса не был заметным.
Модель количественного анализа импульса预示: Быки и медведи激烈 борются за контроль над рынком, импульс покупок слаб.
• Модель количественного анализа настроений: После закрытия прошлой недели синяя линия настроений имеет значение 17, интенсивность ноль; желтая линия настроений имеет значение 45, интенсивность ноль.
Модель количественного анализа настроений预示: Индекс давления и поддержки: Нейтральный
Вышеуказанные данные提示: На дневном таймфрейме находится в медвежьем рынке, краткосрочные движения рынка будут反复.
三、Прогноз行情 на эту неделю (22.12~28.12)
1、Ожидается, что на этой неделе рынок в основном будет呈现格局 широкого диапазона колебаний. Ключевой观察区间 - 89,500~91,000 долларов, результат борьбы в этой区域 будет определять краткосрочное направление:
• Если эффективно跌破: Это будет означать усиление силы коррекции,预计 масштаб коррекции扩大,周期 также相应延长.
• Если эффективно站稳: Тогда рынок有望 продолжить колебательное восстановление,但预计 пространство для восстановления будет相对有限.
2、Ключевые уровни сопротивления:
• Первая зона сопротивления: 89,500~91,000 долларов
• Вторая зона сопротивления: 93,000~94,500 долларов
• Важная зона сопротивления: Около 97,000 долларов
3、Ключевые уровни поддержки:
• Первый уровень поддержки: 86,500~87,500 долларов
• Второй уровень поддержки: 83,500~84,500 долларов
• Важный уровень поддержки: Около 80,000 долларов.
四、Операционная стратегия на эту неделю (исключая влияние внезапных новостей)(22.12~28.12)
1、 Среднесрочная стратегия: Поддержание средней позиции (короткой) на уровне около 65%.
2、 Краткосрочная стратегия: Использование 30% капитала, установка стоп-лосса, поиск возможностей для «спреда» на основе уровней поддержки и сопротивления. (В качестве操作周期 использовать 30-минутный таймфрейм).
3、 Ключевое наблюдение за борьбой быков и медведей за区域 89,500~91,000 долларов и ее результатом. Для应对行情 рынка мы拟定 два варианта краткосрочных操作预案 A/B:
• 方案A: Если эта区域 эффективно站稳:
• Открытие позиции: Если цена отскочит к区域 93,000~94,500 долларов и出现 сопротивление,建立 30% короткую позицию.
• Управление рисками: Стоп-лосс для короткой позиции установить выше 96,000 долларов.
• Закрытие позиции: Когда цена下跌至区域 89,500~91,000 долларов и出现抵抗,清仓 все короткие позиции,获利了结.
• 方案B: Если эта区域 будет эффективно跌破:
• Открытие позиции: Если цена跌破 эту区域 и это подтвердится,建立 30% короткую позицию.
• Управление рисками: Стоп-лосс установить выше 92,000 долларов.
• Закрытие позиции: Когда цена下探至区域 83,500~84,500 долларов и出现抵抗,考虑 частично или полностью清仓,获利了结.
五、Особые указания
1. При открытии позиции: Немедленно установить初始 стоп-лосс.
2. Когда прибыль достигнет 1%: Переместить стоп-лосс на цену открытия позиции (точка безубыточности), чтобы защитить本金.
3. Когда прибыль достигнет 2%: Переместить стоп-лосс на уровень прибыли 1%.
4. Постоянное отслеживание: После этого, когда цена每再 приносит 1% прибыли, стоп-лосс同步移动 на 1%, динамически защищая и фиксируя已有 прибыль.
(Примечание: Вышеуказанный порог прибыли в 1% инвесторы могут гибко调整 в соответствии с собственными风险 предпочтениями и волатильностью актива.)
六、Макроперспектива на неделю и ключевые события (22.12~28.12|Рождественская неделя)
1. Рождественские праздники сокращают торговые сессии, ликвидность значительно снижается
На этой неделе американские акции закроются раньше в среду и будут закрыты в четверг. Фактор праздников в сочетании с расчетами в конце года приводит к偏低 ликвидности на рынке в整体, цены更容易 двигаться под влиянием и односторонним капиталом,需警惕 «ложных пробоев» и усиления краткосрочной волатильности в условиях низких объемов.
2. Ожидания назначения председателя ФРС升温, преемственность политики в центре внимания рынка
Рынок следит, объявит ли Трамп кандидатуру следующего председателя ФРС во время рождественских праздников. В настоящее время вероятность назначения Кевина Хассетта (Kevin Hassett)明显领先, его политическая позиция рассматривается как склонная к «предсказуемым постепенным调整».
(Если назначение состоится, это в краткосрочной перспективе поможет стабилизировать ожидания по ставкам и风险偏好; если появится неожиданный кандидат, это может вызвать этапную волатильность ставок и доллара.)
3. Завершение данных по третьему кварталу в США, проверка нарратива «мягкой посадки»
Пересмотренные данные по ВВП США за третий квартал, личным потребительским расходам и базовому PCE, которые будут опубликованы во вторник, будут использованы для подтверждения устойчивости экономики и пути инфляции, соответствуют ли они предыдущим оценкам.
(Если данные будут умеренно пересмотрены, рынку будет легче维持定价 пути снижения ставок на следующий год; если будет значительный пересмотр вверх, это может снова поднять долгосрочные ставки.)
4. Данные по занятости как маржинальный观察 показатель в конце года
Количество первичных заявок на пособие по безработице, публикуемое в среду, хотя и не имеет趋势 значения, но до и после праздников остается вспомогательным сигналом для наблюдения за ослаблением на рынке труда.
(В настоящее время более склонно к «стабильности, а не ухудшению», влияние на рынок预计有限.)
5. Динамика Банка Японии provides参考 глобальной ликвидности
Выступление управляющего Банка Японии Кадзуо Уэды и данные по безработице за ноябрь продолжат влиять на判断 рынка относительно темпов нормализации денежно-кредитной политики Японии.
(Если волатильность иены усилится, это может вызвать эмоциональные扰动 на глобальных风险 активах, особенно на американских акциях и加密 рынке.)
Финансовые рынки瞬息万变, все анализ行情 и交易策略 требуют динамической调整. Все观点, аналитические модели и операционные стратегии,涉及 в данной статье, основаны на личном техническом анализе, предназначены только для личного торгового журнала и не являются инвестиционной рекомендацией или основанием для действий. На рынке есть风险, инвестиции требуют осторожности, DYOR.


