Odaily приглашенный аналитик рынка Conaldo, магистр финансовой статистики Колумбийского университета (США). Со времен университета специализируется на количественной торговле акциями США, постепенно расширяя деятельность до биткоина и других цифровых активов. На практике построил систематизированную модель количественной торговли и систему управления рисками; обладает острым пониманием данных о рыночной волатильности и стремится к постоянному углублению знаний в области профессиональной торговли, добиваясь стабильной доходности. Еженедельно будет глубоко анализировать изменения в технических, макроэкономических аспектах и движении капитала BTC, проводить разбор и демонстрировать практические стратегии, а также анонсировать важные предстоящие события для вашего сведения.

Ключевые выводы торгового недельного отчета:
• Исполнение стратегии (краткосрочная): На прошлой неделе торговля строго следовала установленной стратегии, была проведена одна краткосрочная операция (плечо 1x) с доходностью -1.07%. (Подробности на Рис. 1)
• Подтверждение ключевой точки зрения (краткосрочная): Ключевая точка зрения, выдвинутая на прошлой неделе, была точно подтверждена рынком. На прошлой неделе цена монеты пробила важный диапазон сопротивления $94,500~$95,000, и в настоящее время подтверждается его действенность. Максимальная цена достигла $97,963, что отличается от данной нами нижней границы зоны сопротивления $97,500 менее чем на 0.5%, что вновь подтверждает наши способности к определению ключевых уровней.
• Прогноз на ближайшие недели: Собирается ли Биткоин перейти от медвежьего рынка к бычьему? Является ли текущий рынок отскоком или разворотом? 21-недельная скользящая средняя в ближайшем будущем может стать разделительной линией между быками и медведями. (Подробное объяснение на Рис. 4)
Далее следует подробный обзор прогноза行情, исполнения стратегии и конкретного торгового процесса.
I. Обзор行情 Биткоина за прошлую неделю (12.01~18.01)
1、Обзор краткосрочных операций за прошлую неделю: Как показано на (Рис. 1)
Мы строго следовали торговым сигналам, полученным от нашей собственной модели торговли на спредах и количественной модели импульса,并结合 прогнозом рыночного тренда, провели одну краткосрочную операцию. Данная сделка принесла убыток в 1.07%.
Конкретные детали сделки и разбор如下:
График Биткоина с 30-минутными свечами: (Количественная модель импульса + Модель торговли на спредах)
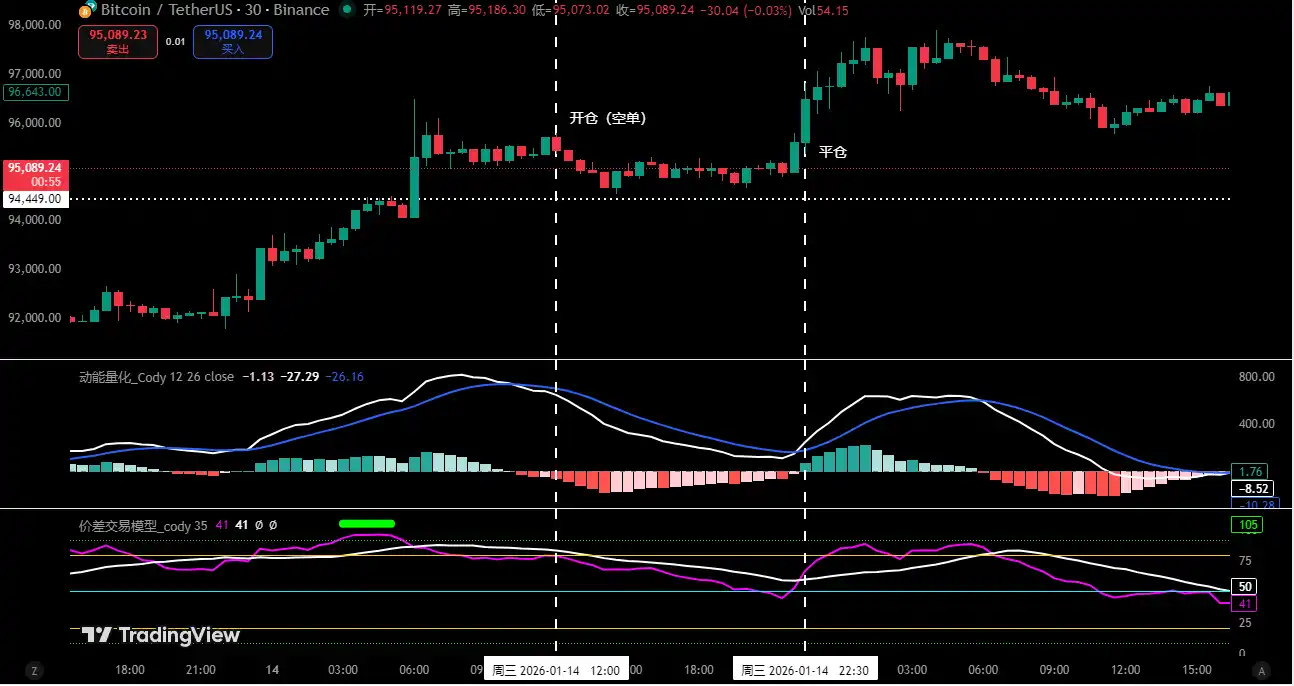
Рисунок 1
1、Сводка деталей сделки: (Без плеча)

2、Разбор краткосрочной сделки:
• Первая сделка (Убыток 1.07%): Данная операция выполнялась по стратегии Вариант A (Продажа на сопротивлении у уровня сопротивления): Когда цена поднялась до ключевого диапазона сопротивления $94,500~$95,000 и появились сигналы сопротивления, одновременно модель торговли на спредах также triggered сигнал вершины (зеленая точка),形成 двойное подтверждение. Поэтому мы по плану открыли 30% короткую позицию по цене $95,460; Однако, движение рынка отклонилось от ожиданий, и вместо этого цена нашла поддержку near $94,500 и развернулась в рост. Когда количественная модель импульса и модель торговли на спредах вновь triggered сигнал дна, мы немедленно закрыли позицию с止损ом по цене $96,493. Хотя данная сделка принесла убыток, мы строго следовали операционной дисциплине «Сделка по触发у сигнала, приоритет управления рисками», добившись единства знания и действия.
2、Обзор прогноза движения и операционной стратегии на прошлой неделе:
1、На прошлой неделе четко указывалось: Сохранять колебания в диапазоне $84,000~$94,500, внимательно наблюдать за выбором направления и действенностью на обоих концах диапазона.
2、Обзор ключевых уровней: Уровень сопротивления смотреть в области $94,500~$95,000, важный уровень сопротивления смотреть near $97,500~$99,500; поддержка смотреть в области $89,500~$91,000.
2、Обзор операционной стратегии:
• Среднесрочная стратегия: Если цена успешно пробивает и закрепляется above $94,500, закрыть все среднесрочные позиции (шорты), держать монеты и наблюдать.
• Краткосрочная стратегия: Если сохраняются колебания в диапазоне $84,000~$94,500,则 выполнять операции по Варианту A:
• Открытие позиции: При отскоке до области $94,500~$95,000 и в сочетании с сигналом вершины модели, можно открыть 30% короткую позицию.
• Управление рисками: Начальный止损 для шорта устанавливается approximately на 1.5% above цены входа (т.е. 1.015*цена входа).
• Закрытие позиции: При снижении до near ключевого уровня поддержки и в сочетании с сигналами модели, можно постепенно закрывать позицию и фиксировать прибыль.
II. Анализ структуры движения Биткоина с технической точки зрения: Комплексное исследование на основе множественных моделей и измерений
Совмещая с рыночной динамикой, автор на основе собственной торговой системы проводит глубокий анализ структуры движения Биткоина с等多方面, таких как множественные модели и измерения.
График Биткоина с недельными свечами: (Количественная модель импульса+Количественная модель настроений)
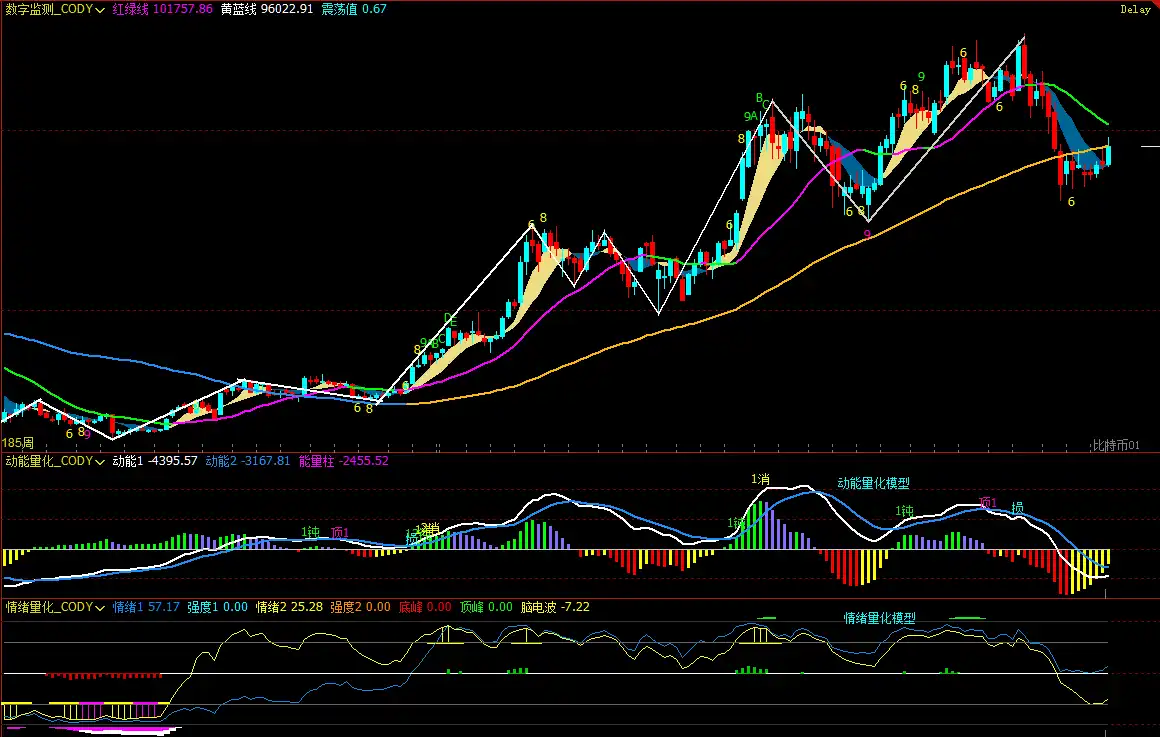
Рисунок 2
1、Как показано на (Рис. 2), анализ на недельном графике:
• Количественная модель импульса: Технические индикаторы показывают, что, продолжая форму предыдущих недель, линии импульса постепенно сближаются, одновременно столбики отрицательной энергии持续 сжимаются. Однако, текущие сигналы не подтверждают разворот медвежьего тренда.
Количественная модель импульса предвещает: Индекс падения цены: Высокий
• Количественная модель настроений: Значение синей линии настроений 57.17, интенсивность ноль; значение желтой линии настроений 25.28, интенсивность ноль, пиковое значение 0.
Количественная модель настроений предвещает: Индекс давления и поддержки цены: Нейтральный
• Цифровая мониторинговая модель: Цена пробила линию раздела быков/медведей (желто-синяя линия) 9 недель назад. На прошлой неделе быки вновь атаковали эту линию, закрытие near линии.
Цифровая мониторинговая модель предвещает: Сигналы мониторинга (вершины/дна) не появились; недельная свеча закрылась средняя бычья свеча, прирост approximately 2.92%.
Вышеуказанные данные предвещают: Недельный медвежий тренд Биткоина, необходимо остерегаться рисков корректировки колебаний.
График Биткоина с дневными свечами: (Количественная модель импульса+Количественная модель настроений)
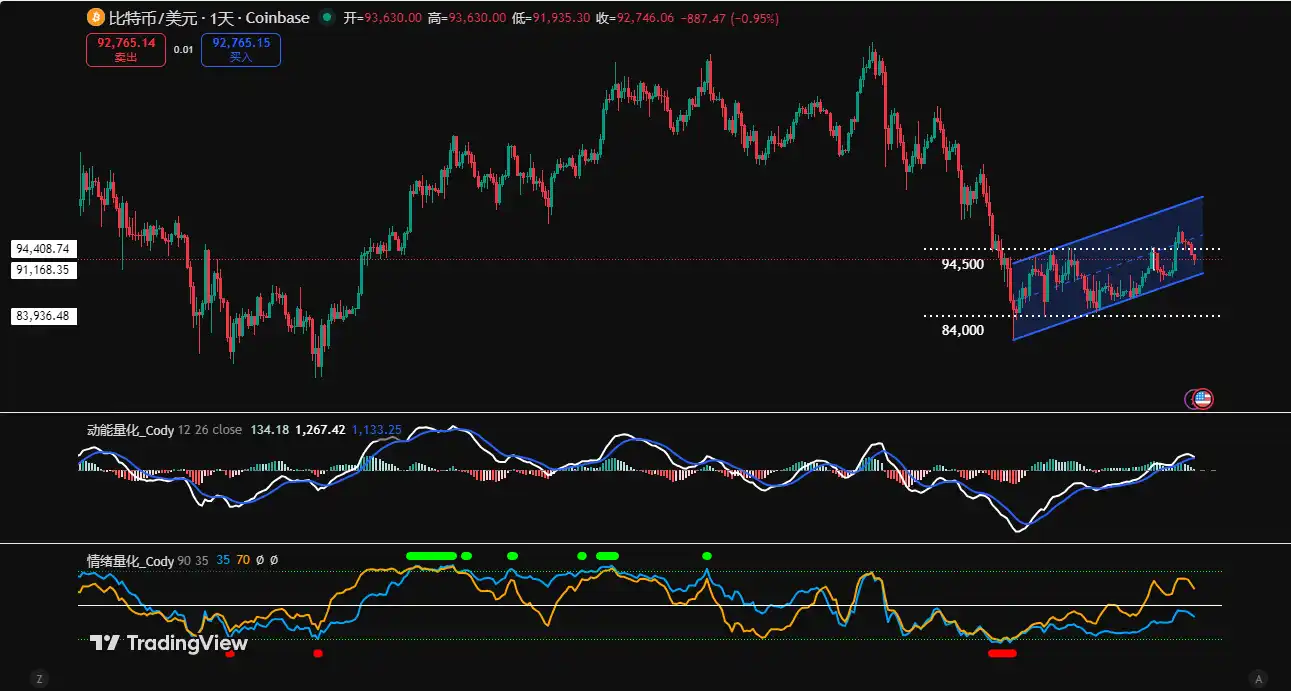
Рисунок 3
2、Как показано на (Рис. 3), анализ на дневном графике:
• Количественная модель импульса: На прошлой неделе в целом呈现走势 «сначала рост, затем спад». В первой половине недели цена ускорила отскок, линия импульса встала above нулевой оси, столбики положительной энергии быстро увеличивались; но во второй половине столбики энергии明显 сжались, линии импульса вновь趋于 слипания, начали медленно приближаться к нулевой оси.
Количественная модель импульса предвещает: Дневная энергия покупок показывает истощение, следить за得失 нулевой оси.
• Количественная модель настроений: После закрытия прошлой недели значение синей линии настроений 38, интенсивность ноль; значение желтой линии настроений 76, интенсивность ноль.
Количественная модель настроений предвещает: Индекс давления и поддержки: Нейтральный
Вышеуказанные данные提示: Дневной отскок продолжается, рынок初次 показывает бычью структуру, но действенность还需要 подтверждения, далее ключевое внимание на борьбу быков и медведей за нулевую ось.
III. Прогноз на текущую неделю: (19.01~25.01)
1、Ключевая точка зрения недели: Ключевое внимание на得失 области $94,500~$95,000.
• Сопротивление действенно: Если цена отскочит до этой области и подтвердит давление,预计 сохранит колебания в диапазоне $84,000~$94,500, последующая首要 цель тестирования - область $89,500~$91,000.
• Прочное закрепление: Если сможет сильно закрепиться в этой области,则 цена有望 колебательно отскакивать,但 высота ограничена.
2、Ключевые уровни сопротивления:
• Первая зона сопротивления: $94,500~$95,000 (Верхний край предыдущего боковика)
• Вторая зона сопротивления: $97,500~$99,500 (Центр колебаний предыдущего периода)
• Важный уровень сопротивления: $102,000 near (Near 21-недельной скользящей средней)
3、Ключевые уровни поддержки:
• Первый уровень поддержки: $89,500~$91,000 (Зона плотных сделок предыдущего периода)
• Второй уровень поддержки: $86,000~$86,500 (Важный уровень поддержки предыдущего периода)
• Важный уровень поддержки: $84,000 near (Нижний край предыдущего боковика)
IV. Операционная стратегия на текущую неделю (исключая влияние внезапных новостей): (19.01~25.01)
1、 Среднесрочная стратегия: Пустая позиция, движение行情 может быть колебательным и повторяющимся, временно держать монеты и наблюдать.
2、 Краткосрочная стратегия: Использовать 30% объема позиции, установить точки止损, на основе уровней поддержки и сопротивления искать возможности для «спреда» сделок). (В качестве операционного цикла использовать 30 минут).
3、 В операциях ключевое внимание на得失 области $94,500~$95,000. Для динамичного реагирования на рыночные изменения и结合 сигналов модели в реальном времени, мы拟定 две краткосрочные операционные预案 A/B:
• Вариант A: Если цена закрепится в области $94,500~$95,000:
• Открытие позиции: После пробития цены области $94,500~$95,000 появляются сигналы стабилизации и в сочетании с сигналами дна модели, можно открыть 30% длинную позицию.
• Управление рисками: Начальный止损 для лонга устанавливается approximately на 1.5% below цены входа (т.е. 0.985*цена входа).
• Закрытие позиции: При отскоке до near ключевого уровня сопротивления и в сочетании с сигналами модели, можно постепенно закрывать позицию и фиксировать прибыль.
• Вариант B: Если цена эффективно провалится below области $94,500~$95,000:
• Открытие позиции: Если отскок до этой области подтвердит эффективность провала, можно открыть 30% короткую позицию.
• Управление рисками: Начальный止损 для шорта устанавливается approximately на 1.5% above цены входа (т.е. 1.015*цена входа).
• Закрытие позиции: При снижении до near $86,500 и в сочетании с сигналами модели, можно постепенно закрывать позицию и фиксировать прибыль.
График Биткоина с недельными свечами: Сравнительный анализ структур исторического движения行情 (Ноябрь 2021 VS Октябрь 2025)
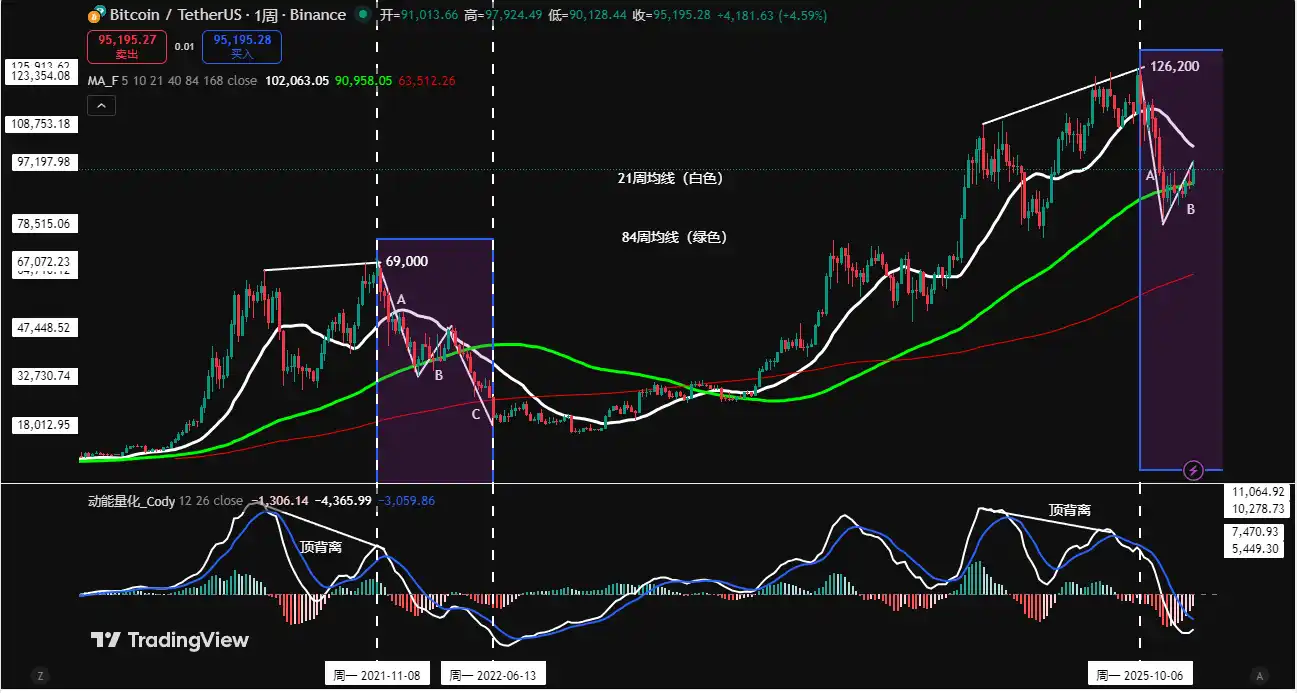
Рисунок 4
Примечание: На рисунке above, 21-недельная скользящая средняя (белая), 84-недельная скользящая средняя (зеленая)
V. Как повторится история? Сравнение сходств и различий двух раундов корректировки на недельном уровне и выводы:
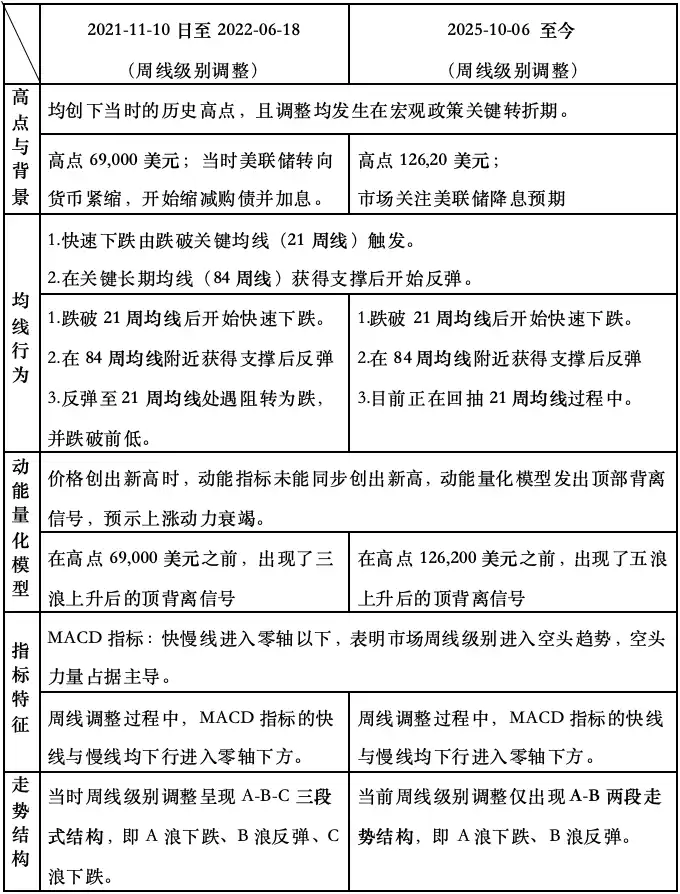
В综上所述, можно выделить следующие ключевые выводы:
1、Текущий недельный уровень находится в медвежьем тренде, что ограничивает пространство дневного отскока.
2、В ближайшие недели, сможет ли цена эффективно пробить и закрепиться above 21-недельной скользящей средней станет фокусом внимания рынка. Если при отскоке цены к этой средней не сформируется эффективного пробития, рынок может повторить格局 исторической корректировки,甚至 провалиться below отметки $80,000.
3、Сможет ли недельный индикатор MACD показать сигналы остановки падения и стабилизации, и линия импульса эффективно пересечет нулевую ось upward, станет ключевым依据 для определения, развернулся ли рыночный тренд.
VI. Особое примечание:
1. При открытии позиции: Немедленно установить начальный уровень止损.
2. При достижении прибыли 1%: Переместить уровень止损 на цену открытия позиции (точка безубыточности), обеспечив безопасность основного капитала.
3. При достижении прибыли 2%: Переместить уровень止损 на позицию с прибылью 1%.
4. Постоянное отслеживание: Впоследствии при каждой дополнительной прибыли цены на 1%, уровень止损同步 перемещать на 1%, динамично защищая и фиксируя прибыль.
Финансовые рынки瞬息万变, все анализ行情 и торговые стратегии требуют динамичной корректировки. Все точки зрения, аналитические модели и операционные стратегии, затронутые в данной статье, основаны на личном техническом анализе, предназначены только для личного торгового журнала и не являются инвестиционной рекомендацией или основанием для действий. Рынок имеет риски, инвестиции требуют осторожности, DYOR (проводи собственное исследование).