Bitcoin вернулся к уровню $70 000 и теперь тестирует сопротивление в районе $74 000, сигнализируя о возобновлении силы после нескольких недель волатильных ценовых движений. Недавний рост говорит о том, что покупатели вновь берут контроль, поскольку настроения на рынке начинают улучшаться, и трейдеры внимательно следят, сможет ли BTC сохранить импульс выше этой критической зоны сопротивления.
Помимо ценового графика, данные рынка деривативов начинают отражать заметное структурное изменение. По словам ведущего аналитика Акселя Адлера, Интегрированный рыночный индекс Bitcoin, модель, предназначенная для измерения совокупного давления со стороны рынка деривативов, недавно снова перешел в бычий режим.
Индикатор работает по шкале от 0 до 100 и объединяет нормализованные метрики цен и потоков на фьючерсном рынке. Значения выше 55 обычно указывают на бычий режим, а значения ниже 45 предполагают медвежьи условия.
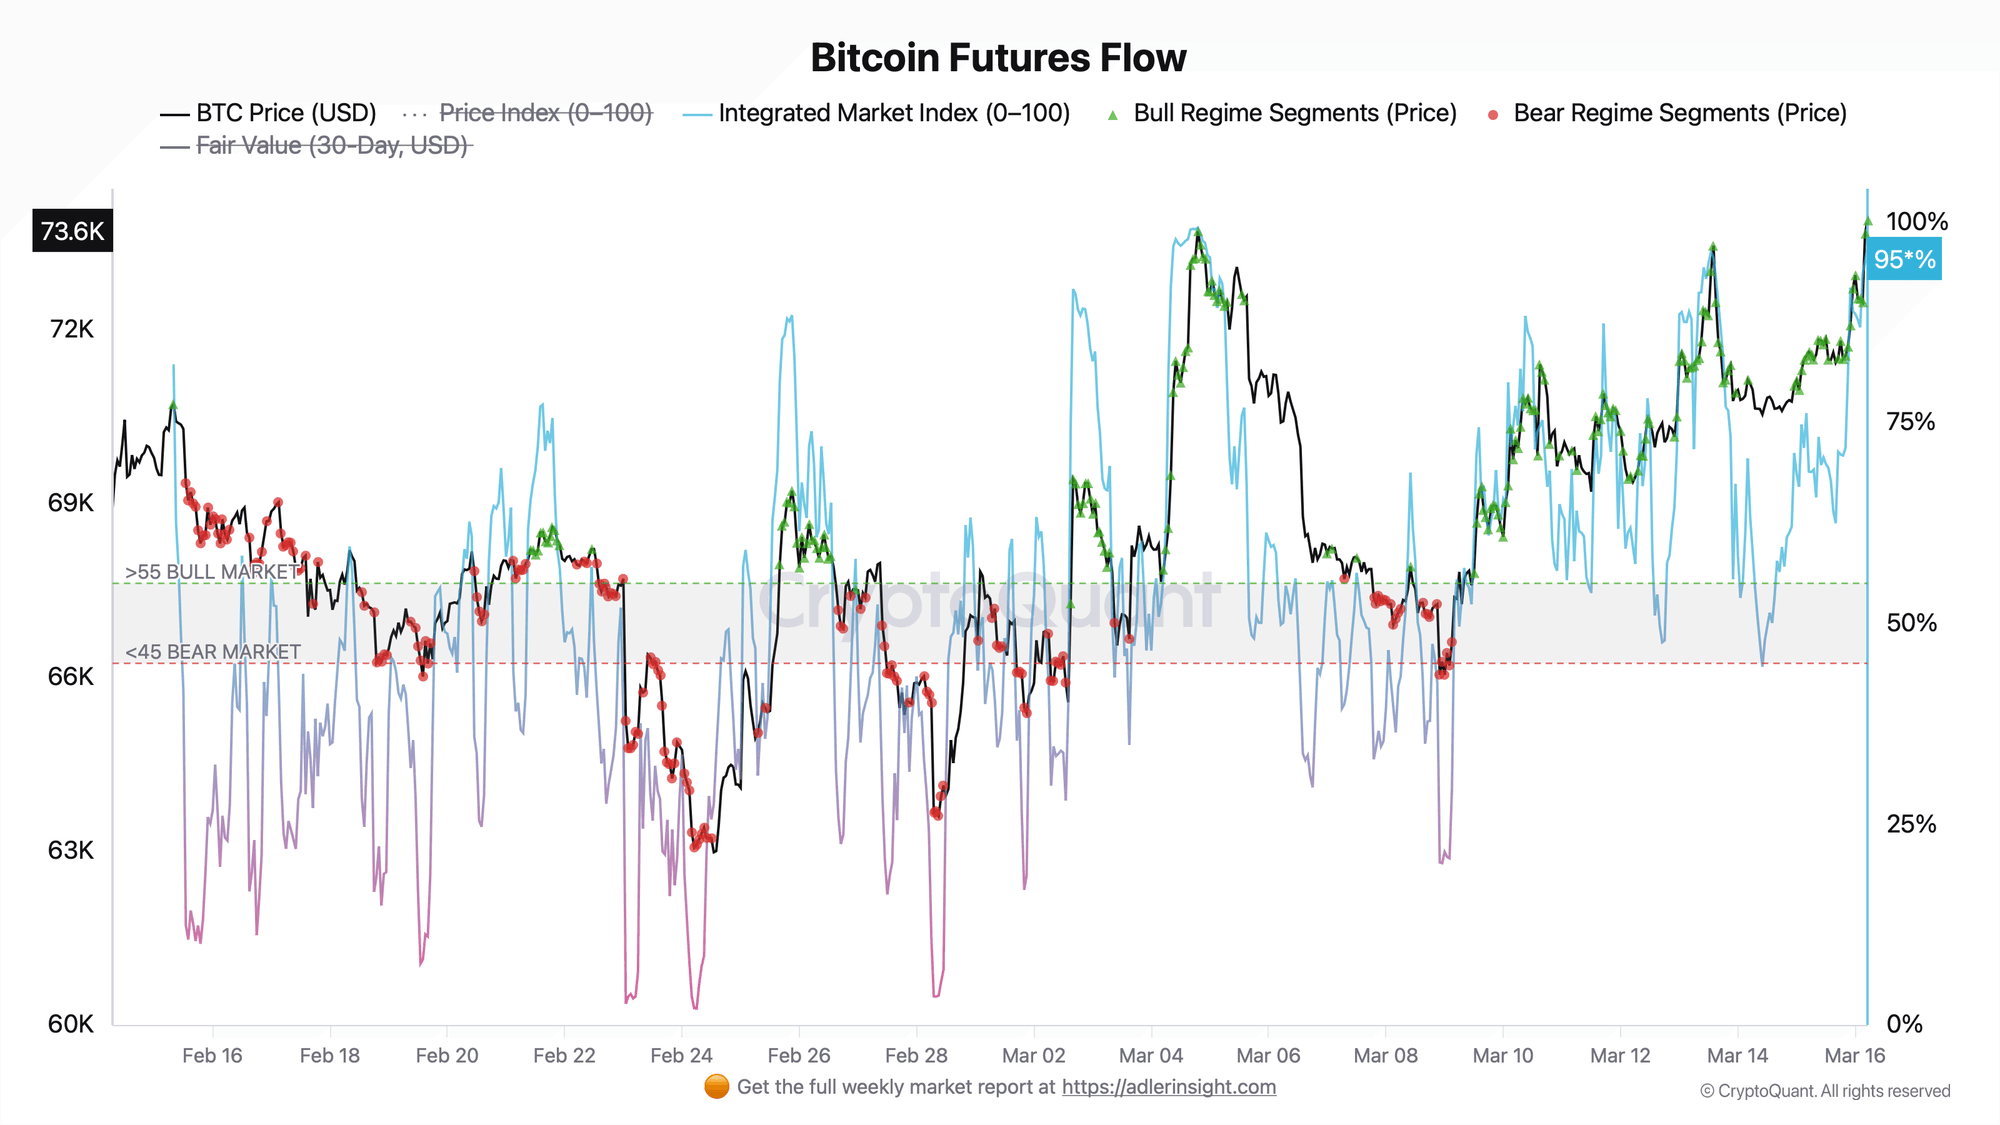
С 15 февраля модель оставалась твердо в медвежьем режиме. В тот период и ценовая динамика, и потоки на фьючерсном рынке ухудшались одновременно, поскольку устойчивый отрицательный чистый объем тейкеров и сжатие открытого интереса опустили Индекс потоков ниже медвежьего порога. По мере падения цены Bitcoin к $63 000, Интегрированный индекс достиг своих самых низких уровней.
Однако структура изменилась 10 марта, когда поток тейкеров развернулся, а открытый интерес снова начал расширяться. С того момента модель остается твердо бычьей, при этом индекс в настоящее время находится на уровне 96, своем самом высоком уровне за несколько недель.
Ценовой индекс и справедливая стоимость подтверждают смену режима Bitcoin
Адлер далее объясняет, что Ценовой индекс Bitcoin (0–100) и 30-дневная модель Справедливой стоимости дают дополнительное представление о том, как ведет себя рынок относительно своего статистического равновесия. Ценовой индекс представляет собой нормализованный z-скор цены, измеряющий, насколько Bitcoin отклоняется от своего недавнего среднего значения, в то время как Справедливая стоимость действует как скорректированный эталон, отражающий преобладающий рыночный режим.
В течение предыдущего медвежьего режима Bitcoin постоянно торговался ниже Справедливой стоимости, сигнализируя о постоянной слабости рынка. На пике продавленного давления 24 февраля дисконт значительно расширился. В тот момент Bitcoin торговался более чем на $3 300 ниже Справедливой стоимости, в то время как Ценовой индекс упал до 1,85, что указывало на то, что цена резко отклонилась ниже статистической нормы для той рыночной среды.
Сегодня ситуация изменилась на противоположную. Согласно данным Адлера, Ценовой индекс в настоящее время находится на уровне 95,35, при этом Bitcoin торгуется около $73 886, в то время как модель оценивает Справедливую стоимость примерно в $70 433. Это помещает рынок с премией около $3 453 выше Справедливой стоимости.
Адлер отмечает, что премии, превышающие $3000, с Ценовым индексом выше 90, представляют зоны повышенного внимания. Однако это не означает автоматически неминуемого разворота. До тех пор, пока Интегрированный индекс остается сильным — в настоящее время около 0,94 — премия считается структурно оправданной, что поддерживает мнение, что текущий пробой отражает подлинную смену режима, а не временную ценовую аномалию.
Bitcoin тестирует крупное сопротивление после восстановления от распродажи в феврале
Недельный график показывает, что Bitcoin пытается продолжить восстановление после резкого снижения, которое развернулось ранее в 2026 году. После продолжительного восходящего тренда, который подтолкнул BTC выше региона $110 000 в конце 2025 года, рынок вошел в корректирующую фазу, характеризующуюся сильным продавленным давлением и последовательностью более низких максимумов.
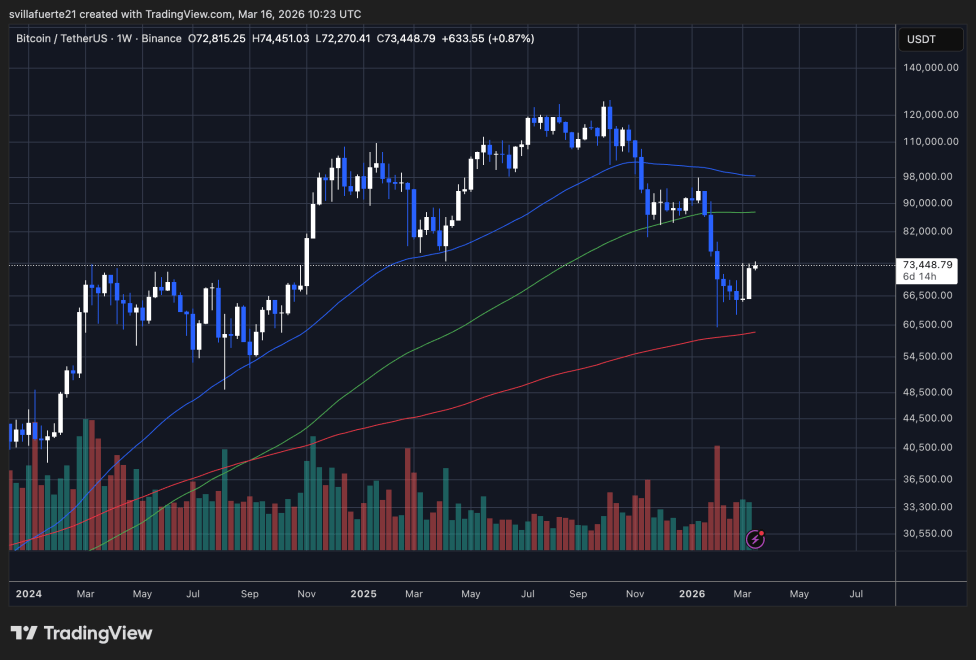
Эта коррекция ускорилась в феврале, когда Bitcoin упал в зону $60 000–$65 000, вызвав всплеск торгового объема, который, вероятно, отражал вынужденные ликвидации и более широкую капитуляцию рынка. Однако покупатели быстро вмешались после снижения, позволив BTC стабилизироваться и начать постепенное восстановление.
В последние недели Bitcoin вернул уровень $70 000 и теперь торгуется около $73 400, приближаясь к важной зоне сопротивления вокруг $74 000–$75 000. Этот регион ранее действовал как ключевой уровень поддержки до февральского обвала и теперь функционирует как сопротивление сверху.
С технической точки зрения, Bitcoin остается выше своей 200-недельной скользящей средней, которая продолжает двигаться вверх и служит критическим индикатором долгосрочной поддержки. Между тем, 100-недельная скользящая средняя находится выше текущей цены, что предполагает, что BTC должен вернуть более высокие уровни, чтобы полностью подтвердить бычье продолжение.
Если Bitcoin сумеет пробиться выше зоны сопротивления $74K, следующие восходящие цели могут появиться вокруг диапазона $82K–$90K. Однако неспособность сохранить импульс может привести к возобновлению консолидации, поскольку рынок поглощает недавнюю волатильность.
Изображение от ChatGPT, график от TradingView.com


