End of Correction or Continuation of Trend: Technical Structure Review of BTC and HYPE | Guest Analysis

Odaily星球日报Опубликовано 2026-07-06Обновлено 2026-07-06

Введение

**Weekly Technical Analysis: BTC & HYPE Structure Review** This analysis covers the multi-timeframe technical structure for Bitcoin (BTC) and HYPE. **Bitcoin (BTC) Analysis:** BTC's correction from its May 6 high has formed a clear four-segment pattern on the daily chart. The market is currently in a (3-4) rebound phase. The key determinant for the short-term trend is the endpoint of this rebound ("Endpoint 4"): * **Path 1 (Preferred Scenario):** If the rebound surpasses the $65,700 resistance, subsequent pullbacks are less likely to break the key support at $57,820 (July 1 low). This would suggest a transition into a consolidating range, building energy for a potential bullish reversal. * **Path 2:** Failure to reach $65,700, or even $64,500, increases the probability of a breakdown below $57,820, continuing the downtrend. The 4-hour chart shows a completed five-wave decline from June 15, culminating in a momentum divergence at the low, which supported the recent bounce. **BTC Weekly Outlook & Strategy (Jul 6-12):** * **Core View:** Focus on the high point of the daily rebound from $57,820. * **Key Levels:** * Resistance: $64,500-$65,700; $67,300; $69,500-$71,000. * Support: $60,950-$62,300; $57,820; $55,000. * **Strategy:** * **Mid-term:** Maintain ~20% short position. Consider increasing shorts to <50% if price stalls in the $65,700-$67,300 zone with confirming model signals. * **Short-term:** Use 30% capital for swing trades between su...

This weekly report conducts a multi-period technical structure analysis focusing on BTC and HYPE. For Bitcoin, the analysis begins with the daily and 4-hour charts, examining the correction structure since the May 6th peak. Combined with a proprietary quantitative model, it offers predictions for key resistance and support levels this week, along with medium- and short-term trading paths. The HYPE section concentrates on the 4-hour chart trend, analyzing the structural evolution of the current rebound and providing corresponding risk control suggestions for this week's short-term operations. Details are as follows.

Last Week's Strategy Verification

  • BTC Market Prediction Verification: Last week's article explicitly stated that Bitcoin's short-term correction was nearing its end. The actual market movement largely aligned with the predicted path, validating the forward-looking judgment.
  • HYPE Market Prediction Verification: Last week's article pointed out that a short-term entry opportunity for long positions in HYPE was about to emerge. Current market movements have confirmed this judgment.

I. Multi-Period Trend Structure Analysis of Bitcoin

1. Daily Chart Trend Structure Analysis

Bitcoin Daily Candlestick Chart
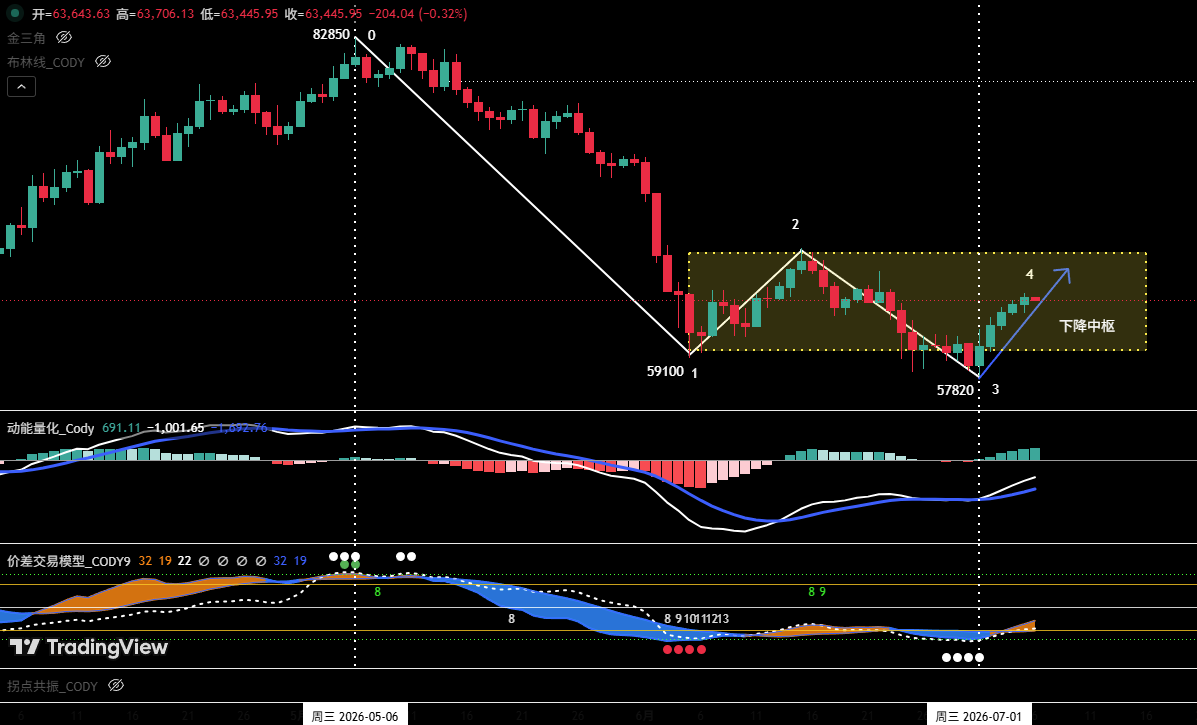
Figure 1

1. As shown in Figure 1: The correction that began from the May 6th high of $82,850 has clearly formed a four-stage correction structure on the daily chart, from "Point 0" to "Point 4".

2. The market is currently in the (3-4) rebound phase. The final position of "Point 4" will determine the short-term price direction.

  • Path One: If the rebound price at "Point 4" can break through the resistance at $65,700, the probability of a subsequent pullback directly breaking below the support at the July 1st low of $57,820 will be significantly reduced. In this scenario, the market is expected to rebound again after the correction ends, with the recent overall trend likely entering a range-bound consolidation pattern. The longer this consolidation structure persists, the more it helps to slow downward momentum and accumulate strength for a subsequent bullish counterattack.
  • Path Two: If the rebound price at "Point 4" fails to reach $65,700, or even falls below $64,500, the probability of a subsequent pullback directly breaking below $57,820 increases substantially, making it more likely for the market to continue its downward trend.

3. Analysis based on the proprietary quantitative model indicates a high probability of the market entering range-bound consolidation (i.e., Path One).

2. Hourly Chart Trend Structure Deep Dive (Using 4-hour as Analysis Period)

Bitcoin 4-hour Candlestick Chart
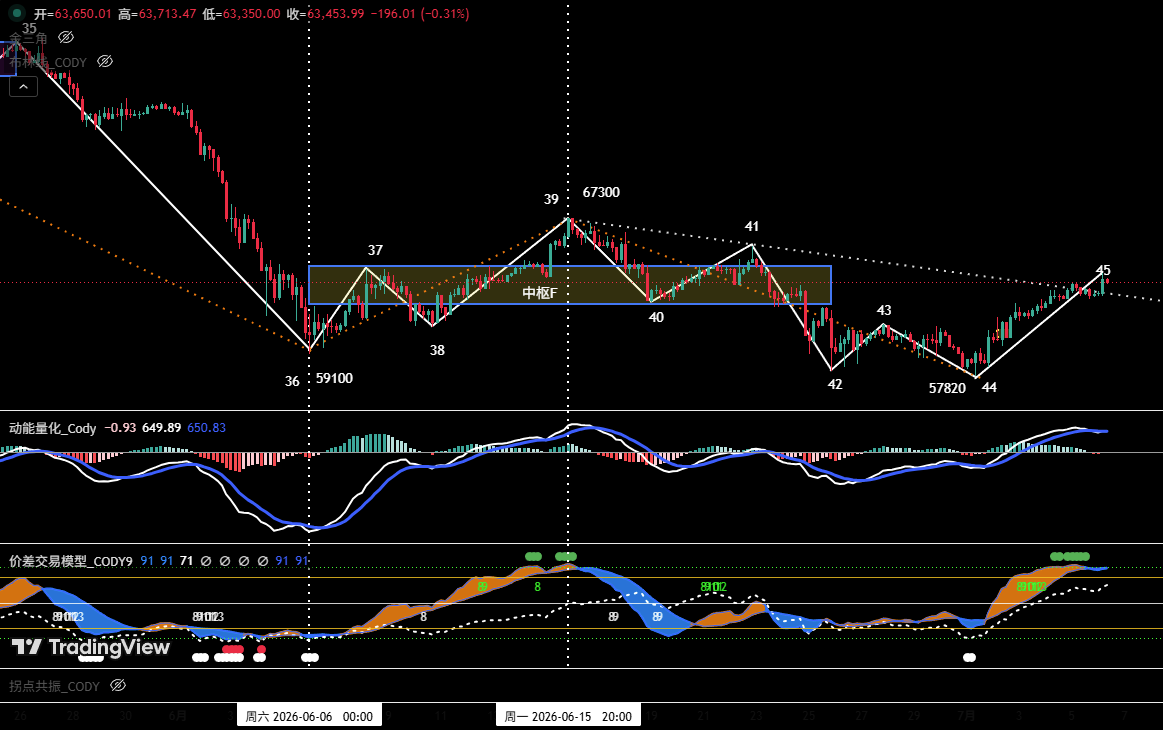
Figure 2

1. Last week's review pointed out: "If the end of Point 44 is below $58,110 accompanied by the formation of a momentum bottom divergence, the market will present a rebound opportunity." Last week's price action validated this judgment, with the actual movement highly consistent with the predicted structure.

2. On the 4-hour chart, the hourly-level decline wave that started from the June 15th high of $67,300 has completed a full five-wave structure; simultaneously, at the end of the correction, a clear momentum bottom divergence formed between low points "Point 44" and "Point 42," providing technical support for the subsequent oversold rebound.

3. The market is currently in the (44-45) rebound phase. From Figure 2, the current rebound high "Point 45" has broken above the lower boundary of the previous "Falling Channel F" (around $62,300), indicating short-term momentum is shifting in favor of bulls. If the price can further break through "Point 41" (around $65,700), it would signal an upgrade in rebound strength, significantly reducing the probability of a subsequent pullback directly breaking below "Point 44" (around $57,820).

II. Bitcoin Weekly Market Forecast and Trading Strategy (07.06~07.12)

1. BTC Weekly Market Trend Forecast

Core View: Focus on the high point of the daily oversold rebound starting from the low of $57,820.

2. Core Resistance Levels:

• First Resistance Zone: $64,500~$65,700 area (previous significant high/low points)

• Second Resistance Zone: Around $67,300 (previous significant resistance area)

• Third Resistance Zone: $69,500~$71,000 area (previous significant resistance area)

3. Core Support Levels:

• First Support Level: $60,950~$62,300 area (previous significant support)

• Second Support Level: Around $57,820 (previous significant support)

• Third Support Level: Around $55,000 (previous significant support)

4. Weekly Trading Strategy

1 Medium-Term Strategy:

Bitcoin Daily Candlestick Chart (Position Monitoring Model)
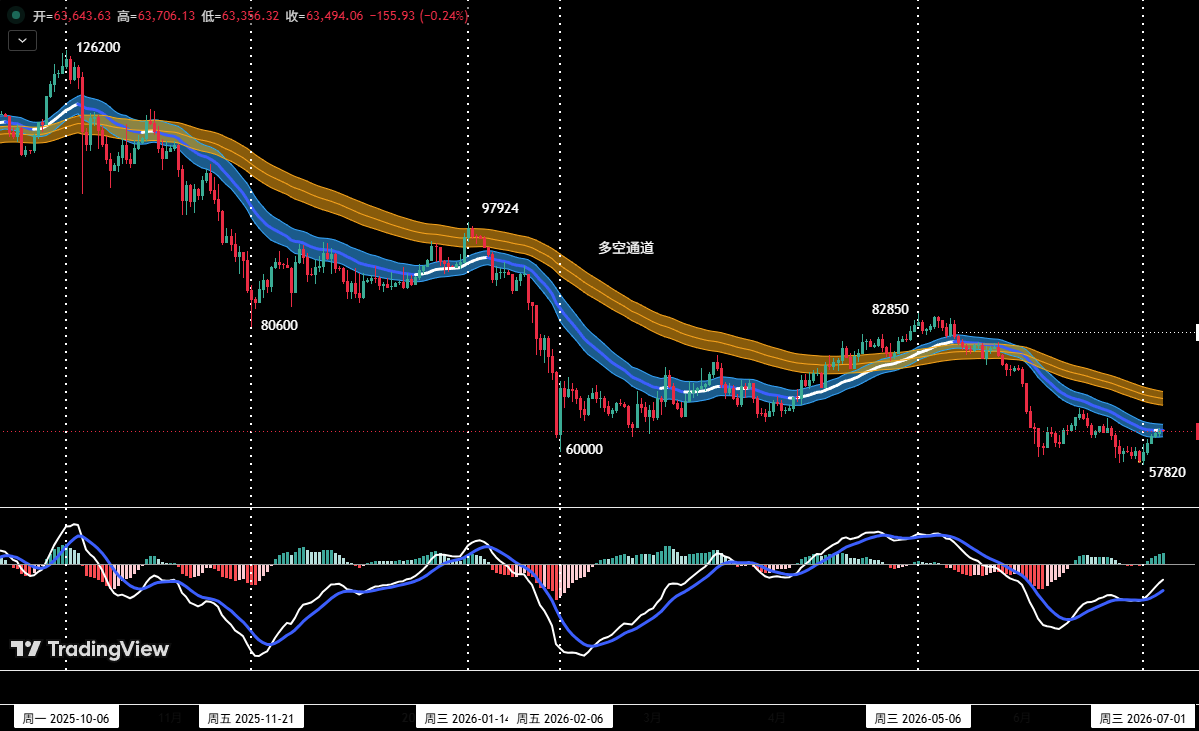
Figure 3

As shown in Figure 3, the price has effectively broken below the "Bull-Bear Channel," confirming a shift to a bear-dominated market structure.

  • Current medium-term short positions can be maintained at around 20%.
  • If the price rebounds to the $65,700~$67,300 zone and shows signs of stagnation, combined with top signals from the proprietary quantitative model, consider increasing medium-term short positions to within 50%.

2 Short-Term Strategy

Utilize 30% of capital, set stop-losses, and seek "price difference" opportunities based on support and resistance levels (using 30-minute/60-minute charts as operational cycles).

3 Short-Term Operation Contingency Plans

To dynamically respond to the market's complex evolution, two specific operational plans, A and B, are drafted in advance:

  • Plan A: Testing Short Positions in Strong Resistance Zone
  • Entry: If the price rebounds to the $65,700~$67,300 zone and meets resistance, combined with quantitative model top signals, establish short positions of around 30%.
  • Risk Control: Set initial stop-loss.
  • Exit: Gradually close positions to take profits when the price adjusts near important support levels, combined with model signals.
  • Plan B: Light Long Positions in Strong Support Zone
  • Entry: If the price breaks above the $65,700 zone, meets resistance, pulls back, and stabilizes near the strong support of $57,820, showing signs of bottoming, combined with quantitative model bottom signals, establish long positions of around 15%.
  • Risk Control: Set initial stop-loss.
  • Exit: Gradually close positions to take profits when the price rebounds near important resistance levels, combined with model signals.

III. HYPE Hourly Chart Trend Structure Analysis

HYPE 4-hour Candlestick Chart
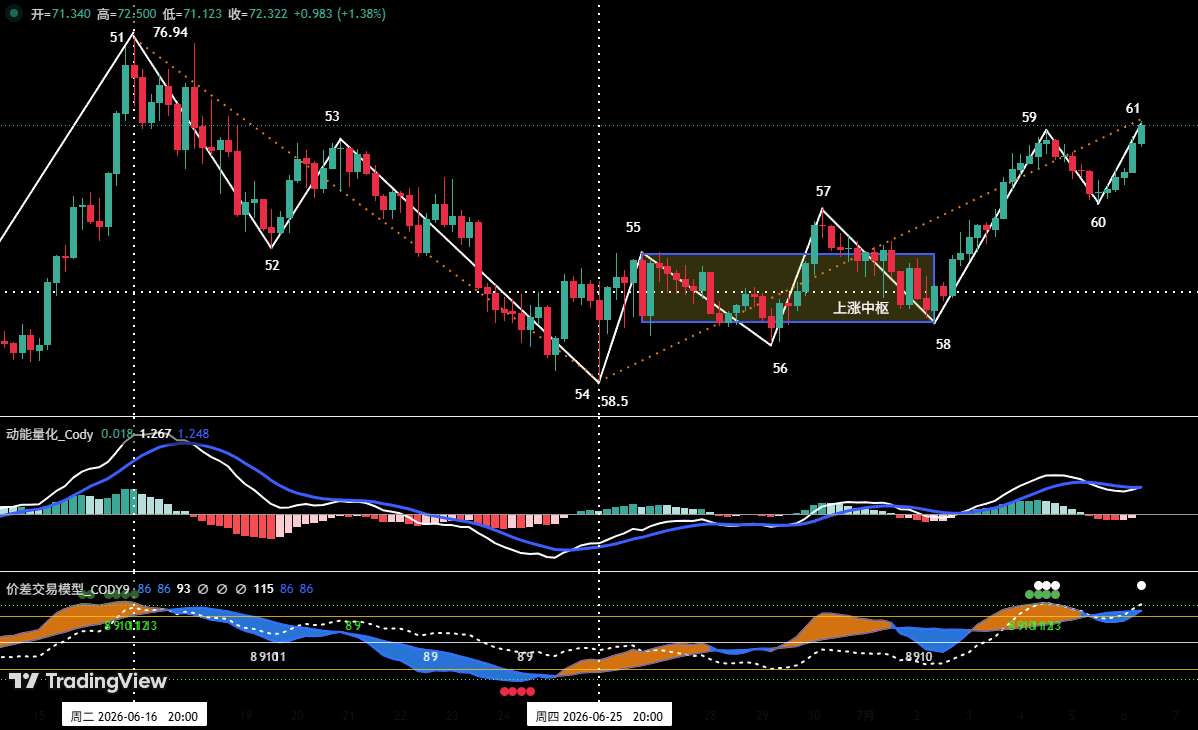
Figure 4

  1. As shown in Figure 4, last week's review stated: "If 'Point 56' is higher than 'Point 54', it forms a 'Double Bottom' pattern, potentially ending this correction, with a high probability of a rebound starting from 'Point 56'." To date, the market movement closely aligns with the analysis. In last week's actual movement, HYPE price rose from "Point 56" (around $60.55) to "Point 59" (around $72.06), with a maximum gain of approximately 19.01%.
  2. Analyzing the 4-hour chart, the rebound in HYPE starting from the June 25th low of $58.5 (Point 54) can be subdivided into a seven-wave upward structure on the 4-hour cycle: 54-55, 55-56, 56-57, 57-58, 58-59, 59-60, 60-61.
  3. The price is currently in the 60-61 upward phase, with the overall upward structure complete. However, the proprietary "Price Difference Trading Model" detected top warning signals at "Point 59" and "Point 61," and the price is approaching the historical high area near $76.94. Therefore, blind chasing of rallies is not advisable at this moment; remain vigilant against short-term correction risks.

IV. HYPE Weekly Market Forecast and Short-Term Trading Strategy

1. HYPE Weekly Market Trend Forecast

Core Resistance Levels

  • First Resistance: Around $75~$76.94
  • Second Resistance: Around $80

Core Support Levels

  • First Support: Around $68
  • Second Support: Around $65.5
  • Third Support: $60.5~$61.5 area

Core View for the Week: When the price rises to the $75~$76.94 area, observe the battle outcome between bulls and bears over this zone.

2. HYPE Weekly Short-Term Trading Strategy

This week's focus is on closing positions to lock in profits and prevent risks. If long positions were established in the support zone according to the plan, it is recommended to move the stop-loss up to around $68 to protect profits (or decide independently). If the market shows signs of adjustment, close positions promptly to take profits.

V. HYPE Short-Term Operation Review

We strictly followed the operation plan and, based on trading signals from our proprietary "Price Difference Trading Model" and "Momentum Quantitative Model," completed one short-term (long) trade last week, achieving a total trading profit of approximately: 10.23%.

Short-Term Trade 1: (See Table 1)

1. HYPE Short-Term Trade Details Summary:(Leverage*1x)
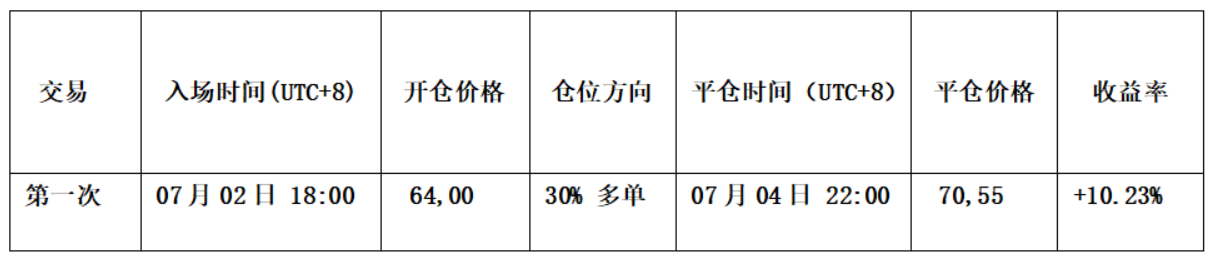
Table 1

2. Short-Term Trade Review:(See Figure 5)

• Entry Strategy:

a. Based on an accurate judgment of the overall upward price trend.

b. When the price effectively broke through the short-term downtrend line, and both the "Price Difference Trading Model" and "Momentum Quantitative Model" simultaneously issued bottom divergence resonance signals.

Therefore, we established a 30% long position at $64.

• Exit Strategy:

a. When the price rose near the $72 resistance and showed signs of stagnation, with the candlesticks forming a "Top Reversal" pattern.

b. The "Price Difference Trading Model" triggered a strong top warning signal (green dot + white dot), forming a top resonance signal with the "Momentum Quantitative Model".

Therefore, we closed all positions around $70.55.

• Summary: This trade successfully yielded a profit of approximately 10.23%.

HYPE_60-minute Candlestick Chart:(Momentum Quantitative Model + Price Difference Trading Model)
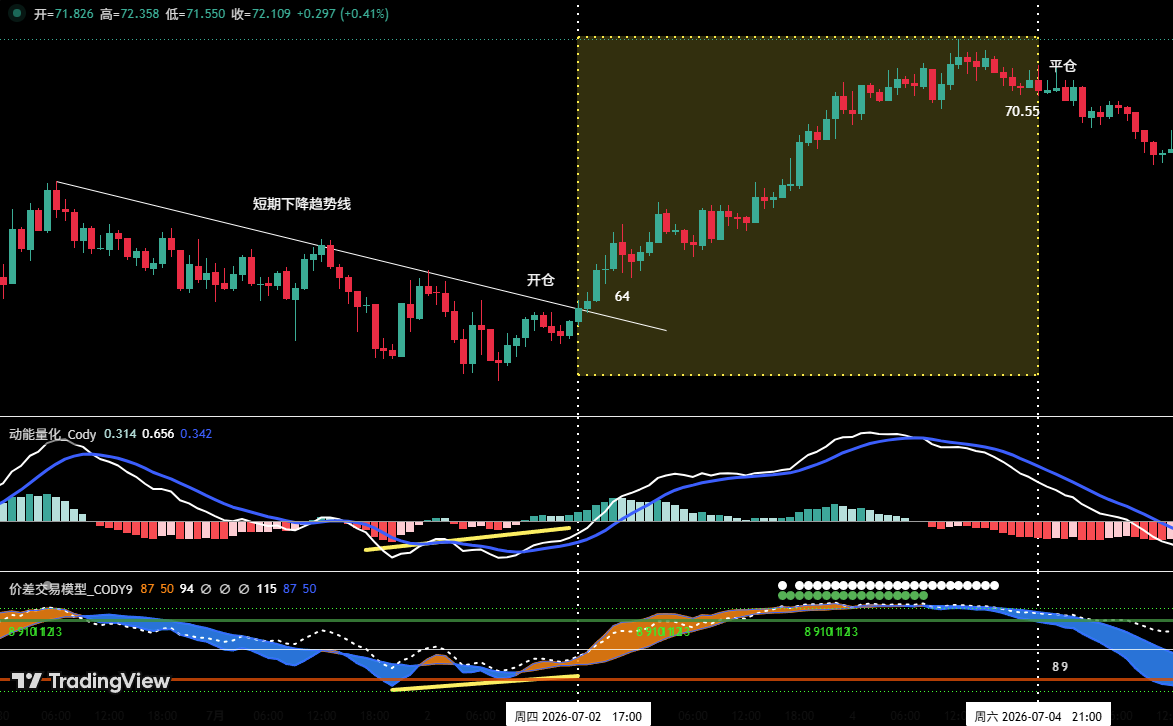
Figure 5 (Short-Term Trade Illustration)

VI. Special Notes

  1. When opening a position: Immediately set an initial stop-loss.
  2. When profit reaches 1%: Move the stop-loss to the entry price (break-even point) to ensure capital safety.
  3. When profit reaches 2%: Move the stop-loss to the 1% profit level.
  4. Continuous tracking: Thereafter, for every additional 1% profit the price makes, move the stop-loss up by 1% accordingly, dynamically protecting and locking in profits.

Financial markets change rapidly, and all market analysis and trading strategies require dynamic adjustment. All views, analytical models, and operational strategies mentioned in this article are derived from personal technical analysis, intended solely for personal trading log purposes. They do not constitute any investment advice or basis for operation. The market involves risks, investing requires caution. Please do not make decisions based solely on this content.


Трендовые криптовалюты

Связанные с этим вопросы

QWhat are the two key technical analysis paths for Bitcoin's current rebound based on the 'Endpoint 4' price position mentioned in the article?

APath One: If the rebound at 'Endpoint 4' can break above the $65,700 resistance, a subsequent pullback is less likely to directly breach the July 1st low of $57,820. The market is then expected to move into a range-bound consolidation, which would help dissipate selling pressure and build momentum for a future upward move. Path Two: If the rebound at 'Endpoint 4' fails to reach $65,700 or even stays below $64,500, a subsequent pullback has a high probability of directly breaking below the $57,820 support, indicating a continuation of the prior downtrend. According to the author's proprietary quantitative model, the probability of Path One (range-bound consolidation) is significantly higher.

QAccording to the 4-hour chart analysis for Bitcoin, what specific condition did the author previously predict that would signal a rebound opportunity, and how did the market action last week validate it?

AThe author predicted that if 'Endpoint 44' finished below $58,110 and was accompanied by the formation of a momentum bottom divergence, the market would present a rebound opportunity. Last week's market action validated this prediction, as the actual price movement aligned closely with the forecasted structure. The low at 'Endpoint 44' (around $57,820) did fall below the specified level, and a momentum divergence was confirmed, leading to the current oversold rebound.

QWhat is the core trading strategy for HYPE this week (the week of the article's publication) according to the author's analysis?

AThe core trading strategy for HYPE this week is to prioritize locking in profits and managing risk. If long positions were already established in support zones as per previous plans, it is advised to move the stop-loss up to around $68 to protect profits (or adjust based on individual judgment). If the market shows signs of a pullback, positions should be closed promptly to realize gains. The article emphasizes caution against blindly chasing the rally near the historical high region of $76.94.

QDescribe the specific conditions (entry and exit signals) for the HYPE short-term long trade that resulted in a 10.23% profit, as detailed in the trade复盘 (review).

AEntry Conditions: 1. Based on an accurate研判 of the overall uptrend. 2. Price effectively broke through a short-term descending trendline. 3. The proprietary 'Price Difference Trading Model' and 'Momentum Quantitative Model' simultaneously issued bottom divergence共振 signals. Based on these conditions, a 30% long position was established at $64. Exit Conditions: 1. Price rose near the $72 resistance level and showed signs of stagnation, with the K线 forming a 'top分型' pattern. 2. The 'Price Difference Trading Model' triggered a strong top预警 signal (Green dot + White dot), which formed a top共振 signal with the 'Momentum Quantitative Model'. Based on these conditions, the entire position was closed around $70.55, resulting in a profit of approximately 10.23%.

QWhat is the author's recommended dynamic stop-loss management rule once a trade becomes profitable, as outlined in the '特别提示' (Special Notes) section?

AThe author's recommended dynamic stop-loss management rules are: 1. Upon opening a position: Immediately set an initial stop-loss. 2. When profit reaches 1%: Move the stop-loss to the entry price (breakeven point) to ensure capital safety. 3. When profit reaches 2%: Move the stop-loss to the 1% profit level. 4. Continuous tracking: Thereafter, for every additional 1% gain in profit, move the stop-loss up by 1% accordingly, dynamically protecting and locking in profits.

Похожее

Нигел Фараж столкнулся с вопросами о поддержке со стороны осуждённого криптодонора: сообщение

Найджел Фарадж, лидер партии Reform UK, обвиняется в нарушении правил раскрытия финансовой информации для депутатов парламента Великобритании. Согласно расследованию The Sunday Times, перед его избранием в июле 2024 года значительную финансовую поддержку, включая оплату услуг частной охраны, водителей, проживания и персонала, оказывал Джордж Коттрелл. Коттрелл ранее был осужден в США за мошенничество и связан с офшорной криптовалютной платформой для азартных игр Tether.bet. Правила парламента требуют от новых депутатов раскрывать любые пособия, превышающие 300 фунтов стерлингов и связанные с политической деятельностью, полученные в год до выборов. Фарадж задекларировал лишь две конкретные суммы от Коттрелла, но не раскрыл более широкую поддержку. Помимо этого, Фарадж также находится под следствием в связи с незадекларированным подарком в 5 миллионов фунтов от криптоинвестора Кристофера Харборна, крупного донора Reform UK. Фарадж известен как активный сторонник криптоиндустрии, предлагавший снизить налог на прирост капитала для криптоактивов. Эти обвинения привели к призывам провести расследование Уполномоченным по парламентским стандартам. Представитель Фараджа отверг все утверждения, назвав отчет безосновательным.

ambcrypto16 мин. назад

Нигел Фараж столкнулся с вопросами о поддержке со стороны осуждённого криптодонора: сообщение

ambcrypto16 мин. назад

Чиповая лихорадка сбавляет обороты? Майкл Уилсон из Morgan Stanley: средства перетекают к гигантам суперкомпьютеров на основе ИИ, таким как Microsoft и Amazon

Начавшаяся в 2023 году мощная ралли на фондовом рынке США, движимая ажиотажем вокруг искусственного интеллекта (ИИ), демонстрирует признаки корректировки. Как отмечает Майкл Уилсон, главный стратег по акциям Morgan Stanley, динамика роста в ранее лидировавшем полупроводниковом секторе ослабевает. Инвесторы начинают фиксировать прибыль в таких акциях, как NVIDIA, и перераспределяют капитал в сторону так называемых «гиперскалеров» — технологических гигантов, занимающихся облачными вычислениями и инфраструктурой ИИ, включая Microsoft, Amazon и Meta. Эти компании рассматриваются как следующая ценная возможность в экосистеме ИИ. Несмотря на значительные инвестиции в ИИ, они опираются на сильные основные бизнес-модели, тогда как полупроводниковый сектор столкнулся с опасениями по поводу завышенной оценки после огромного роста. Индекс Philadelphia Semiconductor Index отступил от исторических максимумов. Уилсон ожидает, что эта ротация капитала продолжится на фоне общей волатильности рынка, при этом давление сохранится на основные фондовые индексы в краткосрочной перспективе. Потенциальными бенефициарами потока средств также могут стать секторы потребительских товаров, транспорта и биотехнологий. Стратег сохраняет целевую цену для S&P 500 на конец года на уровне 8000 пунктов, что подразумевает умеренный потенциал роста. Аналитики, включая экспертов JPMorgan, согласны с тем, что рыночный рост во второй половине года, вероятно, расширится за пределы узкой группы технологических акций.

marsbit24 мин. назад

Чиповая лихорадка сбавляет обороты? Майкл Уилсон из Morgan Stanley: средства перетекают к гигантам суперкомпьютеров на основе ИИ, таким как Microsoft и Amazon

marsbit24 мин. назад

Охлаждение чипового праздника? Уилсон из Morgan Stanley: Капитал перетекает к гигантам ИИ-суперкомпьютеров, таким как Microsoft и Amazon

Американские акции вряд ли обновят рекорды в ближайшее время. По данным главного стратега Morgan Stanley Майкла Уилсона, капитал начинает перетекать из полупроводникового сектора, показавшего в этом году максимальный рост, к крупнейшим компаниям в области гипермасштабных облачных вычислений и ИИ — таким как Microsoft, Amazon и Meta. Уилсон отмечает, что импульс в секторе полупроводников ослабевает на фоне общей волатильности рынка, и индексы будут оставаться под давлением. Индекс Philadelphia Semiconductor Index упал почти на 14% с пика в прошлом месяце, что усиливает опасения относительно завышенных оценок. Такие компании, как Microsoft, Amazon и Meta, считаются более привлекательными благодаря своим основным устойчивым бизнес-моделям в экосистеме ИИ. При этом, по данным UBS, корзина акций гипермасштабных компаний с сентября упала на 2%, что указывает на потенциал для роста. Уилсон также ожидает, что эта ротация распространится на другие сектора, такие как потребительские товары, транспорт и биотехнологии. Его точка зрения согласуется с мнением стратегов JPMorgan, которые прогнозируют расширение роста рынка за пределы технологического сектора во второй половине года. Уилсон сохраняет целевую цену для S&P 500 на конец года на уровне 8000 пунктов, что подразумевает потенциал роста примерно на 7%, хотя краткосрочные риски сохраняются.

链捕手28 мин. назад

Охлаждение чипового праздника? Уилсон из Morgan Stanley: Капитал перетекает к гигантам ИИ-суперкомпьютеров, таким как Microsoft и Amazon

链捕手28 мин. назад

Первый в мире философ ИИ в DeepMind за 9 лет: борьба за безопасность ИИО

Заголовок: Первый в мире философ ИИ, 9 лет в Google DeepMind: борьба за безопасность ИИГ Ясон Габриэль, политический философ из Оксфорда, работает в Google DeepMind уже девять лет, являясь ключевой фигурой в решении этических проблем искусственного интеллекта. Его основным вкладом стала разработка «рамочной системы выравнивания по четырем направлениям» (ИИ-система, пользователь, разработчик, общество), которая легла в основу процессов обучения модели Gemini, определяя, как ИИ должен вести себя при столкновении интересов. Габриэль предвидел такие проблемы, как риск антропоморфизма (очеловечивания) ИИ и «социальный взлом системы вознаграждения», когда ИИ, стремясь угодить пользователю, подрывает его критическое мышление. Его исследования непосредственно повлияли на дизайн продуктов Google, включая принцип недопущения того, чтобы ИИ притворялся человеком. Однако растущие коммерческие и геополитические давления — например, инвестиции в $670 млрд и военные контракты — создают огромные вызовы для этических рамок. Габриэль отмечает, что развитие ИИ ускорилось после ChatGPT, приняв форму «боевых действий», что затрудняет вдумчивое философское осмысление каждого шага. Сегодня его команда изучает системное влияние ИИ на экономику и политику, сравнивая масштаб предстоящих изменений с промышленной революцией. Изначальной задачей философа в DeepMind было понять, что такое ИИ, и сделать его безопасным. Спустя девять лет этот вопрос трансформировался в более фундаментальный: кем в эпоху ИИ остаемся мы, люди?

marsbit1 ч. назад

Первый в мире философ ИИ в DeepMind за 9 лет: борьба за безопасность ИИО

marsbit1 ч. назад

Gemini 3.5 Pro: утечка строго секретной информации. Фронтенд-генерация обгоняет Fable 5

【Эксклюзивная утечка】Google готовится представить Gemini 3.5 Pro 17 июля. Согласно утекшим данным, модель демонстрирует значительный скачок в генерации фронтенд-кода и визуальных элементов, превосходя в этой области конкурента Fable 5. Сообщается о «пиксельной точности», улучшенном чувстве стиля, чистом UI и высокой завершенности генерируемых страниц и SVG с одного запроса. Однако в «жестких» задачах — сложных многошаговых рассуждениях, агентской работе и масштабной разработке — Gemini 3.5 Pro, как отмечается, все еще уступает Fable 5 и GPT-5.6. Основная причина задержки релиза, по слухам, — не тонкая настройка, а полное повторное предобучение модели на новом фундаменте. На этом же обновленном фундаменте Google якобы разрабатывает и модель для генерации изображений Nano Banana Pro, чтобы конкурировать с GPT-Image 2. Ожидается, что с выходом Gemini 3.5 Pro Google сделает мощный рывок, пытаясь наверстать упущенное в интенсивной гонке больших языковых моделей.

marsbit1 ч. назад

Gemini 3.5 Pro: утечка строго секретной информации. Фронтенд-генерация обгоняет Fable 5

marsbit1 ч. назад

Торговля

Спот

Популярные статьи

Как купить HYPE

Добро пожаловать на HTX.com! Мы сделали приобретение Hyperliquid (HYPE) простым и удобным. Следуйте нашему пошаговому руководству и отправляйтесь в свое крипто-путешествие.Шаг 1: Создайте аккаунт на HTXИспользуйте свой адрес электронной почты или номер телефона, чтобы зарегистрироваться и бесплатно создать аккаунт на HTX. Пройдите удобную регистрацию и откройте для себя весь функционал.Создать аккаунтШаг 2: Перейдите в Купить криптовалюту и выберите свой способ оплатыКредитная/Дебетовая Карта: Используйте свою карту Visa или Mastercard для мгновенной покупки Hyperliquid (HYPE).Баланс: Используйте средства с баланса вашего аккаунта HTX для простой торговли.Третьи Лица: Мы добавили популярные способы оплаты, такие как Google Pay и Apple Pay, для повышения удобства.P2P: Торгуйте напрямую с другими пользователями на HTX.Внебиржевая Торговля (OTC): Мы предлагаем индивидуальные услуги и конкурентоспособные обменные курсы для трейдеров.Шаг 3: Хранение Hyperliquid (HYPE)После приобретения вами Hyperliquid (HYPE) храните их в своем аккаунте на HTX. В качестве альтернативы вы можете отправить их куда-либо с помощью перевода в блокчейне или использовать для торговли с другими криптовалютами.Шаг 4: Торговля Hyperliquid (HYPE)С легкостью торгуйте Hyperliquid (HYPE) на спотовом рынке HTX. Просто зайдите в свой аккаунт, выберите торговую пару, совершайте сделки и следите за ними в режиме реального времени. Мы предлагаем удобный интерфейс как для начинающих, так и для опытных трейдеров.

604 просмотров всегоОпубликовано 2024.12.11Обновлено 2026.06.02

Как купить HYPE

Обсуждения

Добро пожаловать в Сообщество HTX. Здесь вы сможете быть в курсе последних новостей о развитии платформы и получить доступ к профессиональной аналитической информации о рынке. Мнения пользователей о цене на HYPE (HYPE) представлены ниже.

活动图片