Мемкоин на базе искусственного интеллекта Siren [SIREN] недавно привлёк внимание криптотрейдеров и инвесторов своим бычьим поведением. Он продемонстрировал экстремальную волатильность за последнюю неделю после стабильного роста с февраля.
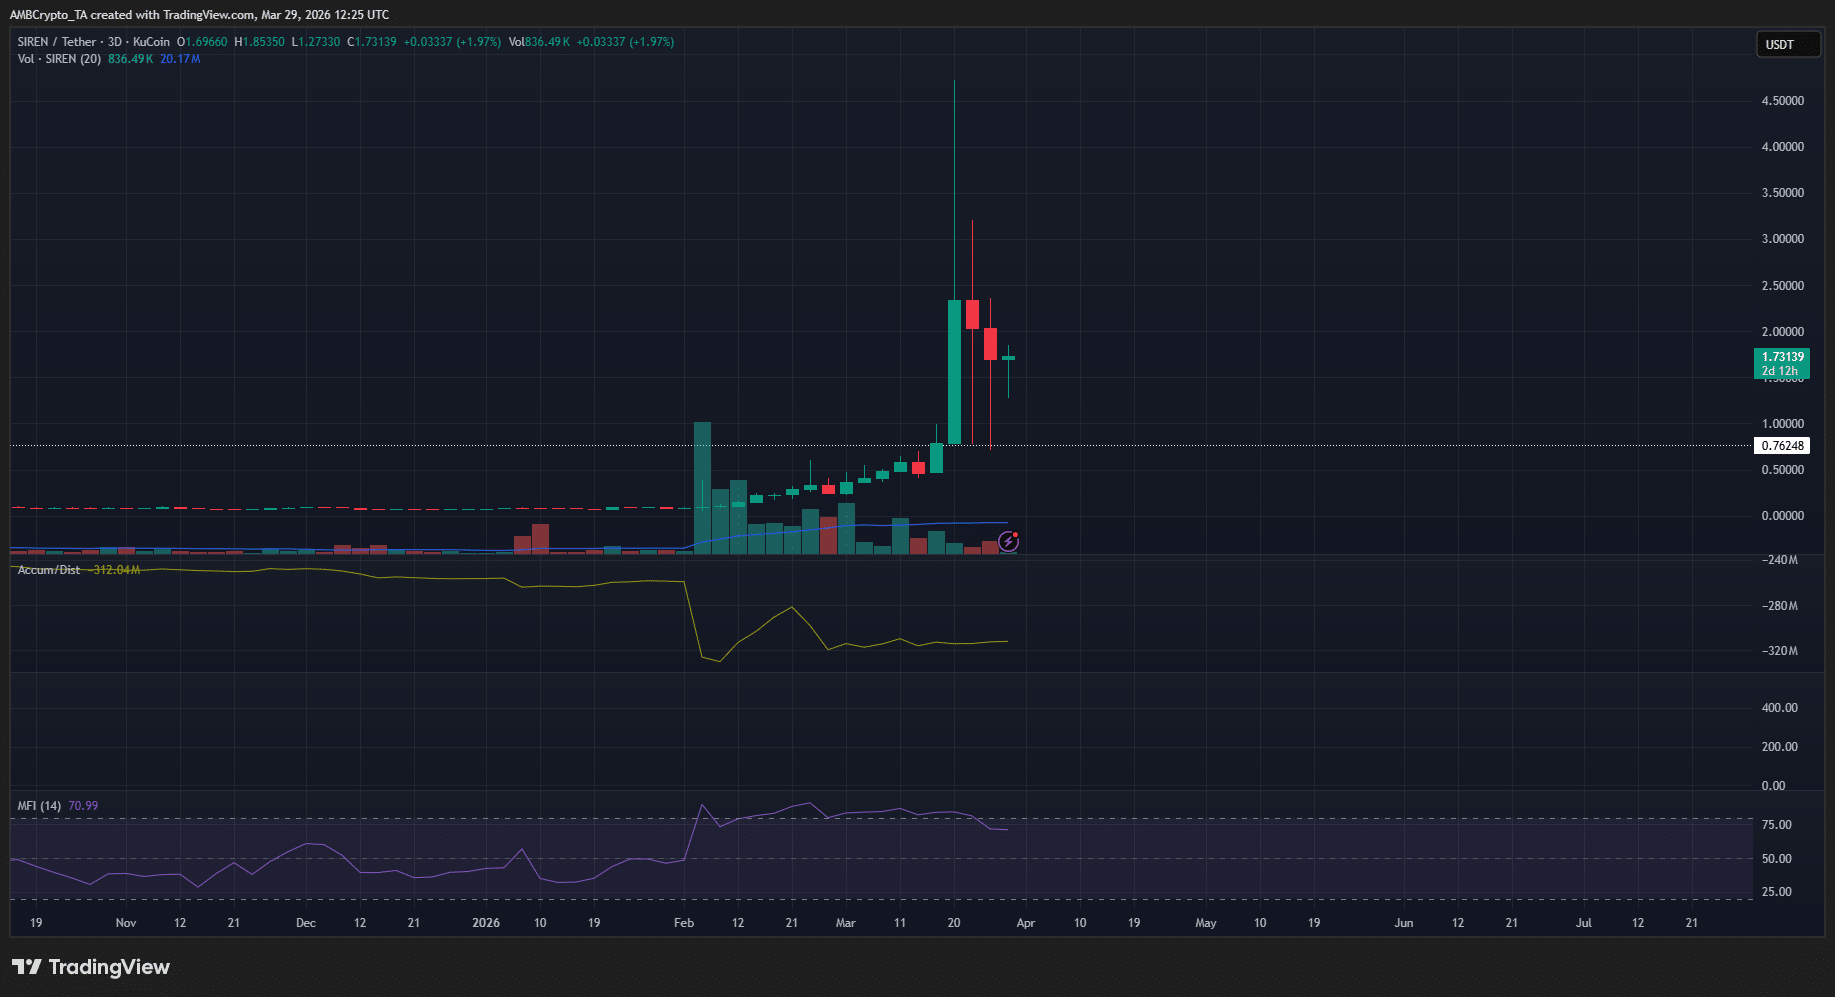

Тренд на трёхдневном графике оставался строго бычьим. RSI корректировался от перекупленных уровней, что объясняет снижение последних нескольких дней. В то же время, большие верхние тени у некоторых свечей на трёхдневных сессиях опустили индикатор A/D ниже.
Спад торгового объёма по сравнению с февралем был разительным, тем более что в марте SIREN показал ещё больший рост. Любое восстановление потребует массивного притока торгового объёма и спроса для поддержания следующего движения вверх.
В краткосрочной перспективе вероятно более глубокое падение цены. Монета протестировала локальную поддержку в $0,78 и отскочила вверх, но ещё не вышла из фазы сжатия, в которую вошла на прошлой неделе. Её нисходящий треугольный графический паттерн скоро найдёт разрешение.
SIREN снова протестирует локальную поддержку

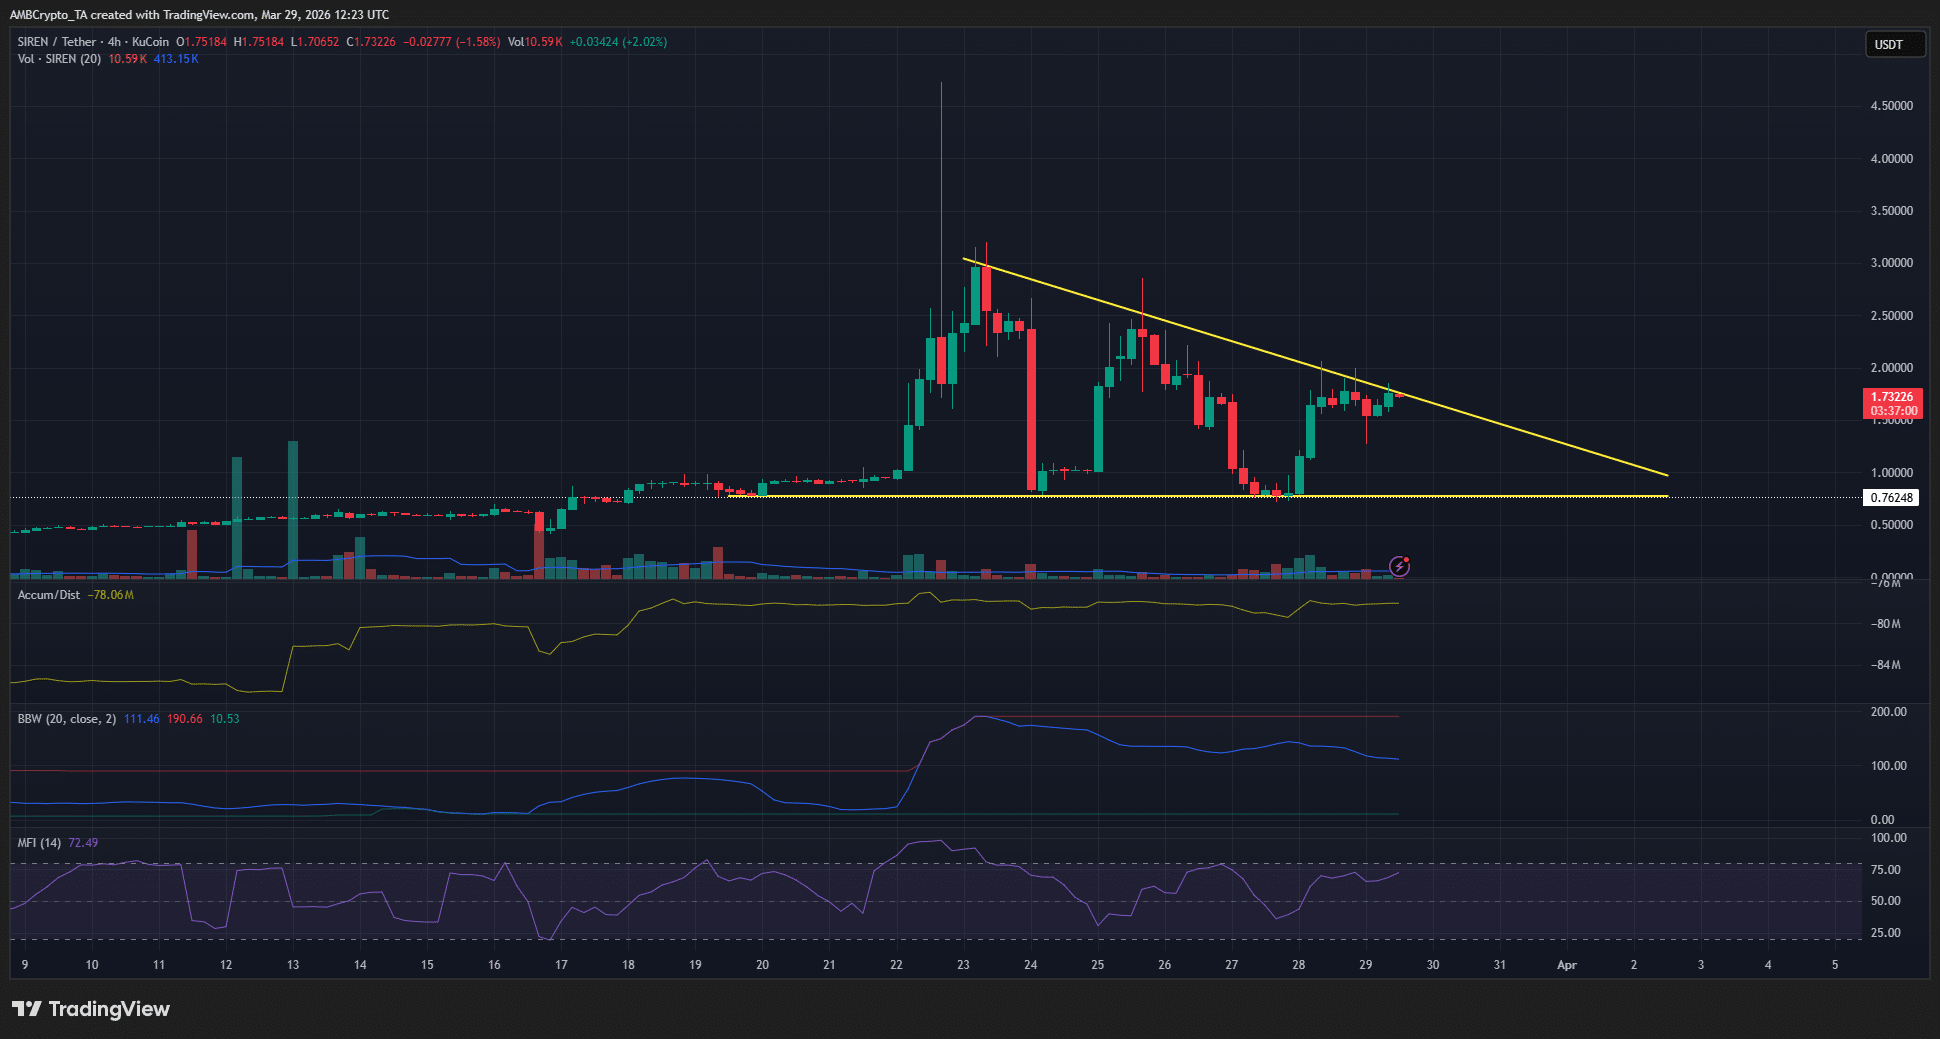
Нисходящий треугольный паттерн вызывал обеспокоенность у быков. Зона поддержки в $0,8 тестировалась многократно в последние дни. При этом каждое последующее ценовое отскок было менее глубоким.
Другими словами, уверенность продавцов оставалась высокой, а покупатели держались. Высокая волатильность и низкий спрос могут привести к пробитию зоны поддержки $0,8, что отправит SIREN в более глубокую коррекцию.
Для того, чтобы убедить свинг-трейдеров массово открывать длинные позиции, необходим пробой выше $2.
Призыв к действию для трейдеров – Ждать
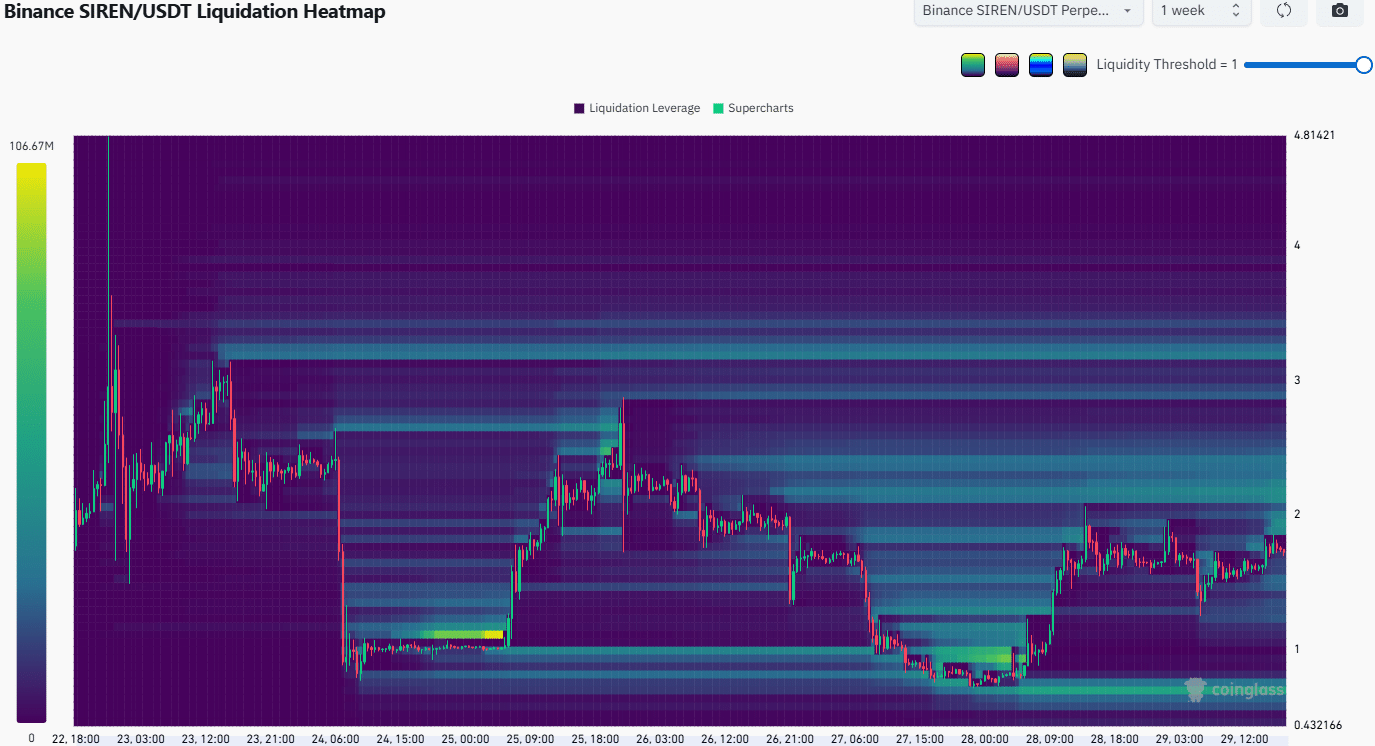

Тепловая карта ликвидаций предупреждала о потенциальном сборе ликвидности в области $2. Это может выглядеть как пробой, но есть угроза разворота, особенно если сохранится низкий спрос.
В этом сценарии в ближайшие дни может начаться падение к магнитной зоне $0,7 для охоты за лонгами на ликвидацию. В сочетании с треугольным паттерном, более глубокое падение цены кажется вероятным.
Истинный пробой и ретест уровня $2 при высоком объёме, в нынешних условиях, маловероятен.
Итоговое резюме
- SIREN был одним из немногих мемкоинов, демонстрировавших бычью силу в последние недели.
- Нисходящий треугольный паттерн был предупреждением для быков о падении ниже локальной поддержки $0,8.