Con el precio de Bitcoin estancado por debajo de la marca de $70,000, los analistas comienzan a señalar este rendimiento actual como un indicio de un mercado bajista. Después de varias semanas de presión a la baja, muchas métricas clave están comenzando a mostrar signos de una fase de corrección continuada, reforzando la idea de un escenario de mercado bajista.
Métrica clave de Bitcoin se acerca a su media móvil simple de 4 años
Dadas las señales recientes de múltiples métricas clave del mercado de Bitcoin, la actual tendencia bajista del BTC parece no haber llegado a su fin todavía. Actualmente, una métrica en particular indica que el activo insignia se está acercando a un umbral históricamente significativo, similar a una fase de mercado bajista.
Esta señal surge del Análisis de Precio Diario de Bitcoin con Multiplicador de la Media Móvil Simple (SMA), construido en torno a medias móviles y múltiplos, como informó Darkfost, un analista de datos y autor en CryptoQuant. Los datos recientes muestran que Bitcoin ha vuelto a la zona verde en el gráfico y se está aproximando a su SMA de 4 años, que actualmente se sitúa alrededor del nivel de precio de $57,500.
Cuanto mayor es la desviación estándar y, en consecuencia, el múltiplo de la SMA, más sobrecomprado parece Bitcoin. Sin embargo, el experto destacó que cuanto más se acerca el precio a la SMA de 4 años, más infravalorado se vuelve el precio de BTC. Para que estas etapas sean más fáciles de comprender, se utiliza una escala de colores para ilustrar todo esto.
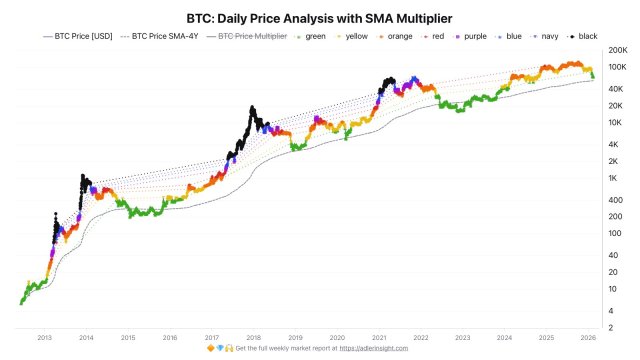
En el pasado, este nivel generalmente ha servido como una señal confiable para la etapa final de cada mercado bajista, con el activo insignia cotizando alrededor de estos niveles durante varios meses. Según los datos del gráfico, el mercado se está aproximando a un nivel de mercado bajista, y Darkfost considera que esta tendencia actual es interesante y exige la atención del mercado.
Con Bitcoin acercándose a este nivel, el enfoque se desplaza hacia si la historia se repetirá o si entrará en juego una nueva dinámica de ciclo. Por ahora, la criptomoneda permanece en un punto de decisión que ilustra la creciente tensión entre la debilidad persistente y el soporte de valoración a largo plazo.
¿Ha alcanzado el precio de BTC un fondo ya?
A medida que aumentan las discusiones sobre el fondo del precio de Bitcoin, Joao Wedson ha proporcionado información sobre la situación utilizando las Bandas de Precio Realizado de los Tenedores a Largo Plazo de BTC. Históricamente, los principales fondos han ocurrido cuando el precio alcanza los niveles de -0.2 desviaciones estándar de esta métrica clave.
Wedson señaló que este punto está marcado por fases clásicas de capitulación y la última oportunidad de comprar el rey de las criptomonedas antes de que despegue un nuevo mercado alcista. Sin embargo, durante el fin de semana, el comportamiento fue diferente. Una mirada al gráfico muestra que el precio no puede mantener movimientos por encima de la desviación estándar +1, lo que sugiere una actividad de venta continua y agresiva por parte de los bajistas en estas regiones.
Actualmente, estas bandas actúan como zonas naturales de soporte y resistencia a lo largo de los ciclos del mercado. La probabilidad de que emerja un fondo estructural aumenta drásticamente cuando el precio se acerca a valores extremadamente negativos. Mientras tanto, los datos están revelando las áreas con el mayor riesgo y la emergencia de asimetría.


