Ethereum price has been rejected again at the $1,299 price mark as the coin retraced on its chart over the past day. In the last 24 hours, ETH barely experienced price movement on its chart. Continued lateral trading will push Ethereum price to the $1,200 support level.
Bitcoin also remained mundane over the last 24 hours, and most altcoins have acted the same way. The technical outlook of Ethereum signalled that the bulls are not in control of the market. It was due to constant rejection at the $1,300 price mark.
Lack of demand will cause Ethereum to oscillate between the $1,260 and $1,360 price levels, respectively. In case the price momentum doesn’t pick up in the next trading sessions, ETH could even travel below the $1,200 support line.
For the bearish pressure to fade, ETH has to manage to break past the $1,360 mark. It has to trade above the aforementioned level for some time. The global cryptocurrency market cap today is $962 billion, with a 0.3% negative change in the last 24 hours.
Ethereum Price Analysis: One-Day Chart
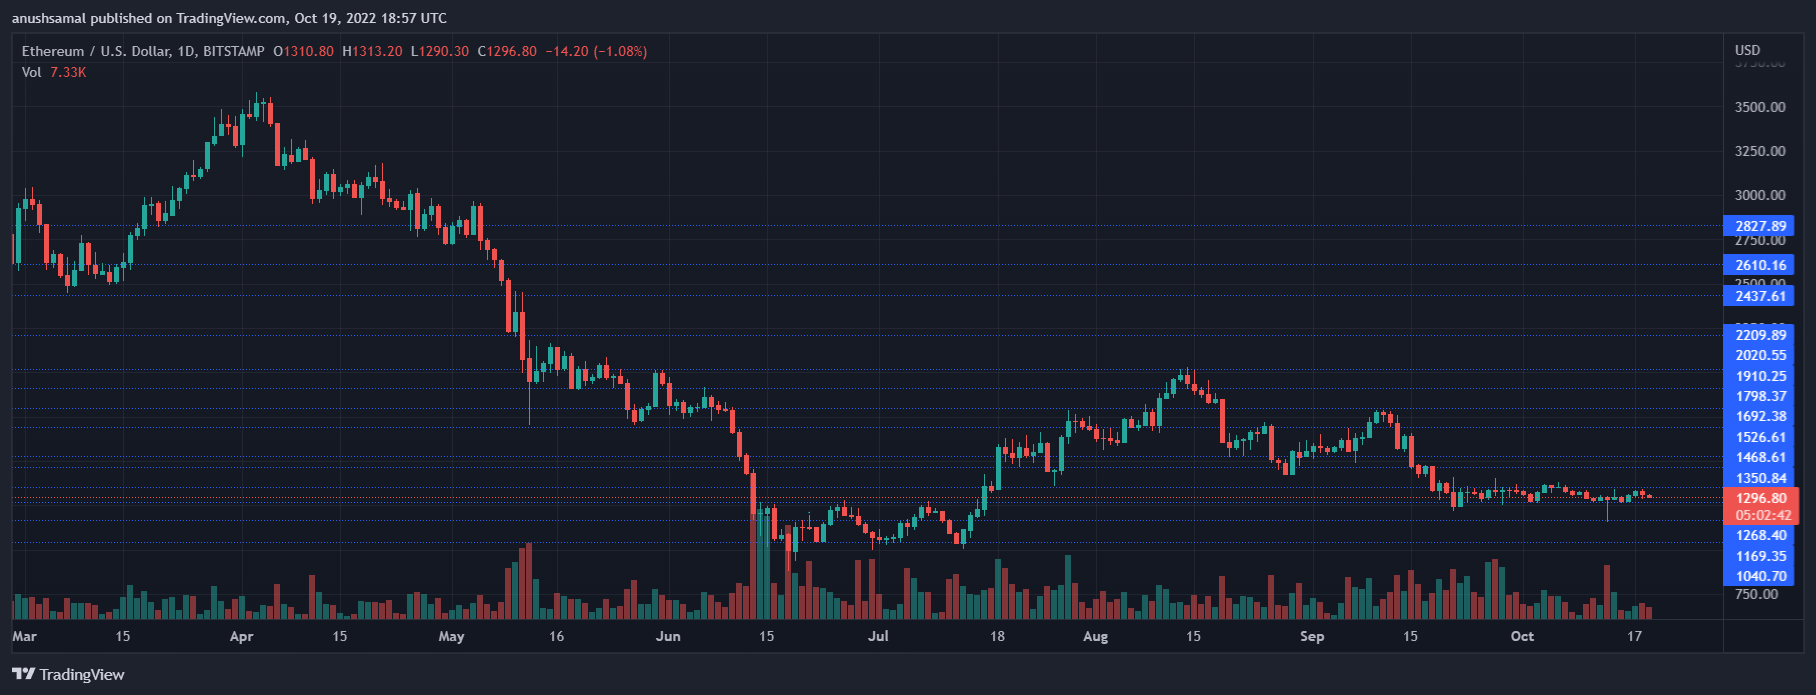
ETH was trading at $1,290 at the time of writing. The altcoin could not push past the $1,300 resistance mark as sellers took over.
Immediate resistance was at $1,300, suggesting that it could meet the $1,360 price ceiling. A move above the $1,360 level will make the bulls come back on Ethereum’s chart.
On the other hand, the local support for the altcoin was at $1,268. If the demand for the coin doesn’t come back over the next trading sessions, Ethereum is moving south.
A break below the $1,268 level will make the coin trade at $1,200 and then at $1,160. The amount of Ethereum traded in the past session fell, indicating bearishness and an increase in selling pressure.
Technical Analysis
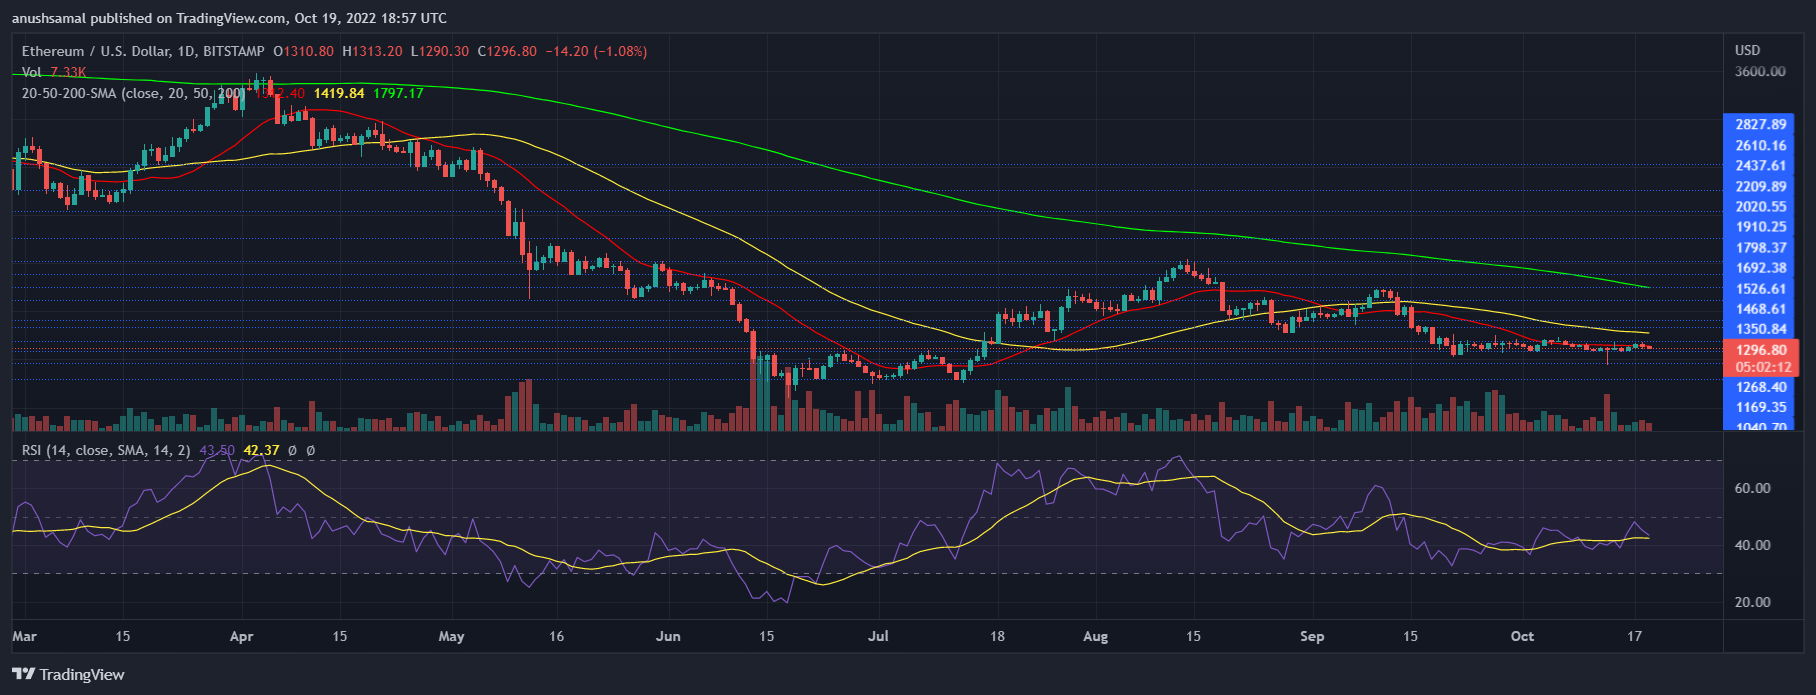
For most of this month, the altcoin has experienced low buying strength on its chart. The reason why it has been consolidating over the last few weeks. Demand continues to remain low for Ethereum.
The Relative Strength Index was below the half-line, which meant that buyers were leaving the market.
Additionally, the indicator also pictured a fresh decline in buying strength as it noted a downtick. Ethereum price was below the 20-SMA line, and that indicated less demand.
It also meant that sellers were driving the price momentum in the market.
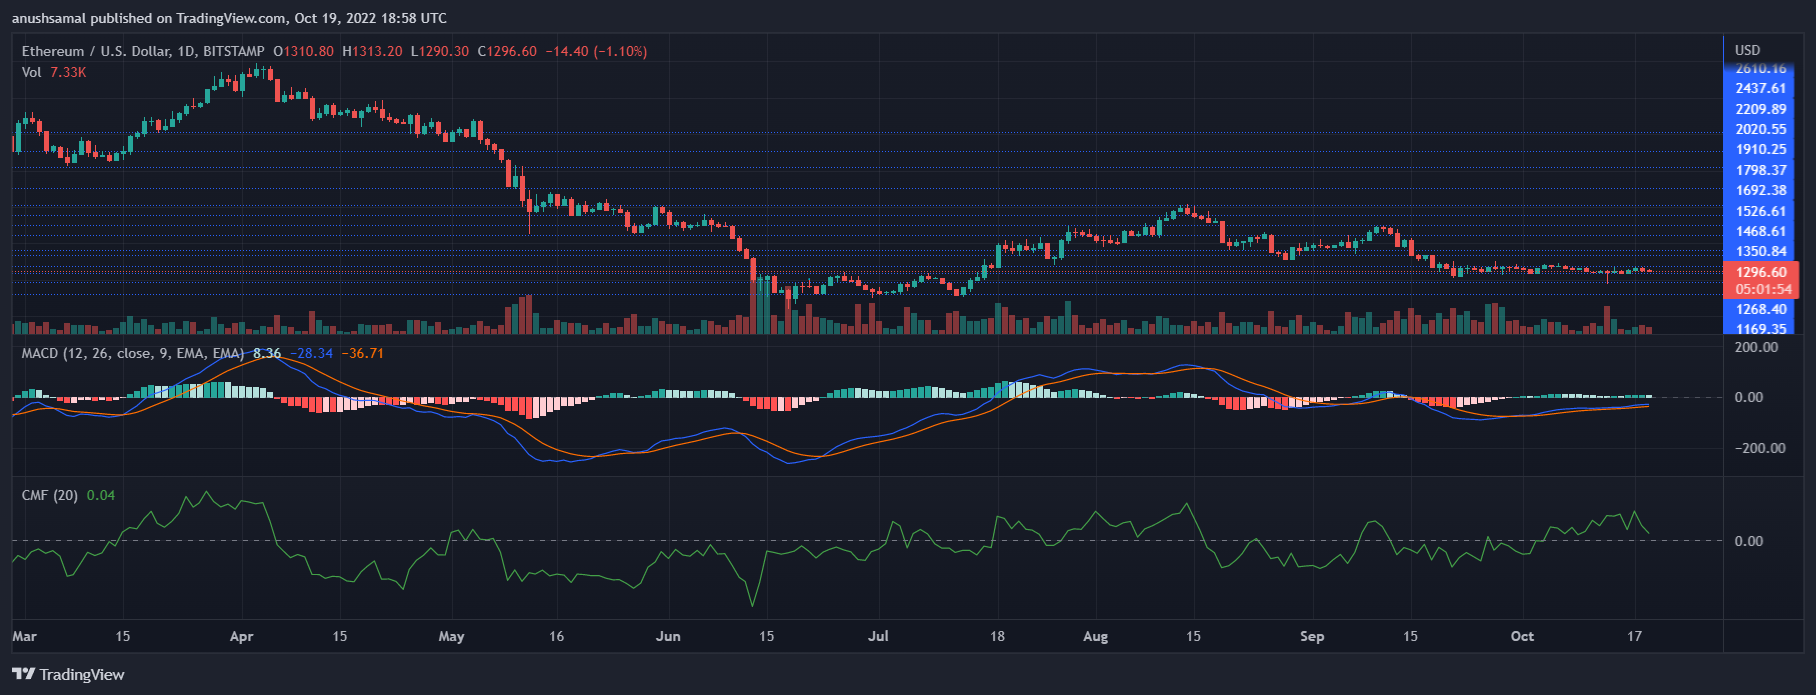
Technical indicators showed that the bears were in control. However, Ethereum price also portrayed buy signal on its chart. The Moving Average Convergence Divergence indicated price momentum and direction.
MACD continued to display green histograms as buy signal for the coin, this could mean that if buyers acted on it, the coin could log gains.
The Chaikin Money Flow measures the amount of capital inflows over capital outflows.
The CMF was still positive as the indicator was above the half-line. However, there was a downtick indicating that over the next trading sessions the indicator would turn negative.