On-chain data shows the Bitcoin whale ratio has surged up recently, as leverage in the market has remained around an all-time high value.
Both Bitcoin Whale And Leverage Ratios Are Around ATHs Right Now
As pointed out by an analyst in a CryptoQuant post, BTC investors are involved in some high-risk trading in the futures market currently.
The “exchange whale ratio” is an indicator that measures the ratio between the sum of the top ten inflows to exchanges, and the total exchange inflows.
Since the ten largest transfers to exchanges are assumed to be from the whales, this metric tells us about whether whales are active on the market right now or not.
When the value of the ratio is high, it means whales are making a big contribution to the exchange inflows at the moment.
Now, here is a chart that shows the trend in the Bitcoin whale ratio over the last few years:
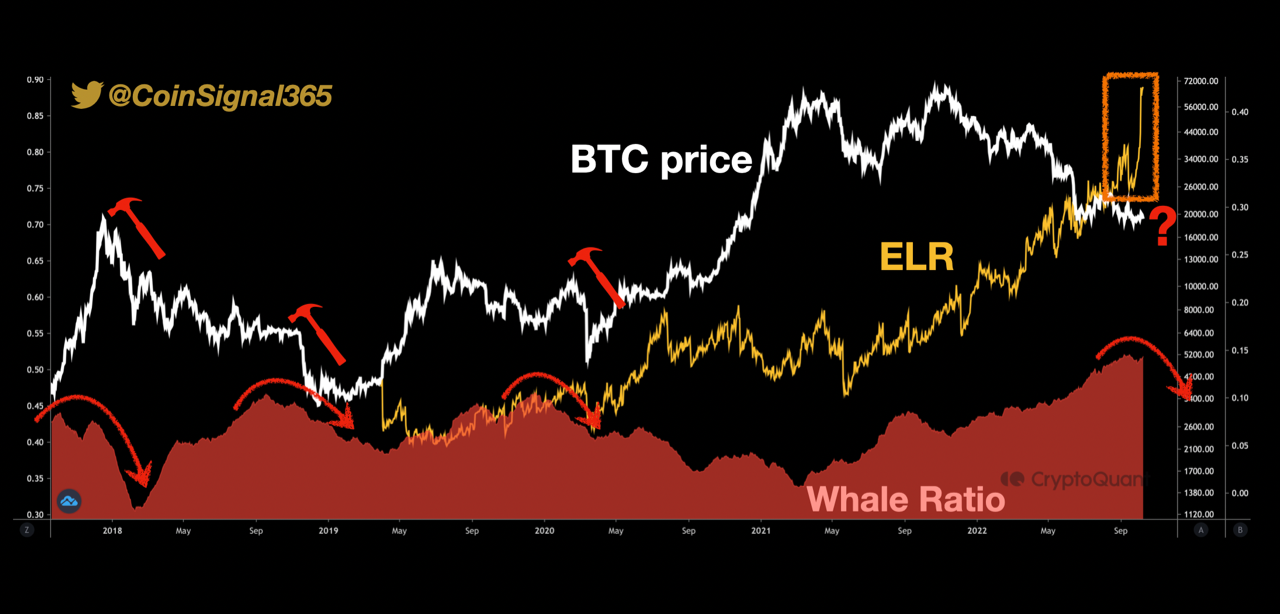
Looks like the value of the metric has been elevated in recent days | Source: CryptoQuant
As you can see in the above graph, the quant from the post has marked the relevant periods of trend for the Bitcoin exchange whale ratio.
It seems like usually whenever the indicator has hit a high and then subsequently started declining, the price has also taken a large hit.
From the chart, it’s apparent that the metric has risen up during recent months, and is now floating around all-time high values.
The data for the “estimated leverage ratio” is also displayed. This indicator tells us the amount of leverage being used by the average trader on the futures market.
The Bitcoin leverage ratio has very sharply surged up recently and is also at a new ATH now, suggesting that investors are taking a lot of risk at the moment.
High leverage in the market has historically resulted in a more volatile BTC price. Under these conditions, if the whale ratio also starts turning down and the same trend as in the past follows now as well, then things could get bearish very fast for the crypto.
BTC Price
At the time of writing, Bitcoin’s price floats around $19.5k, up 2% in the last seven days. Over the past month, the crypto has gained 1% in value.
The below chart shows the trend in the price of the coin over the last five days.

The value of the crypto seems to have been trending sideways since the plunge a few days back | Source: BTCUSD on TradingView