The crypto market is on the verge of closing another week this month on a bearish note. This suggests a strong selling pressure for the tokens in the market. Many reasons are being considered for the ongoing negative outlook, such as rising geopolitical tensions between multiple nations, unstable market conditions, and disruption of financial markets.
This has led to the price of Bitcoin losing momentum this week. On the other hand, the altcoin market has witnessed a similar price action as top cryptocurrencies have slit significant values from their respective portfolios. Where is the crypto market headed next week? Let’s dig into the answers.
Bitcoin Price Retests Its Pivotal Support Zone
With a drop of approximately 1%, the BTC price has approached its crucial support zone around the $102,500 in the daily time frame. This zone plays an important role as Bitcoin has successfully maintained its value above this range since May. Moreover, with a listing price of $102,616 and a trading volume of $34.235 billion, it has a dominance of 64.4432% with a market capitalization of $2.034 trillion.
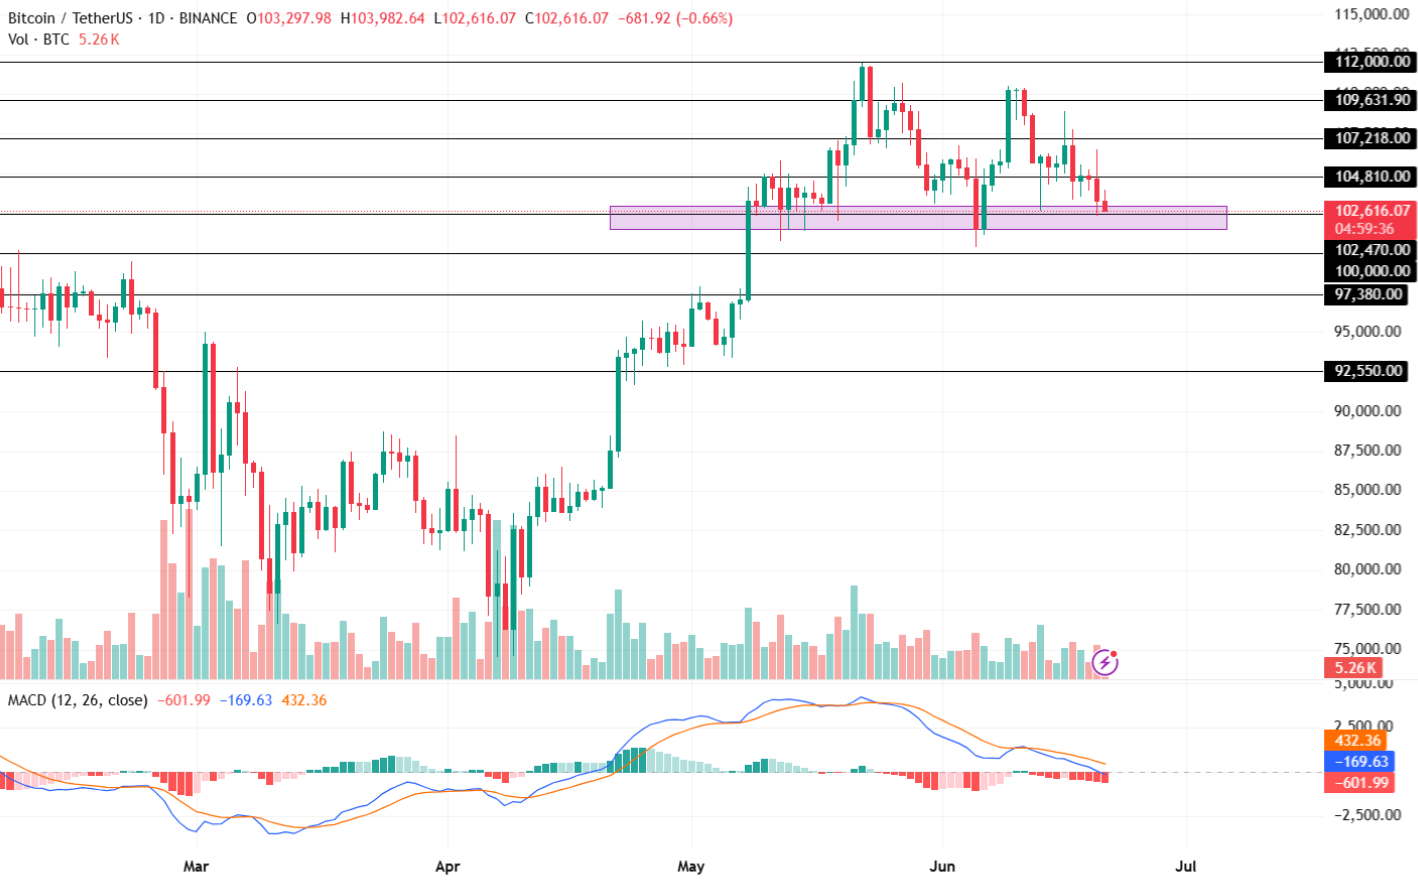
The Moving Average Convergence Divergence (MACD) indicator shows a rising red histogram in the daily time frame, suggesting increasing bearish momentum in the market. With its EMA 12 and 26-day recording a constant decline, the largest cryptocurrency may retest its lower support zones soon.
If the market holds the BTC price above $102,470, this could result in it retesting its upper price targets of $104,810 or $107,218 during the upcoming week. Conversely, increased selling pressure could lead the price toward its immediate support trend levels of $102,470 or $100,000 respectively.
Ethereum Price Crash to $2,200 Next Week?
After trading within a consolidated trend since 10th of May, the ETH price is once again hovering extremely close to its key support zone of $2,350. This price zone has acted as a strong support of the largest altcoin, however, amid the ongoing market sentiments, it could break down its support.
The ETH price is valued at $2,387 with a trading volume of $12.353 billion, a change of -38.06%. With this, the market cap of Ethereum price has dropped to $288.38 billion and a dominance of 9.0984%.
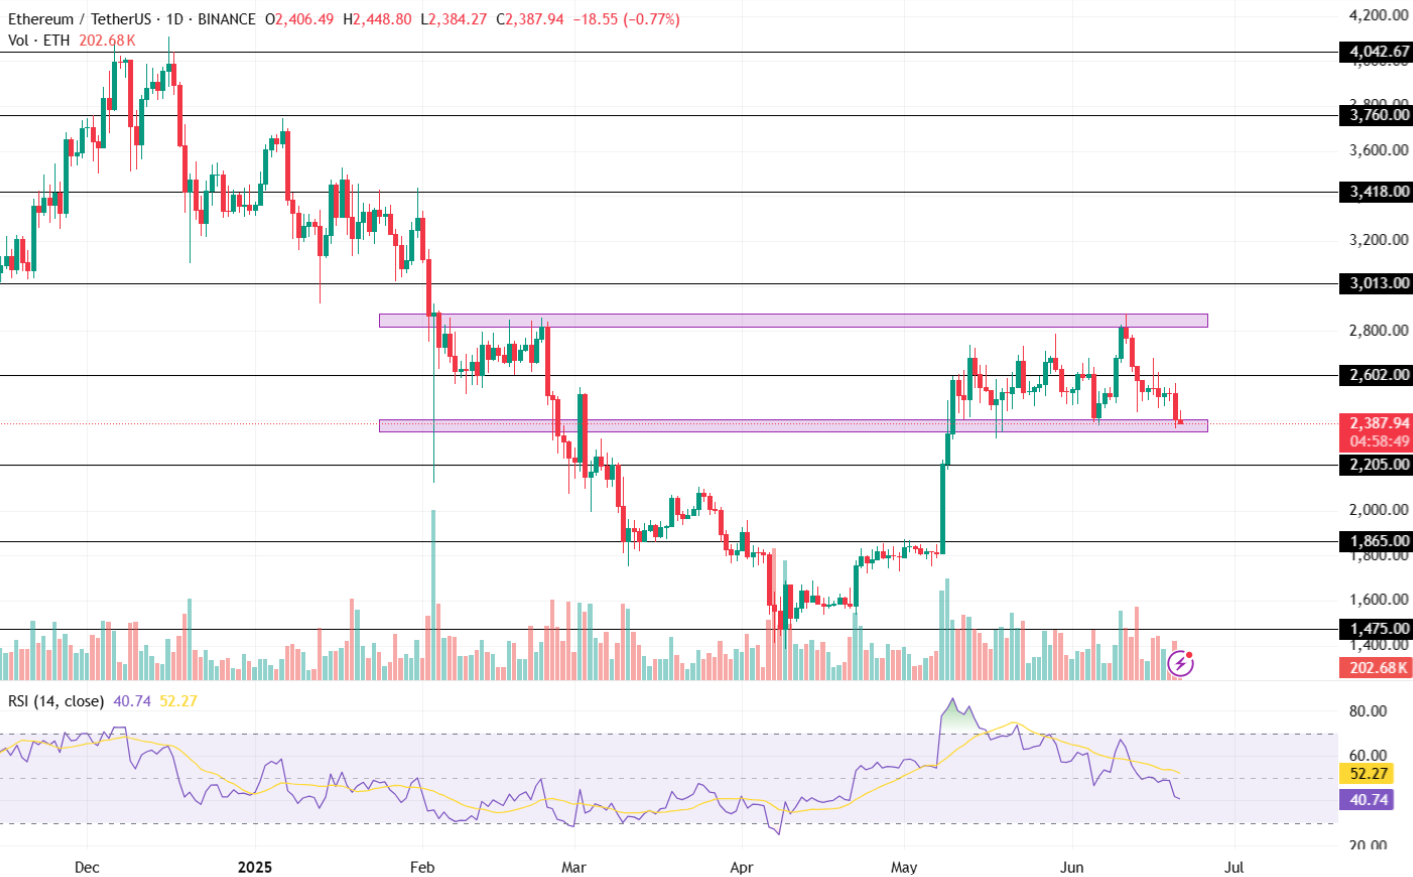
The Relative Strength Index (RSI) fails to hold its value above its neutral point (50), resulting in it recording a sudden drop. With a current value of 40.74, the technical sentiments suggest a further drop this week before a potential situation arises for a healthy bounceback.
Suppose the bulls rebuild momentum, the Ethereum price will retest its immediate target price of $2,600 that was last recorded on June 13. However, a retest to a multi-month low of $2,200 cannot be ignored as the bears continue dominating the cryptocurrency market.
XRP Price Witnesses Increased Liquidations
The XRP price has breached its important support level of $2.14 multiple times this month, highlighting a constant bearish presence. However, it has now formed a new imaginary support around the $2.08 mark, making it a potential reversal point for the altcoin.
Although a reversal angle is being built, the current market sentiments hints at a negative price target for the upcoming week. With a trading price of $2.08, its market cap stands at $122.189 billion.
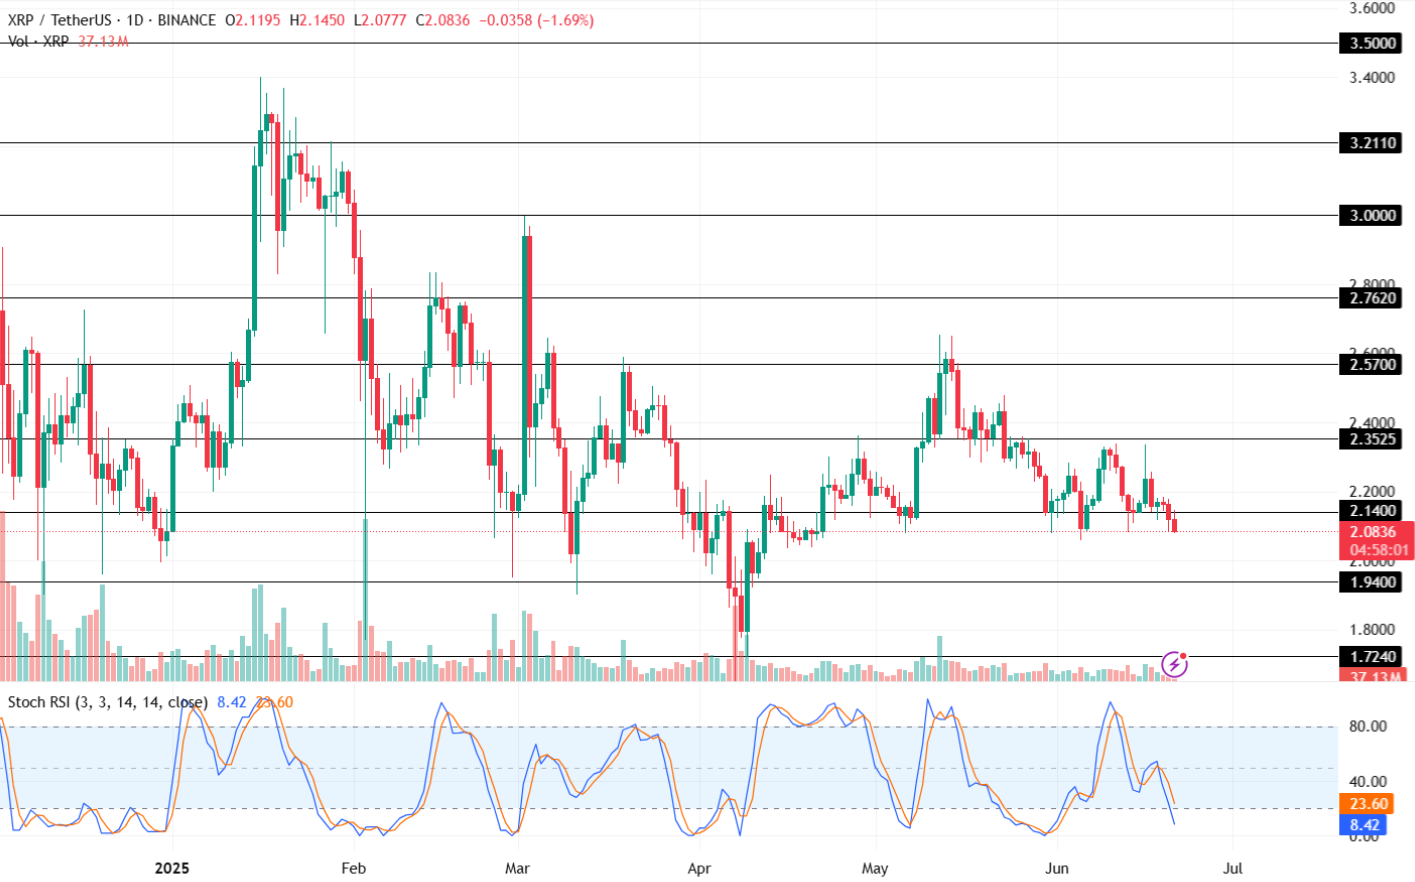
The Stochastic RSI indicator is retesting its oversold range today. Notably, the averages in the 3-day frame that are blue and orange show signs of extreme negative sentiment. While the orange trendline is just above the oversold range at 23.60, the blue trendline has plunged to 8.42 today.
If XRP price regains the value above the $2.14 level, this may set a base for it to retest its upper price targets of $2.35 or $2.57 next week. On the contrary, a rising bearish sentiment could pull the price of XRP token toward its crucial support of $2 or $1.94 soon.
Also Read: Crypto Price Today (June 21): Altcoins Drop! AB, VIRTUAL, SPX, UNI Crash 10%