Executive Summary
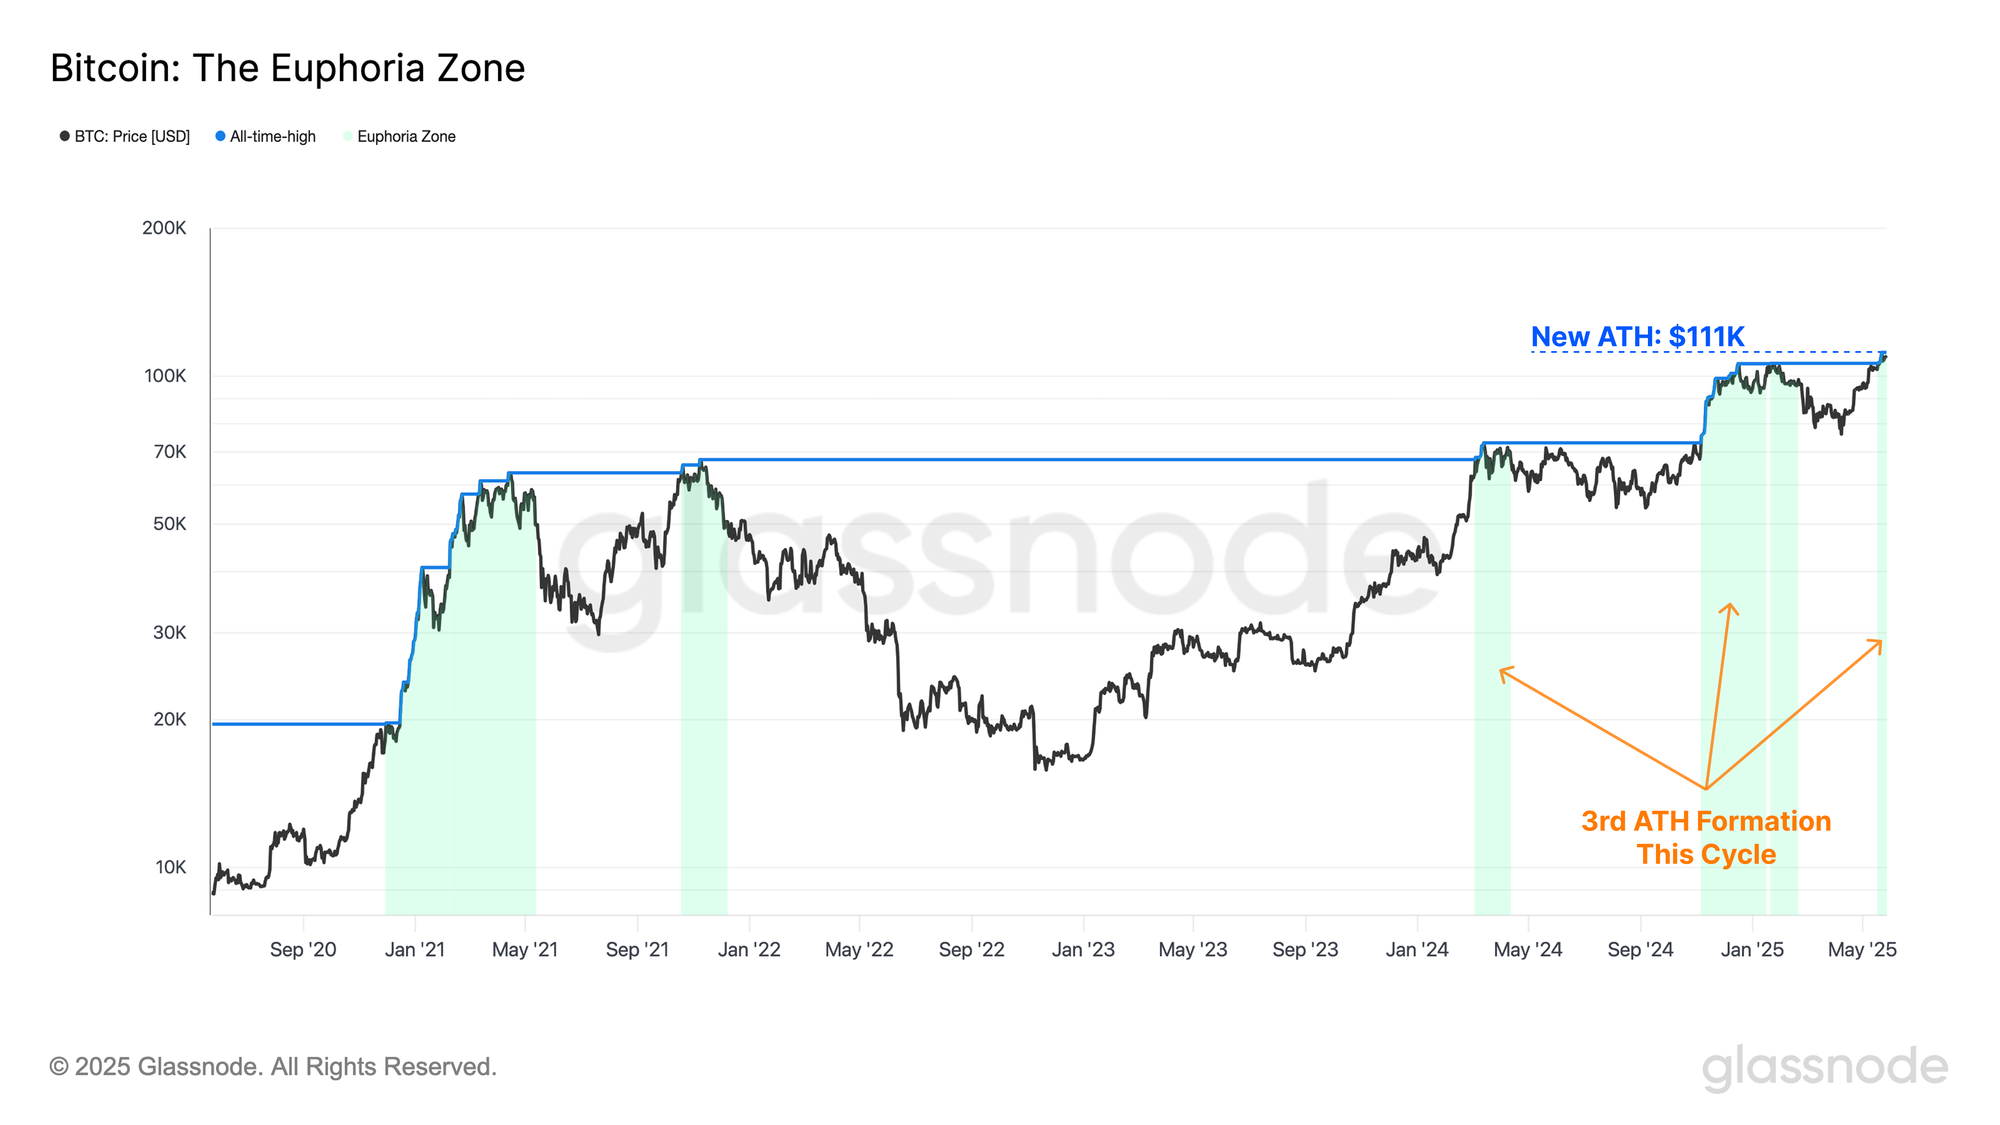
- Strength in the Bitcoin market persists, with the leading digital asset reaching a new ATH of $111k, and setting the third fresh ATH of this cycle.
- Investor profitability and spending behavior have both increased notably, and current levels remain below the extremes reached at prior bull market peaks.
- Exchange related interactions have risen substantially, with around 33% of total Bitcoin on-chain volume now passing through centralized trading venues.
- Activity is also increasing in the derivatives sector, where both futures and options markets are experiencing significant growth in open interest.
- In the event of further upside, the $120k level appears as a key zone of interest, with sell-side pressure expected to accelerate in and around this zone based on on-chain price models intersected in prior cycles.
Bitcoin Breaks to New ATHs
Strength in the Bitcoin market remains firm, with the leading digital asset reaching a new all-time high of $111k, marking the third major ATH break of this cycle. Historically, price discovery phases are often followed by brief sell-offs, as early profit-takers seize the opportunity to exit and de-risk at new highs.
Bitcoin has thus far followed this pattern, with the price pulling back to $107k shortly after the initial breakout, before recovering to consolidate around the $108k level for the rest of the week.
Bitcoin is outperforming most asset classes amidst an environment of challenging macro economic conditions, and geopolitical tensions, making the broader outlook remarkably uncertain. This robust performance is a truly fascinating signal amidst relatively challenging market conditions.
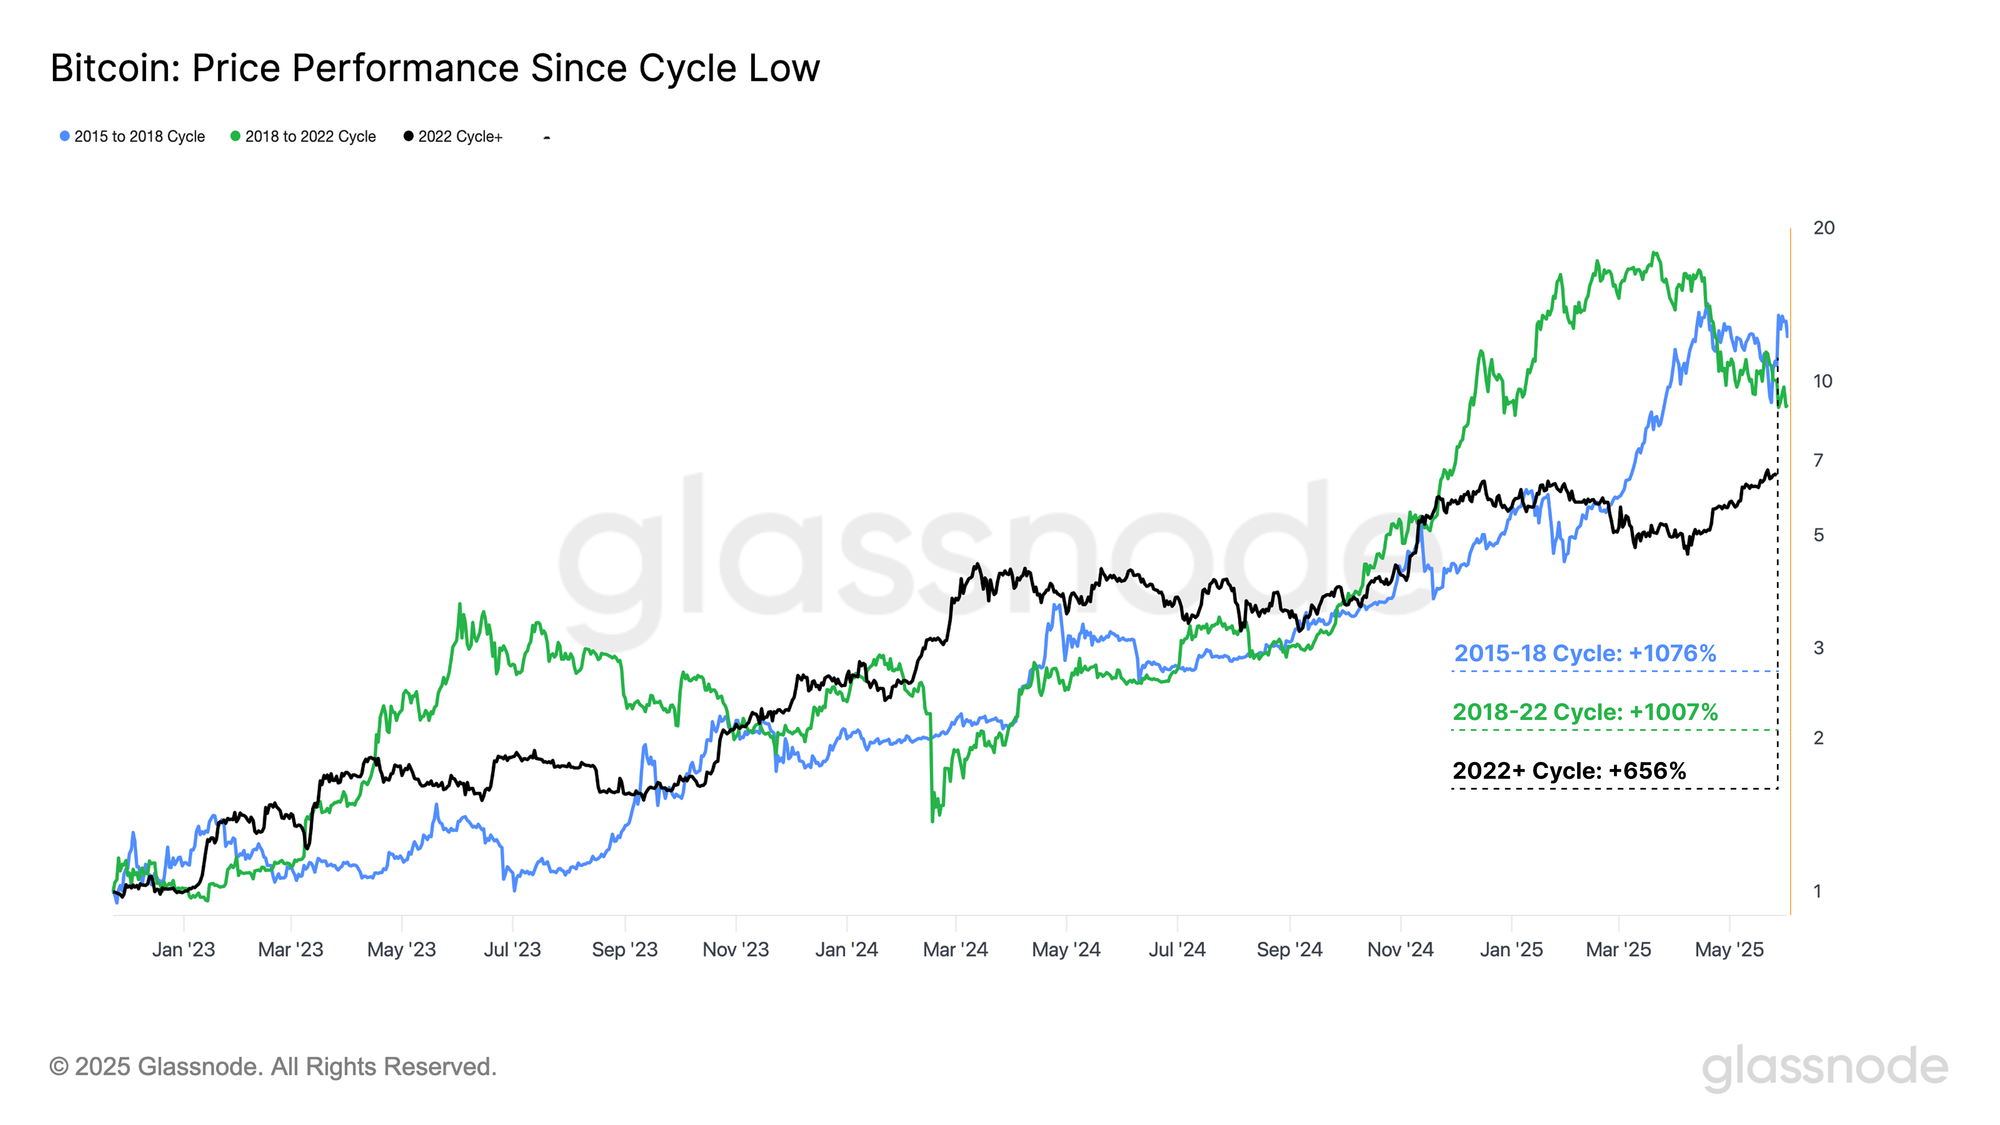
When we compare the price performances of the current cycle, to prior ones, we can see a surprising similarity in structure, despite Bitcoin being orders of magnitude larger in total Market Cap size. The chart below presents the index performance since the relative cycle low:
- 2015-2018 Cycle: +1076%
- 2018-2022 Cycle: +1007%
- 2022+ Cycle: +656%
It is a remarkable feat for Bitcoin to be tracking so closely to previous cycles when accounting for the significantly larger market capitalization today. This suggests that the scale of demand for Bitcoin is keeping pace with the growth rate of the asset.
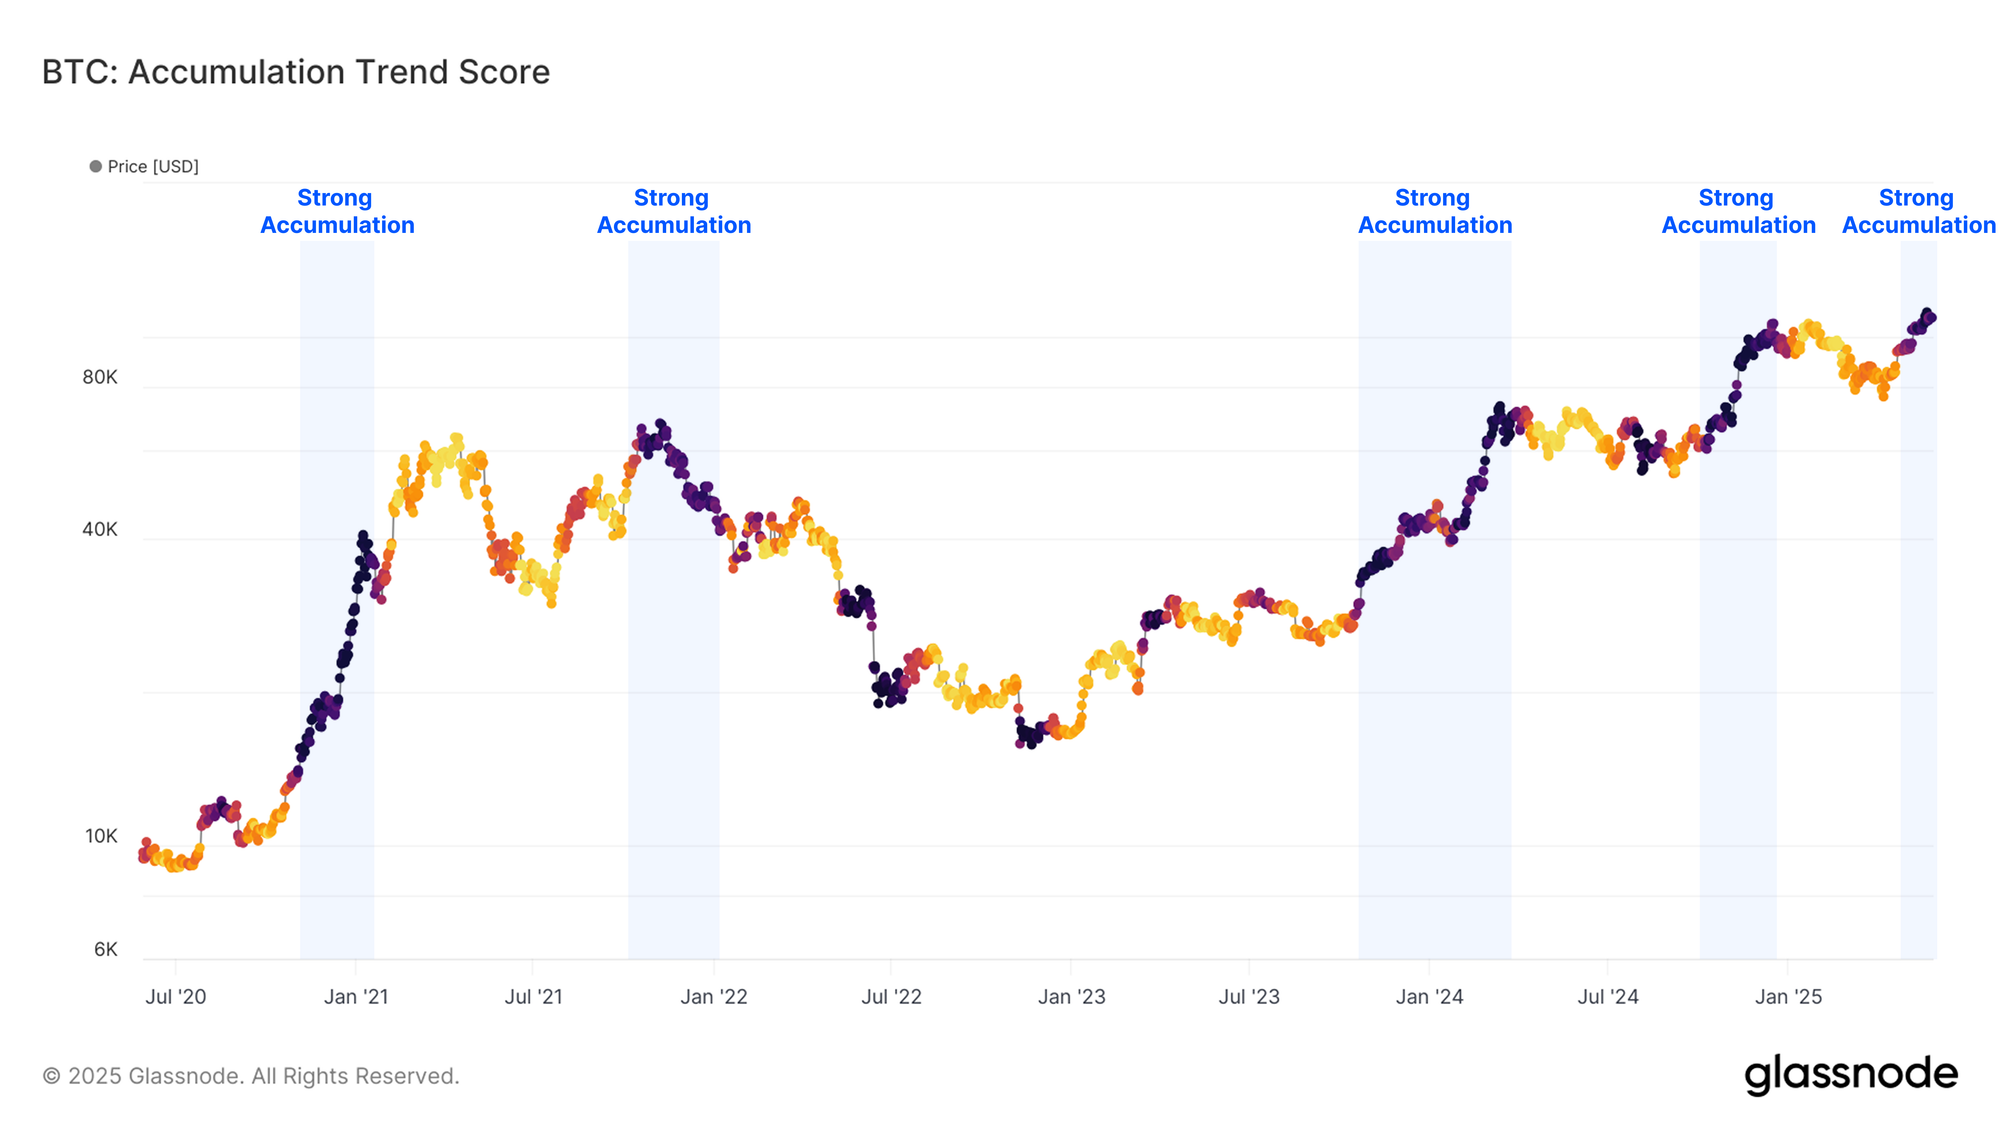
We can assess the accumulation patterns across various wallet sizes, and can see that new ATH tends to inspire a meaningful uptick in accumulation. This drives the Accumulation Trend Score up towards its highest value of 1.0.
Notably, elevated accumulation pressure has been observed during both the $70k, and $107k ATHs set in March, and November 2024. This underscores the tendency for investors to buy heavily when the market enters price discovery, but also the propensity for existing holders to take profit at higher prices. This "herd mentality" highlights market participants converging around key psychological levels and events, such as ATH break-outs.
In contrast, last cycle’s $69k ATH set in November 2021 saw strong accumulation pressure into, and long after the peak price was established. This ultimately marked the cyclical top, and preceded a prolonged bear market in 2022. While robust accumulation is generally a constructive signal, it is important to recognize that overwhelming consensus behavior is not always a reliable indicator of future direction (and can in fact be a contrarian one).
Profits Heating Up
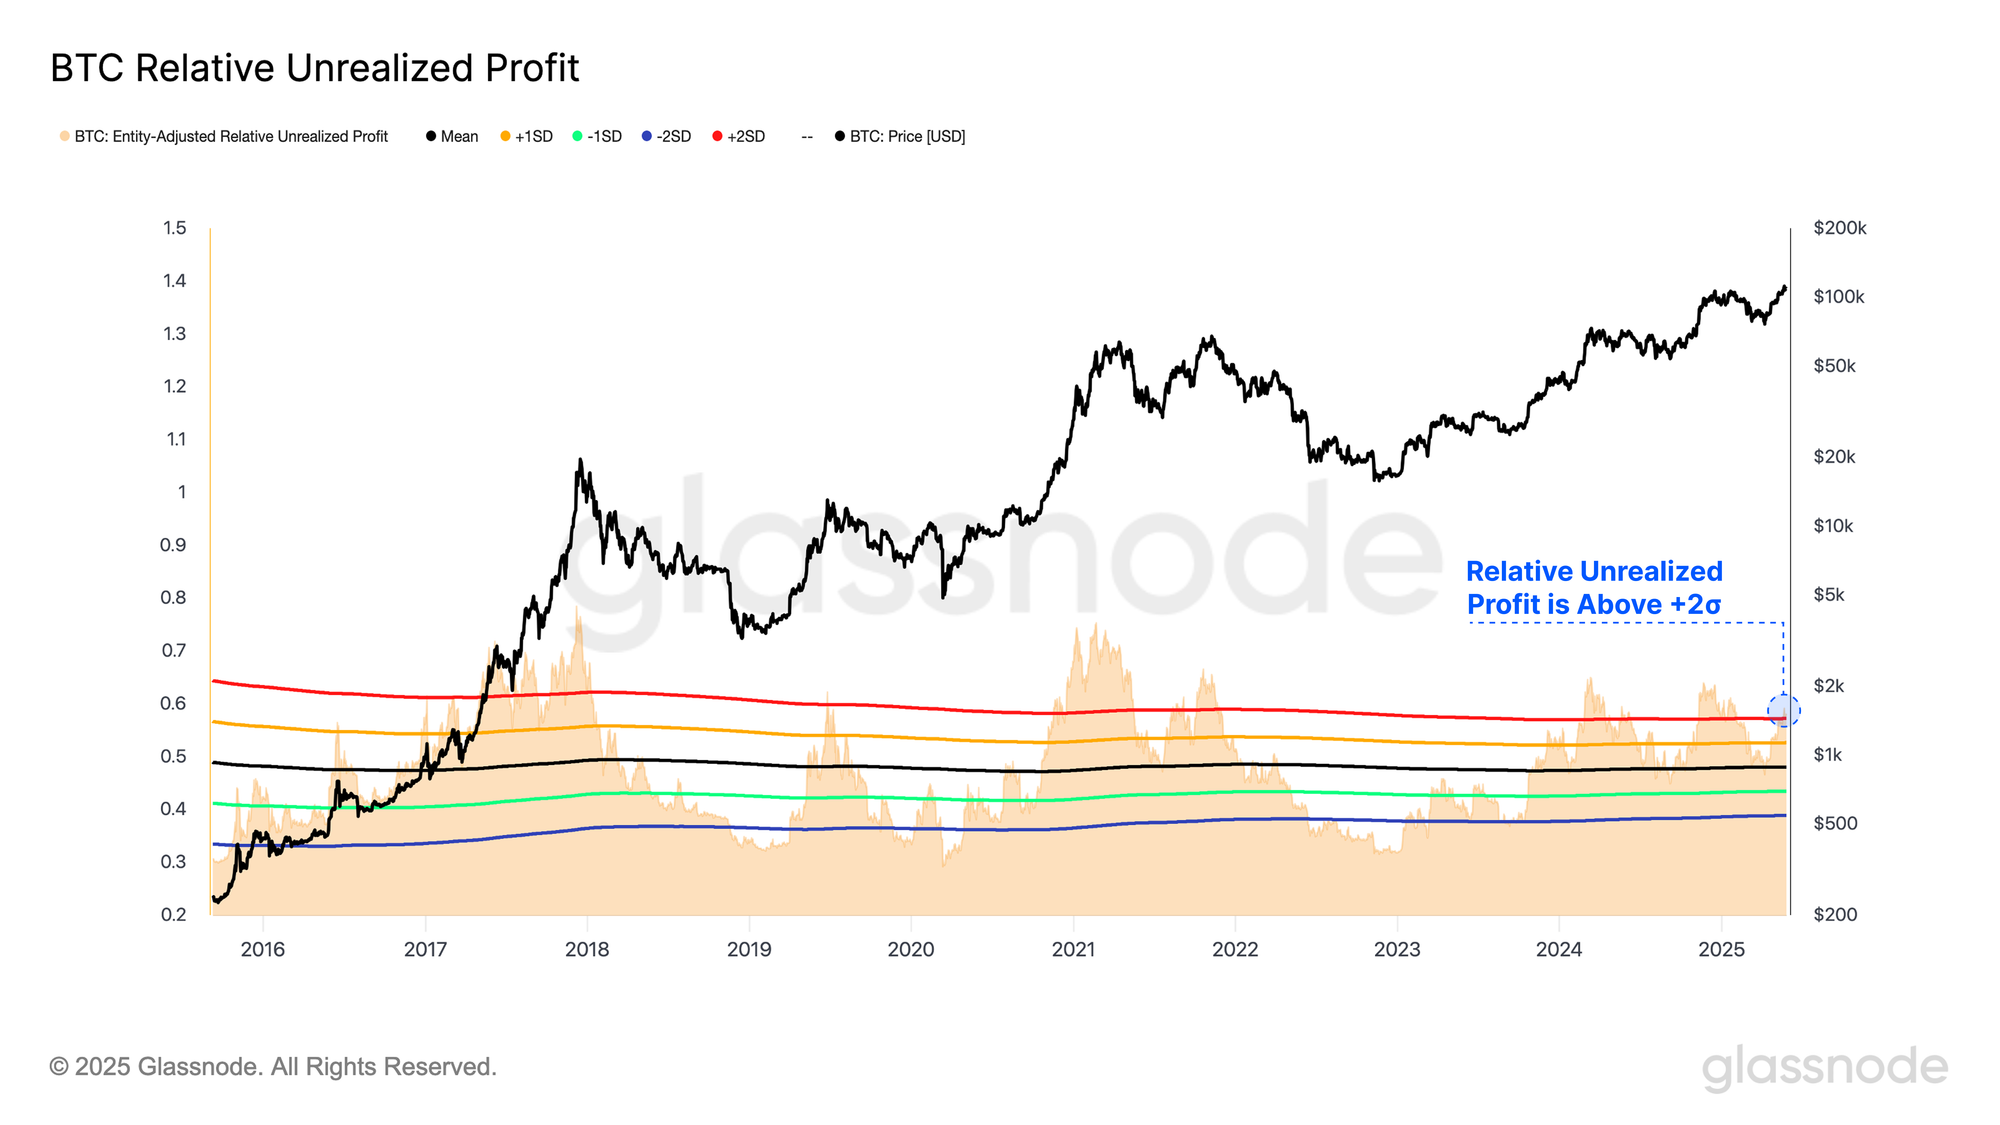
As the market re-enters a period of price discovery, the unrealized profit held by market participants has surged higher. As investor profitability grows, we usually expect an uptick in sell-side pressure in response. As the price rises, larger volumes of buy-side demand are required to absorb the distributed coins in order for the market to sustain upwards momentum.
The Relative Unrealized Profit metric serves as a valuable tool to gauge the magnitude of paper profits held across the market. Currently, this metric is breaking above its +2σ band, a level that has historically aligned with the market entering a euphoric phase. These environments are usually characterized by heightened volatility, and tend to be brief in duration, with only 16% of all trading days seeing paper profits above this level.
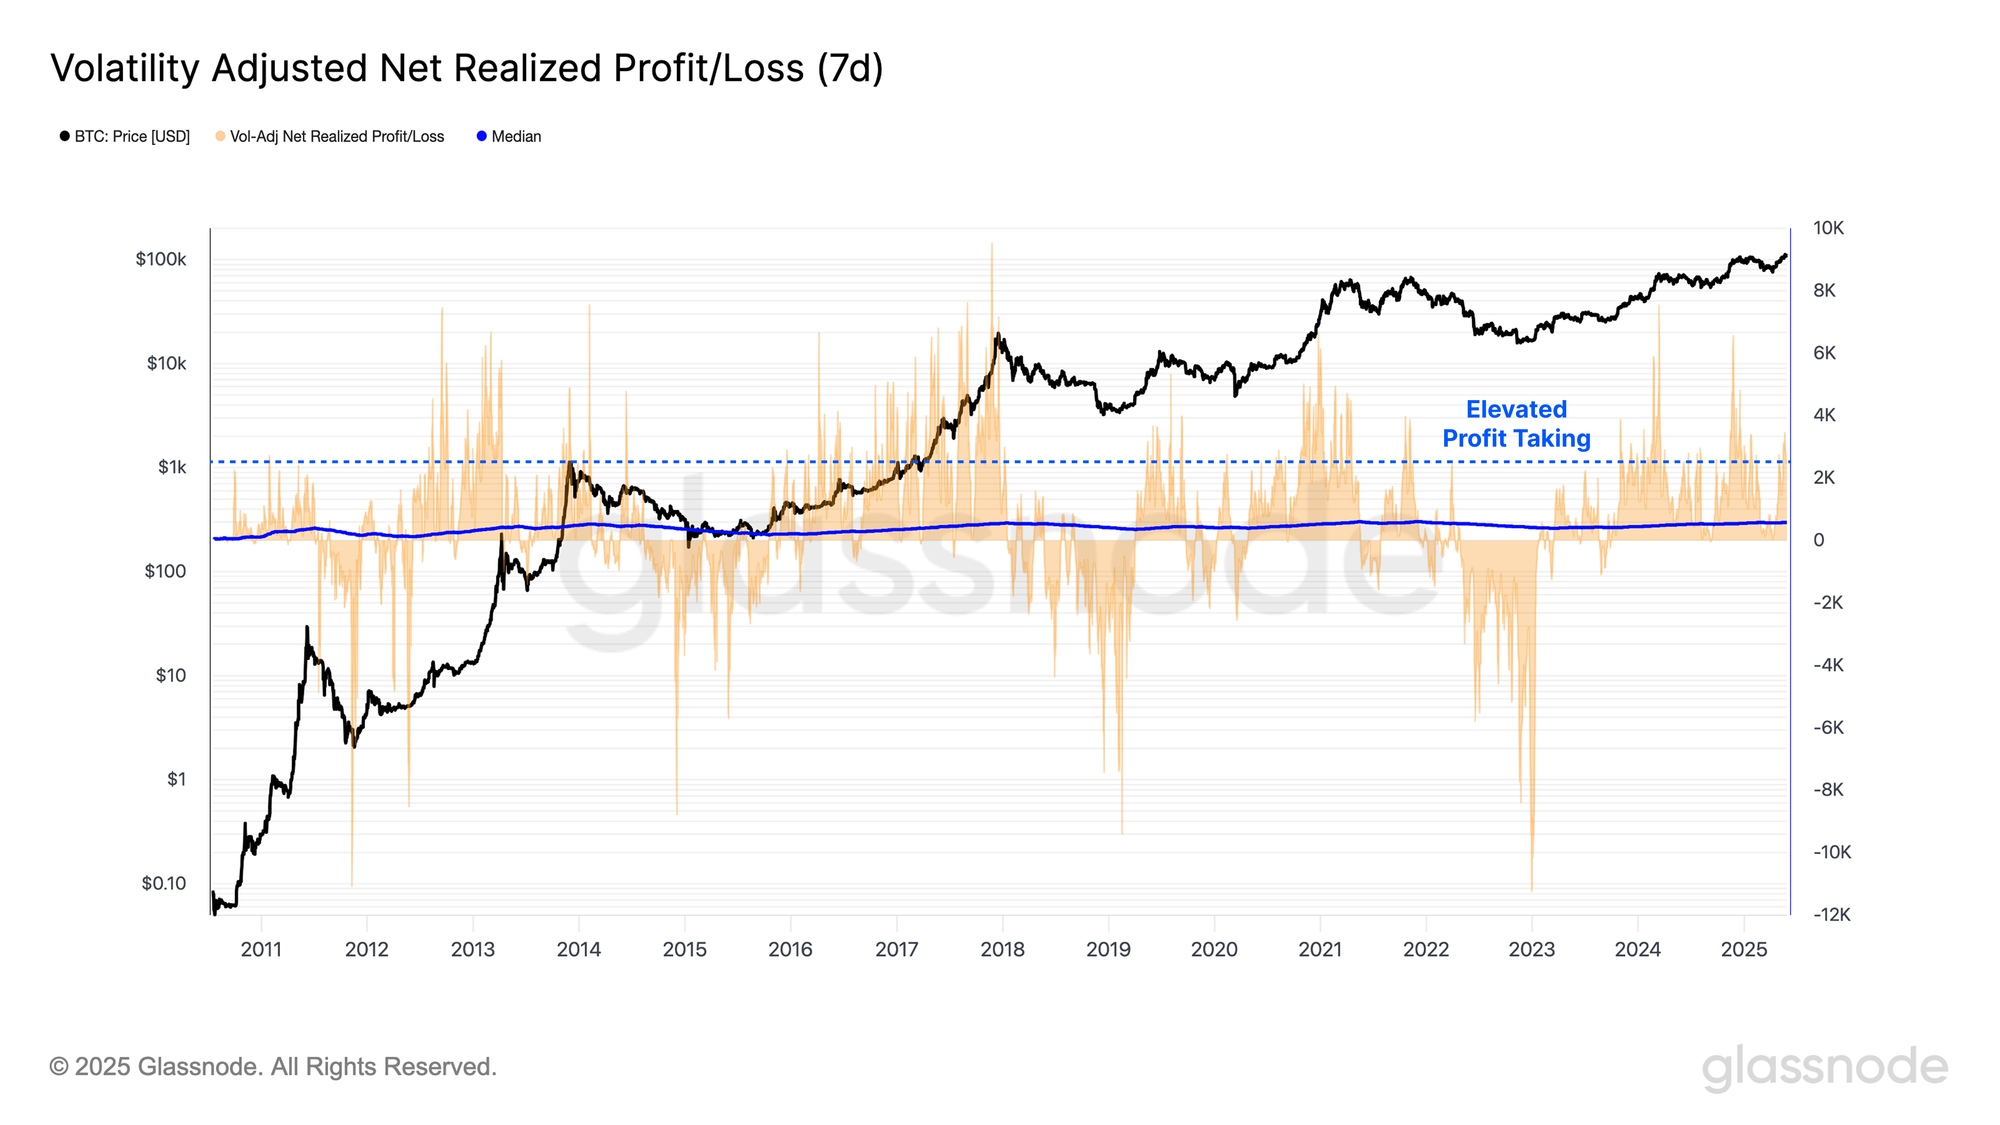
In response to these extremely profitable conditions, there has been a distinct increase in profit taking activity, which can be observed via the Volatility-Adjusted Net Realized Profit/Loss metric.
This metric measures realized profit and loss in BTC terms which normalizes it relative to Bitcoin’s growing market cap across cycles. It is further refined by adjusting for 7-day realized volatility, to account for Bitcoin’s diminishing returns and slower growth rate as the asset matures.
As price rallied through the previous ATH, a notable uptick in profit-taking was recorded, with only 14.4% of days recording higher values. This suggests profit-taking has increased, but has not yet reached extreme levels.
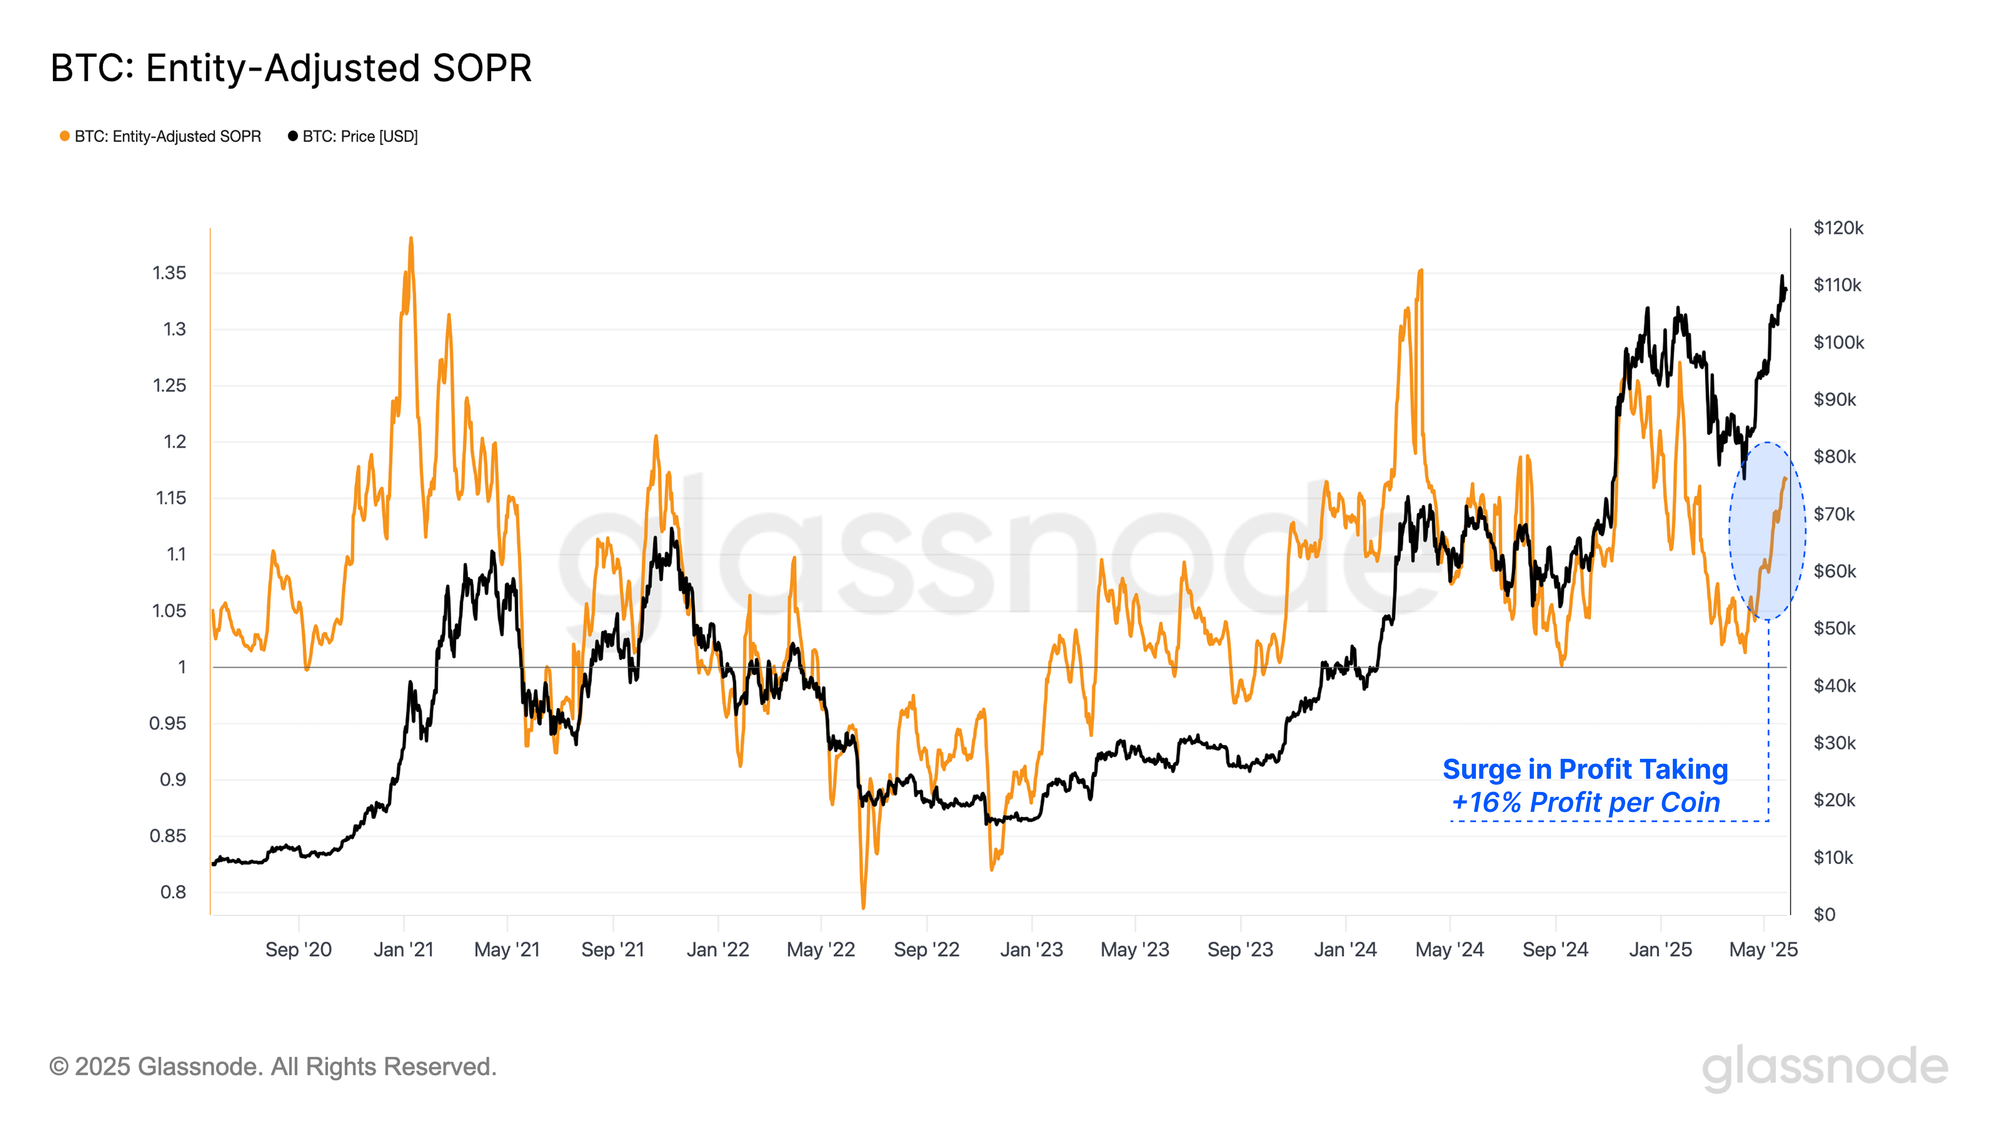
This observation is also reflected in the SOPR metric, which assesses the average profit or loss multiple locked in by investors who are spending coins on-chain. The recent ATH breakout has led to a notable uptick in profits locked in, with the average coin capturing a +16% profit. Fewer than 8% of trading days have been more profitable for investors, suggesting a meaningful transition into profit taking activity is underway. However, we are yet to reach the truly euphoric heights seen during prior major price topping formations.
Exchange Activity Increases
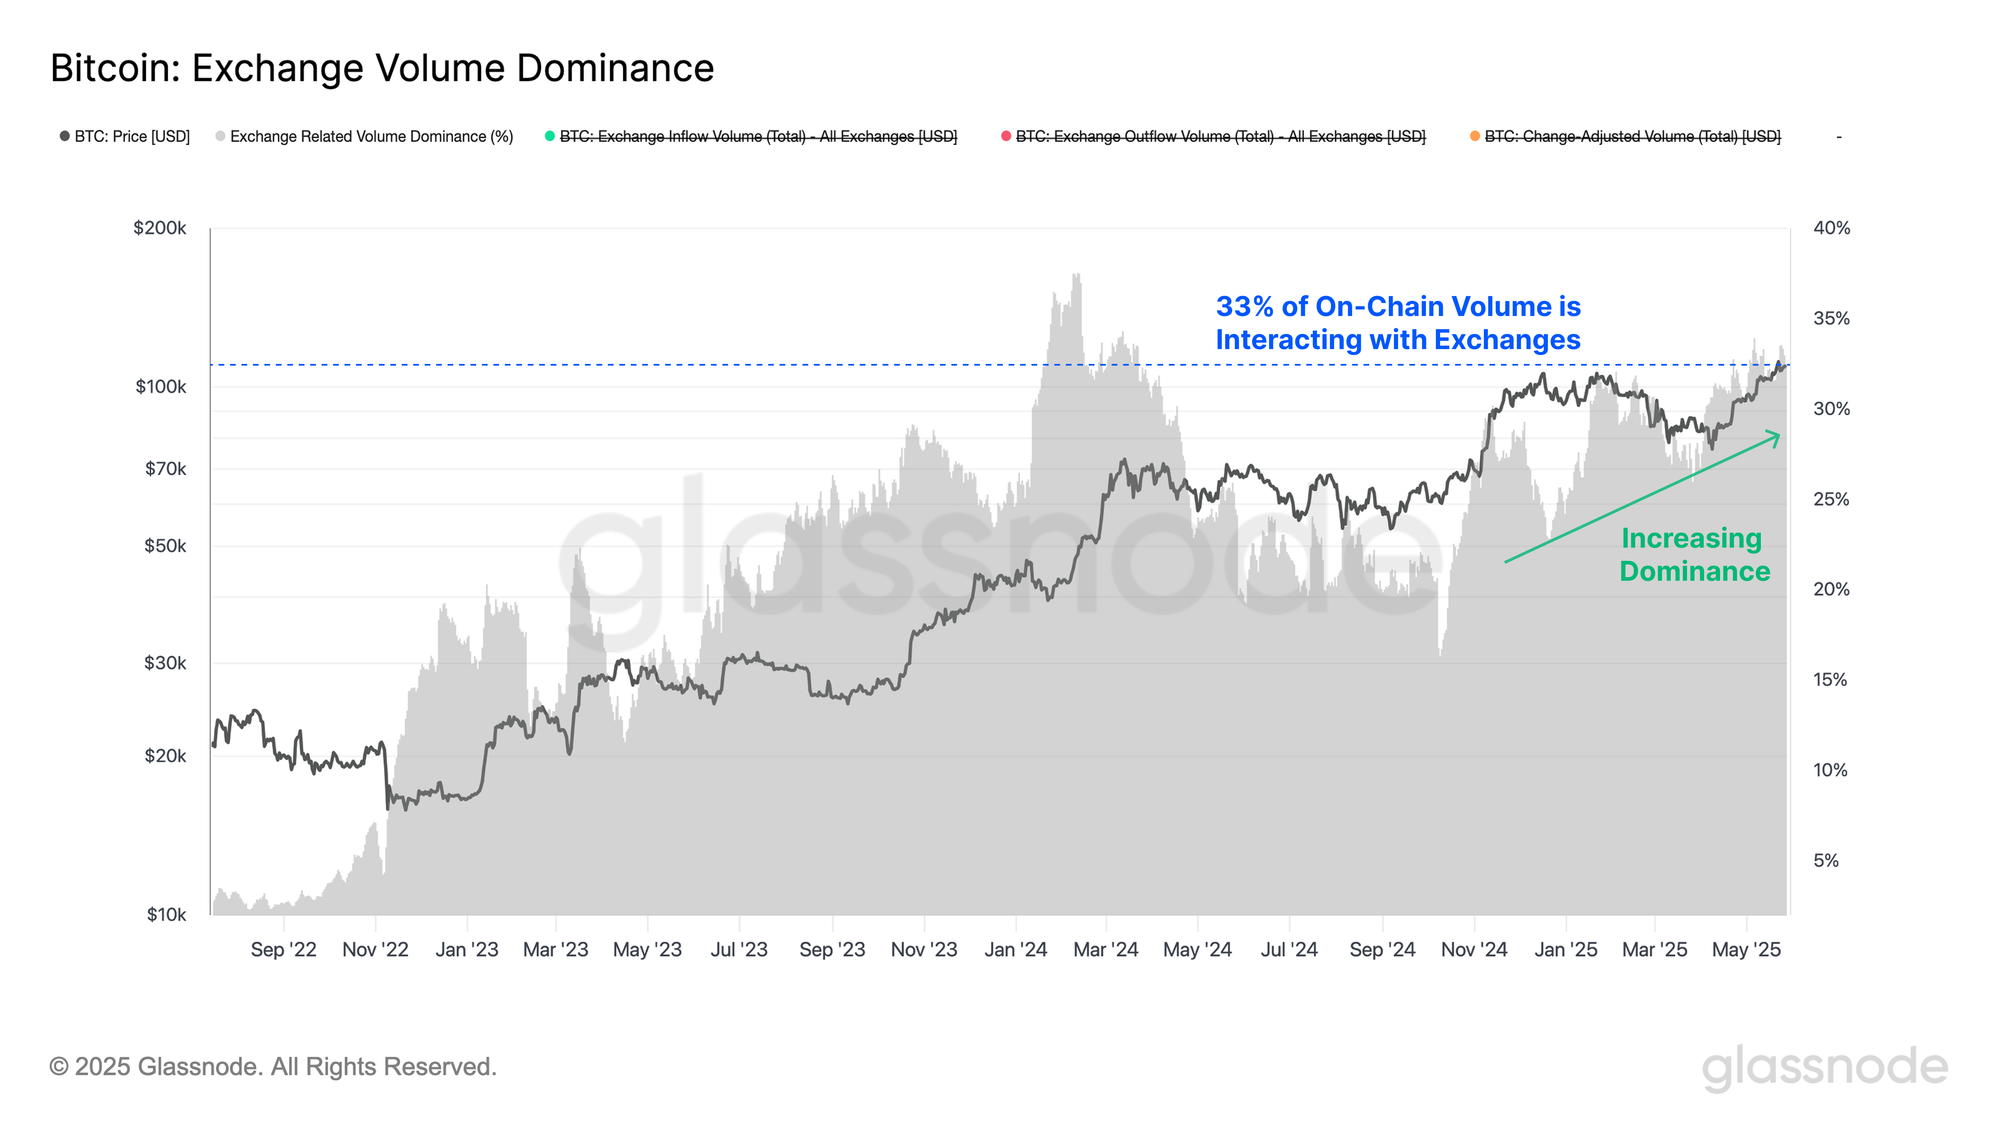
Centralized exchanges remain the primary venue for trade and speculation, with $4B-$8B flowing in and out on any given day. The volume of deposits and withdrawals to exchanges can be compared to the total volume settled on-chain, providing a tool for assessing the appetite of investors to trade Bitcoin.
This Exchange Volume Dominance metric has been on the rise since the $109k ATH set in early 2025, and has continued to climb as the market rallied. Around 33% of all volume transacted on the Bitcoin network is currently interacting with centralized exchanges.
This marks a notable uptick in investor demand and trading activity, aligned with the market entering a new phase of price discovery.
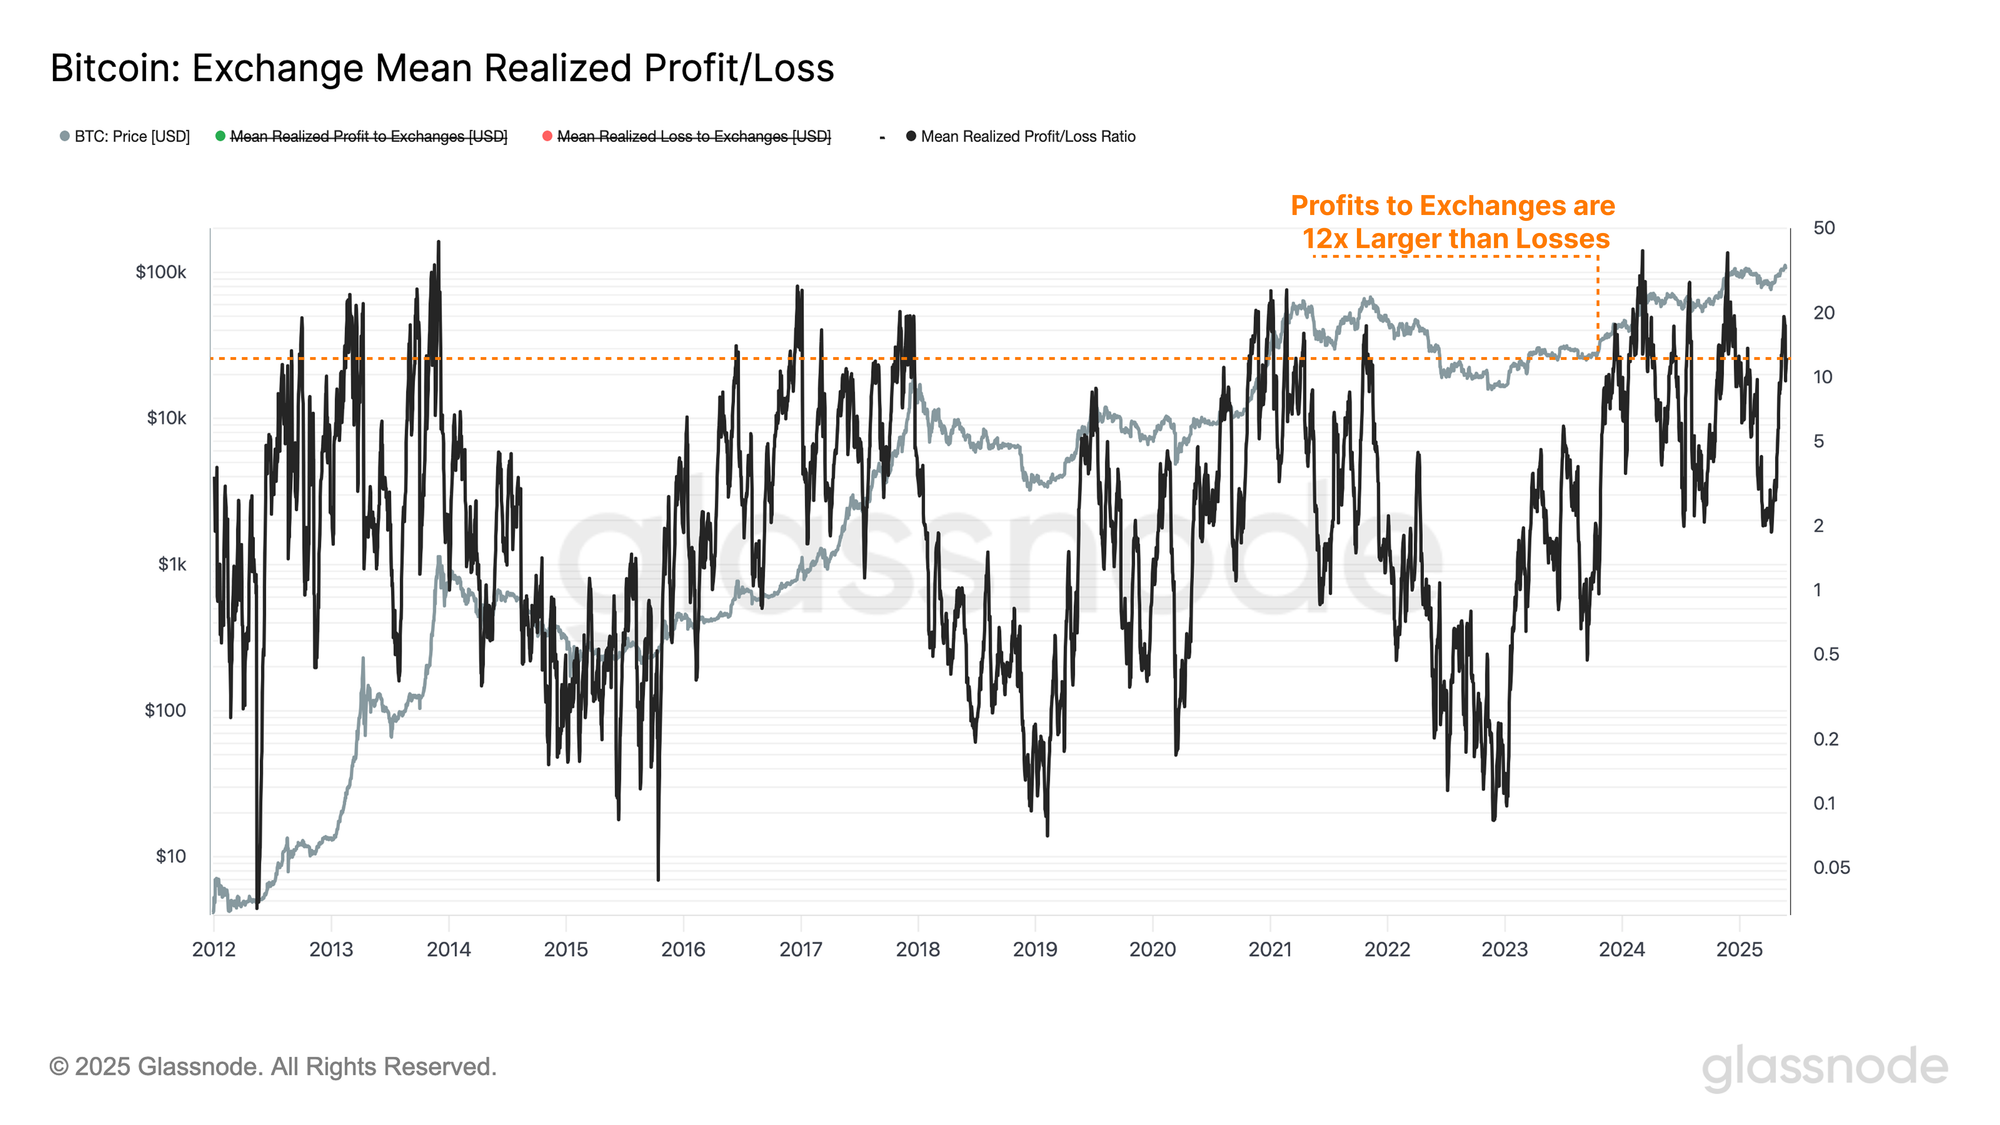
By combining on-chain pricestamping of coins, with Glassnode’s labels for centralized exchange addresses, we can estimate the average profit or loss for coins which are deposited to exchanges. This provides more granular insight into investor sentiment and spending behavior directly associated with exchange activity.
The average coin deposited to exchanges is currently realizing a profit of approximately +$9.3k, while coins moving at a loss are realizing an average loss of just -$780. This divergence indicates that the current spending behavior is overwhelmingly profit-driven, reflecting a notable improvement in investor sentiment.
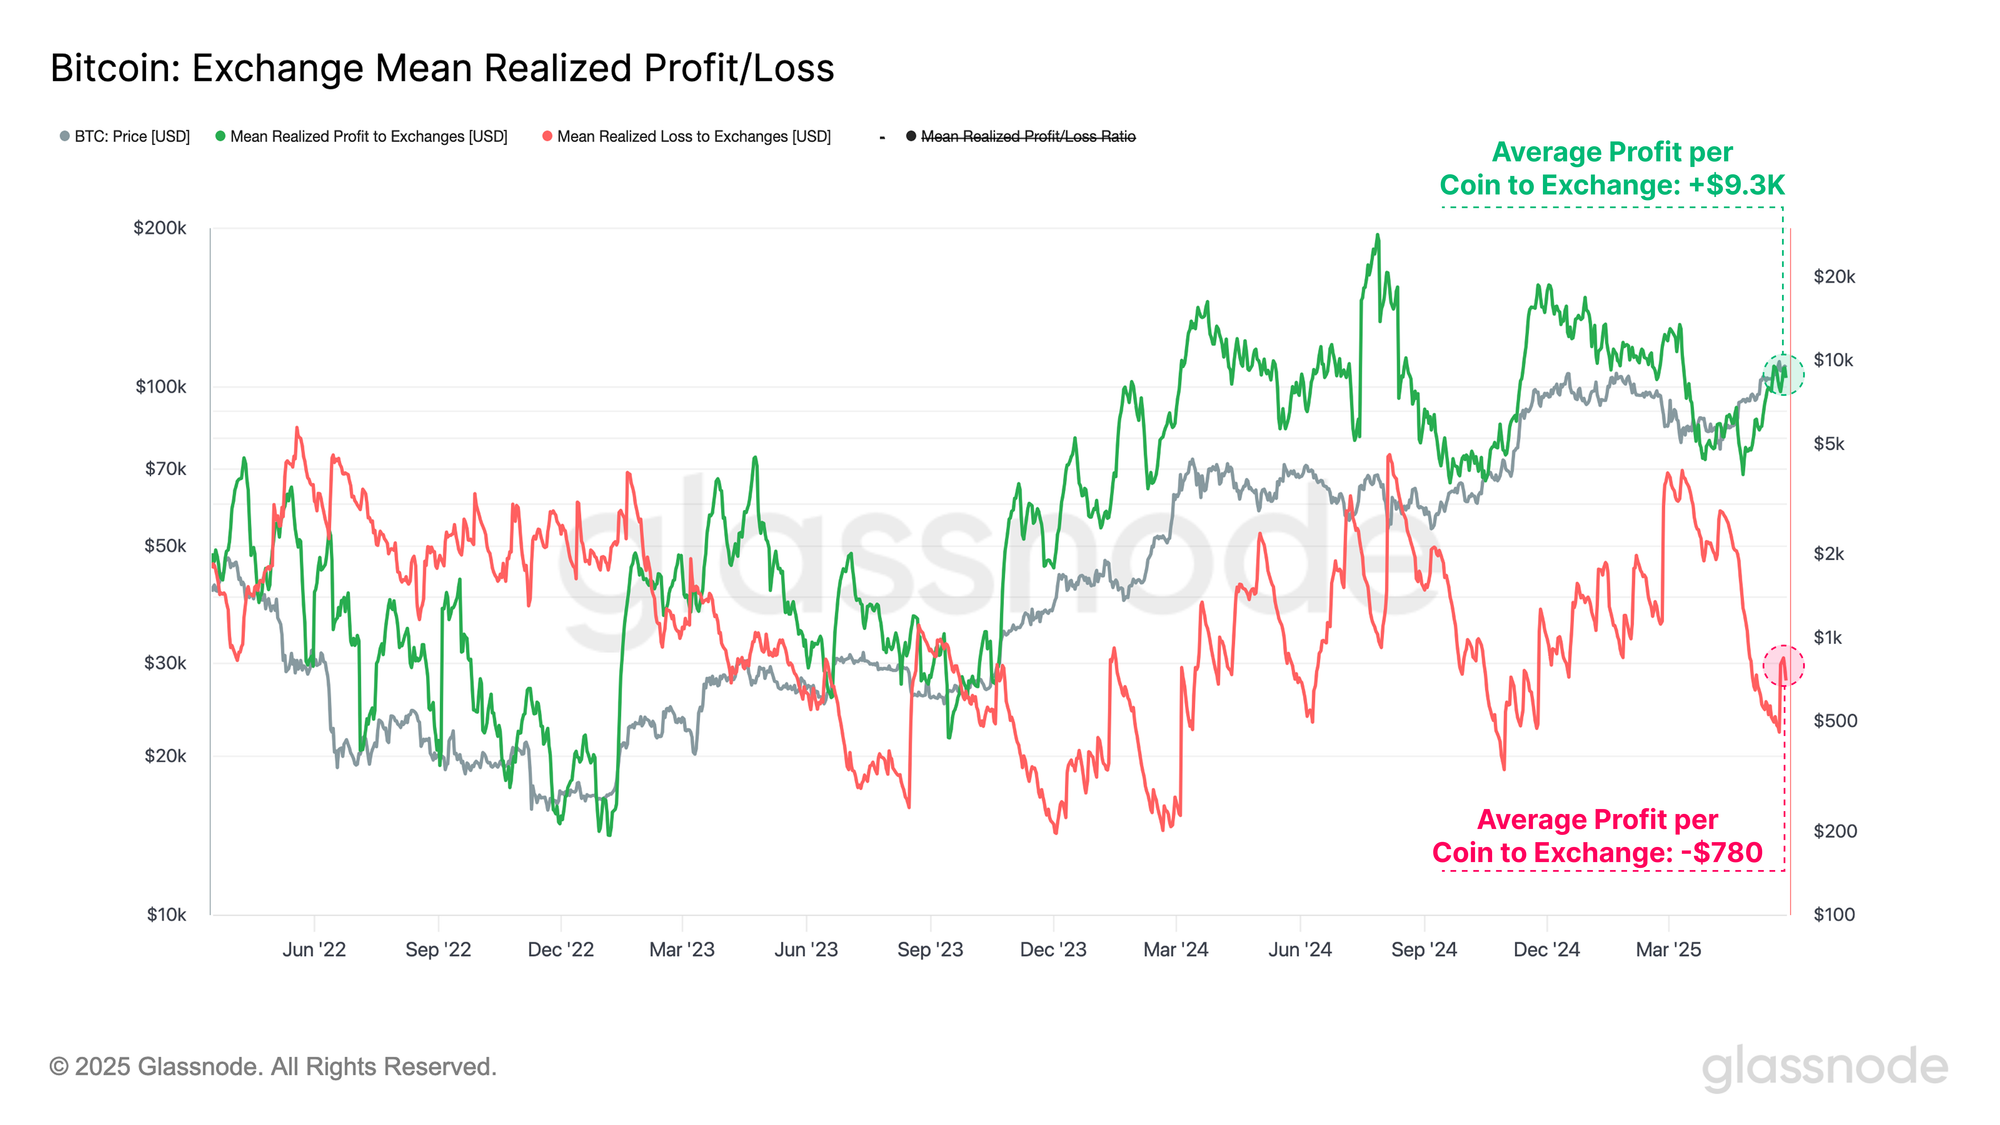
This places the average profit at 12x larger than losses, which is pushing the ratio between the two near the extremes often seen in the most energetic stages of prior bull markets. The extreme level of this Exchange Mean Profit/Loss Ratio provides an additional layer of confluence that we are entering the euphoric phase of the bull market.
Derivatives Lever Up
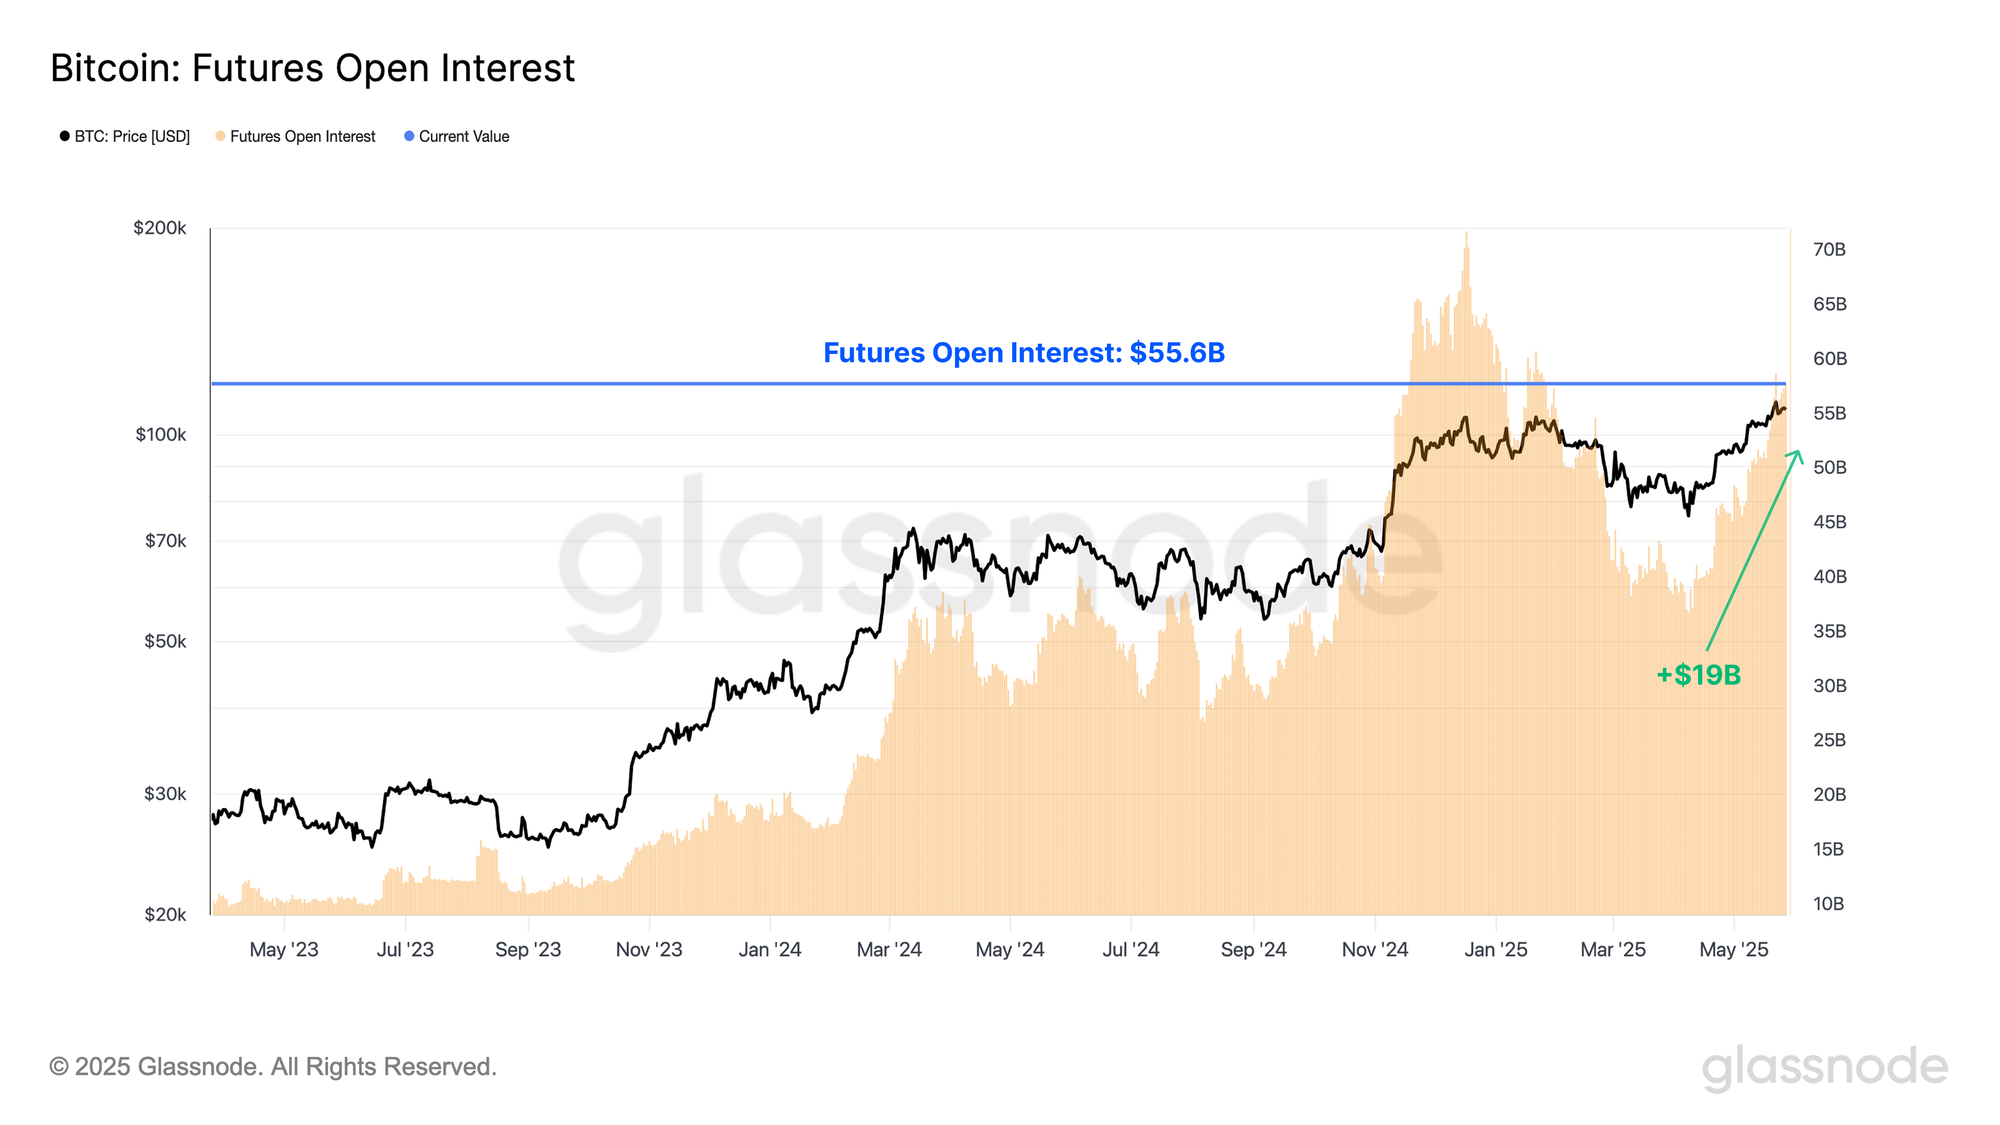
With activity rising on centralized exchanges, it becomes increasingly important to examine the derivatives landscape as well, offering insight into the build up of leverage which often accompanies bullish environments.
Open interest for futures contracts has seen marked growth since the $74k local low in April, expanding from $36.8B, to a current value of $55.6B. This reflects a +$19B increase (+51%) over the last 49 days alone, suggesting a build up of leverage is underway.
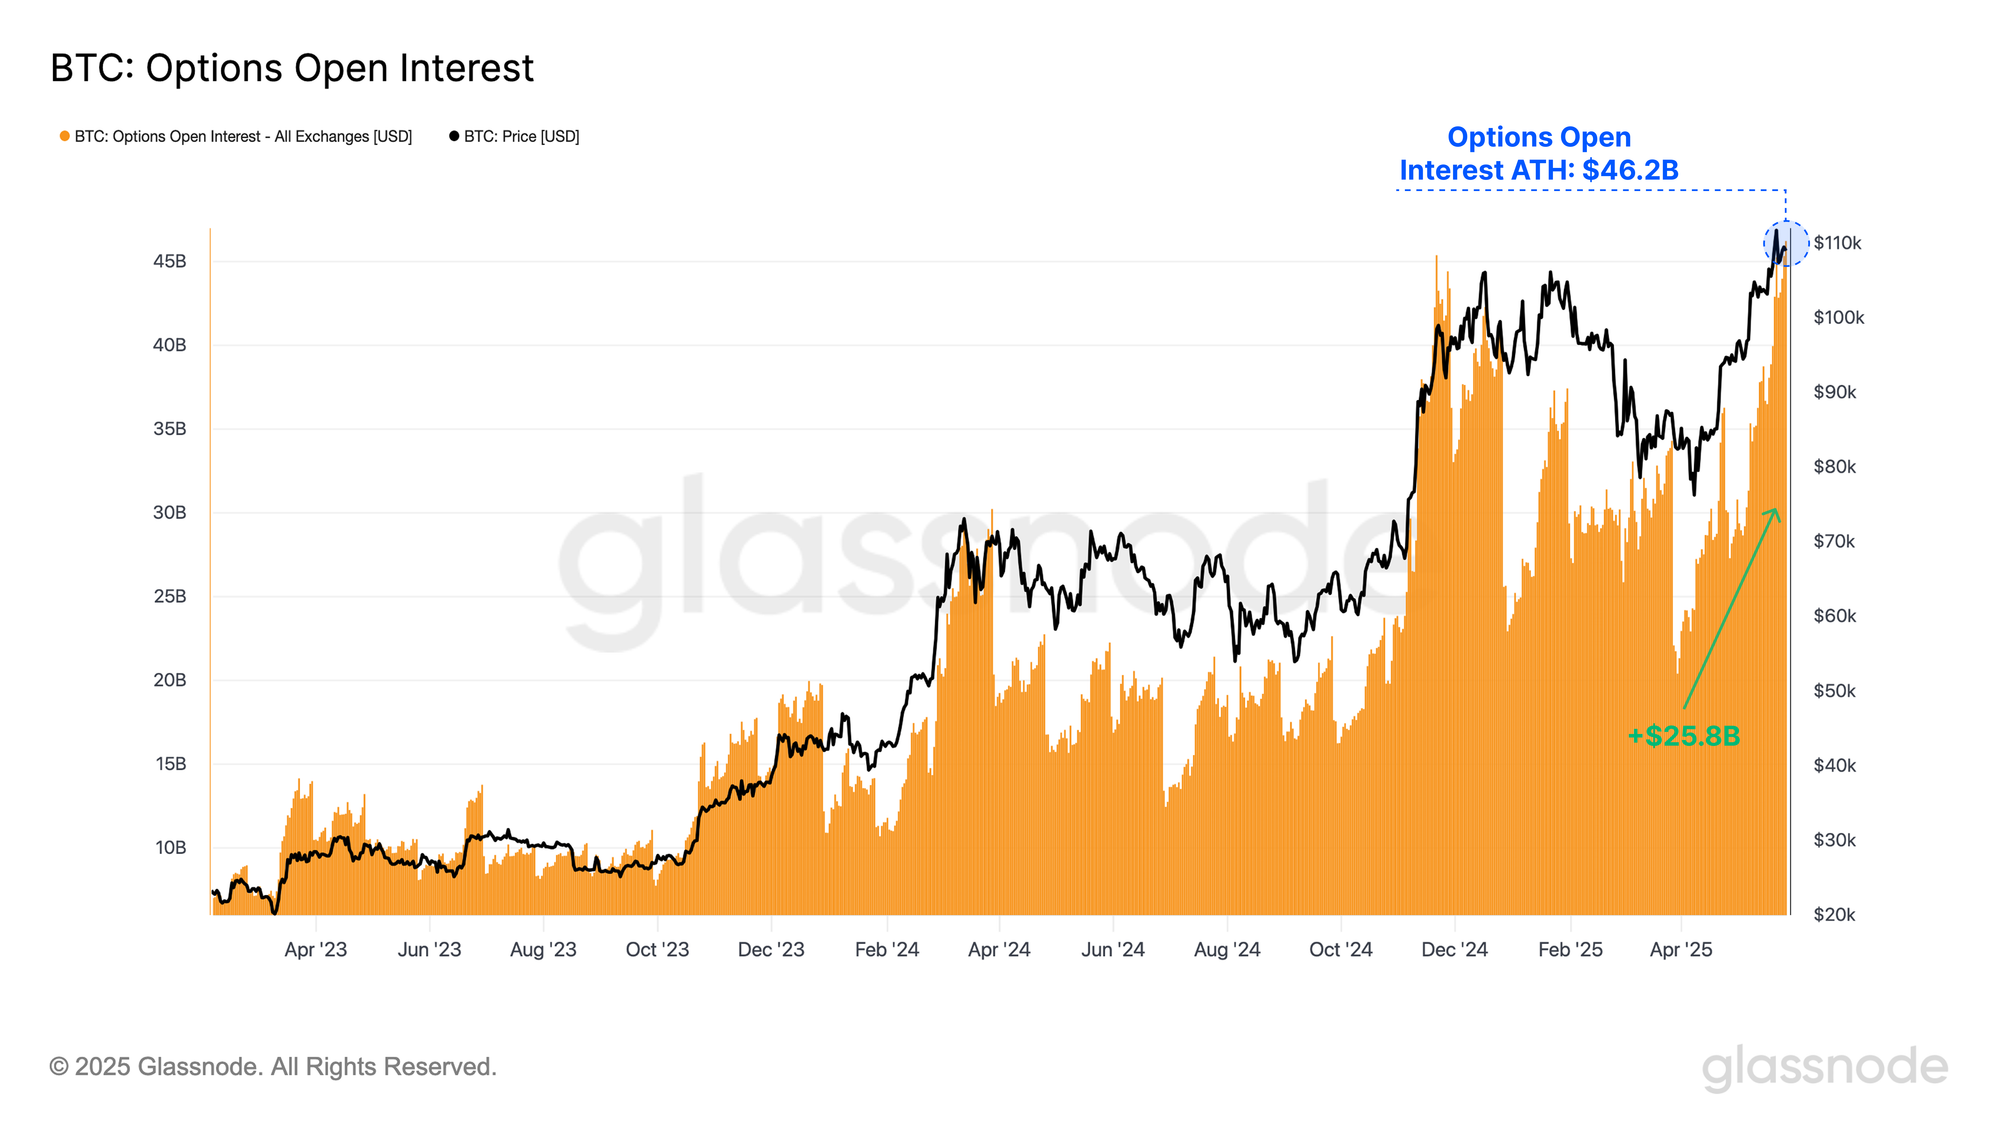
In parallel, open interest in options contracts has surged from $20.4B to $46.2B, a new all-time high. This +$25.8B increase is notably larger than the open interest growth observed in the futures market.
The rapid expansion of options open interest reflects a maturing investor base which is increasingly employing option contracts to execute more sophisticated strategies to fine-tune their risk management and trading positions.
ETF Inflows Remain Strong
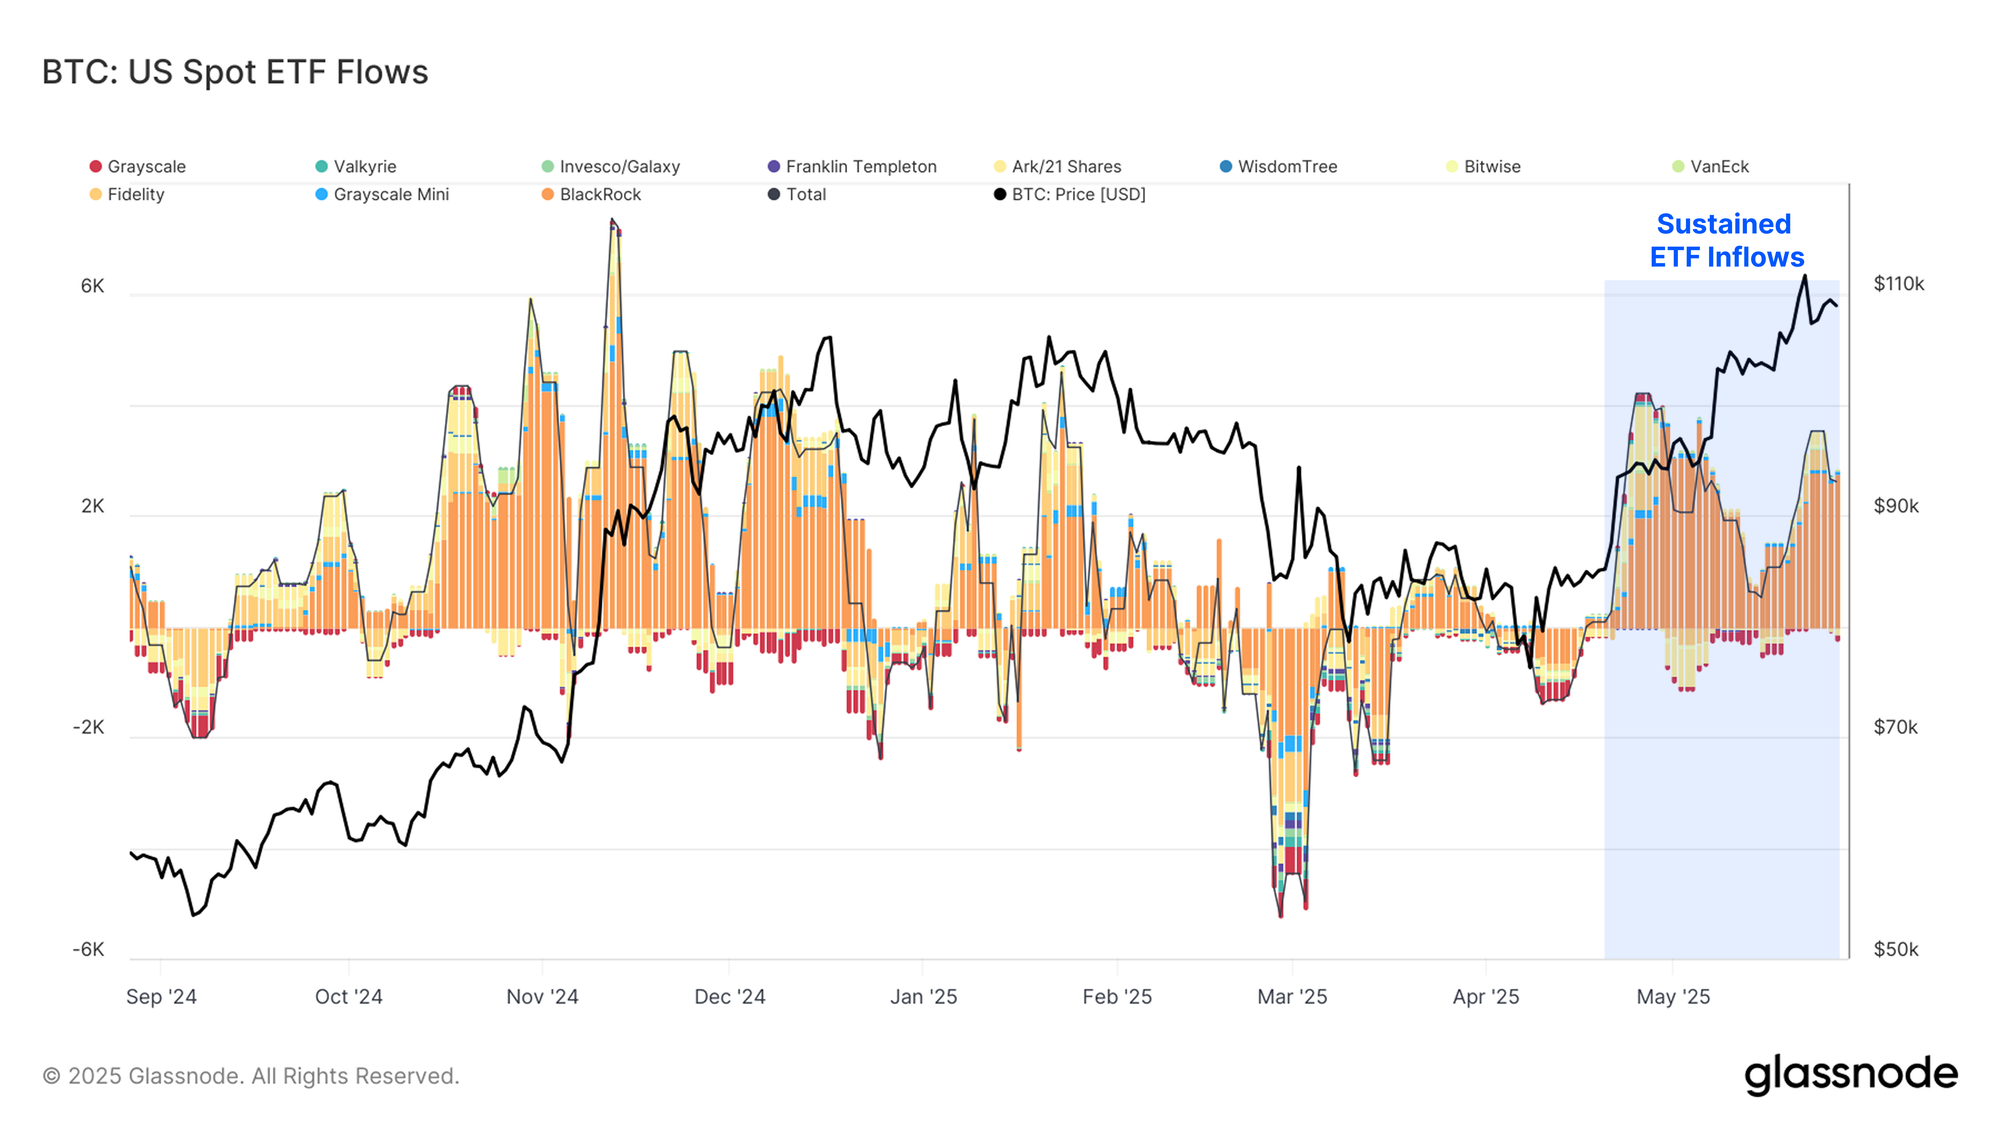
Moving towards the spot ETFs, we can see a sustained period of buy-side pressure originated in late April, and remains strong today. The ETFs have experienced inflows of more than $300M/day for the past week.
This large and sustained buy-side pressure from both retail and institutional investors suggests a continued confidence in the asset, and has been a meaningful tailwind for the market supporting all previous ATH breaks since they went live in 2024.
Navigating Price Discovery
With the Bitcoin price returning to price discovery, we can turn to a combination of on-chain and technical indicators to evaluate market momentum, and identify potential signs of overheating.
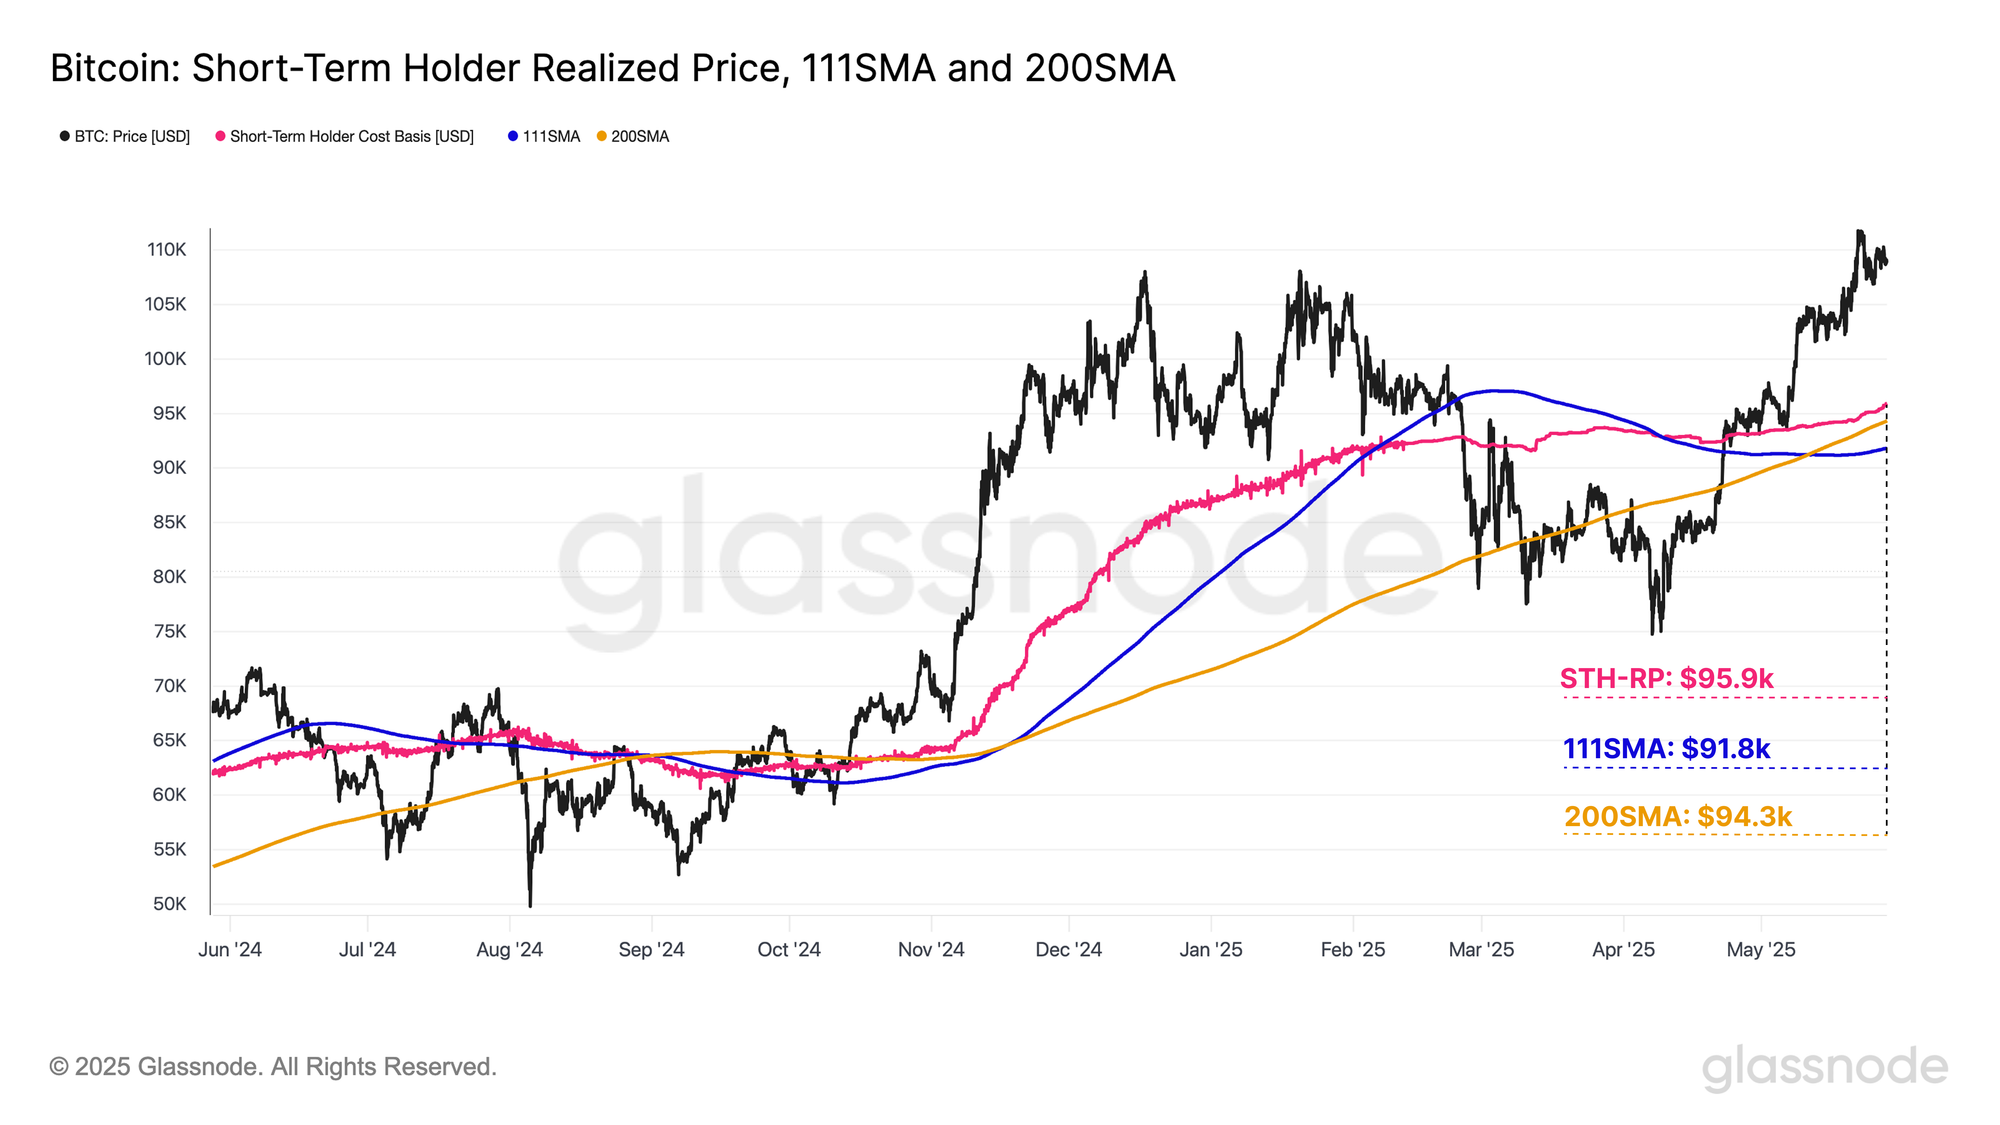
The 111DMA and 200DMA are widely used technical metrics for evaluating the momentum and trend strength of the Bitcoin market. We can complement these technical price models with the Short-Term Holder cost-basis, an on-chain metric which reflects the average acquisition price for new investors in the market. Historically, this level has served as a key threshold, often delineating between local bull and bear market regimes.
- 111DMA: $91.8k
- 200DMA: $94.3k
- Short-Term Holder Cost-Basis: $95.9k
Currently, the price is trading well above all three key levels, underscoring the strength of the market rally since April. Notably, these pricing levels are closely aligned in value, and this convergence provides strong confluence around a critical support zone, one that will be important to hold in order to sustain further upside momentum.
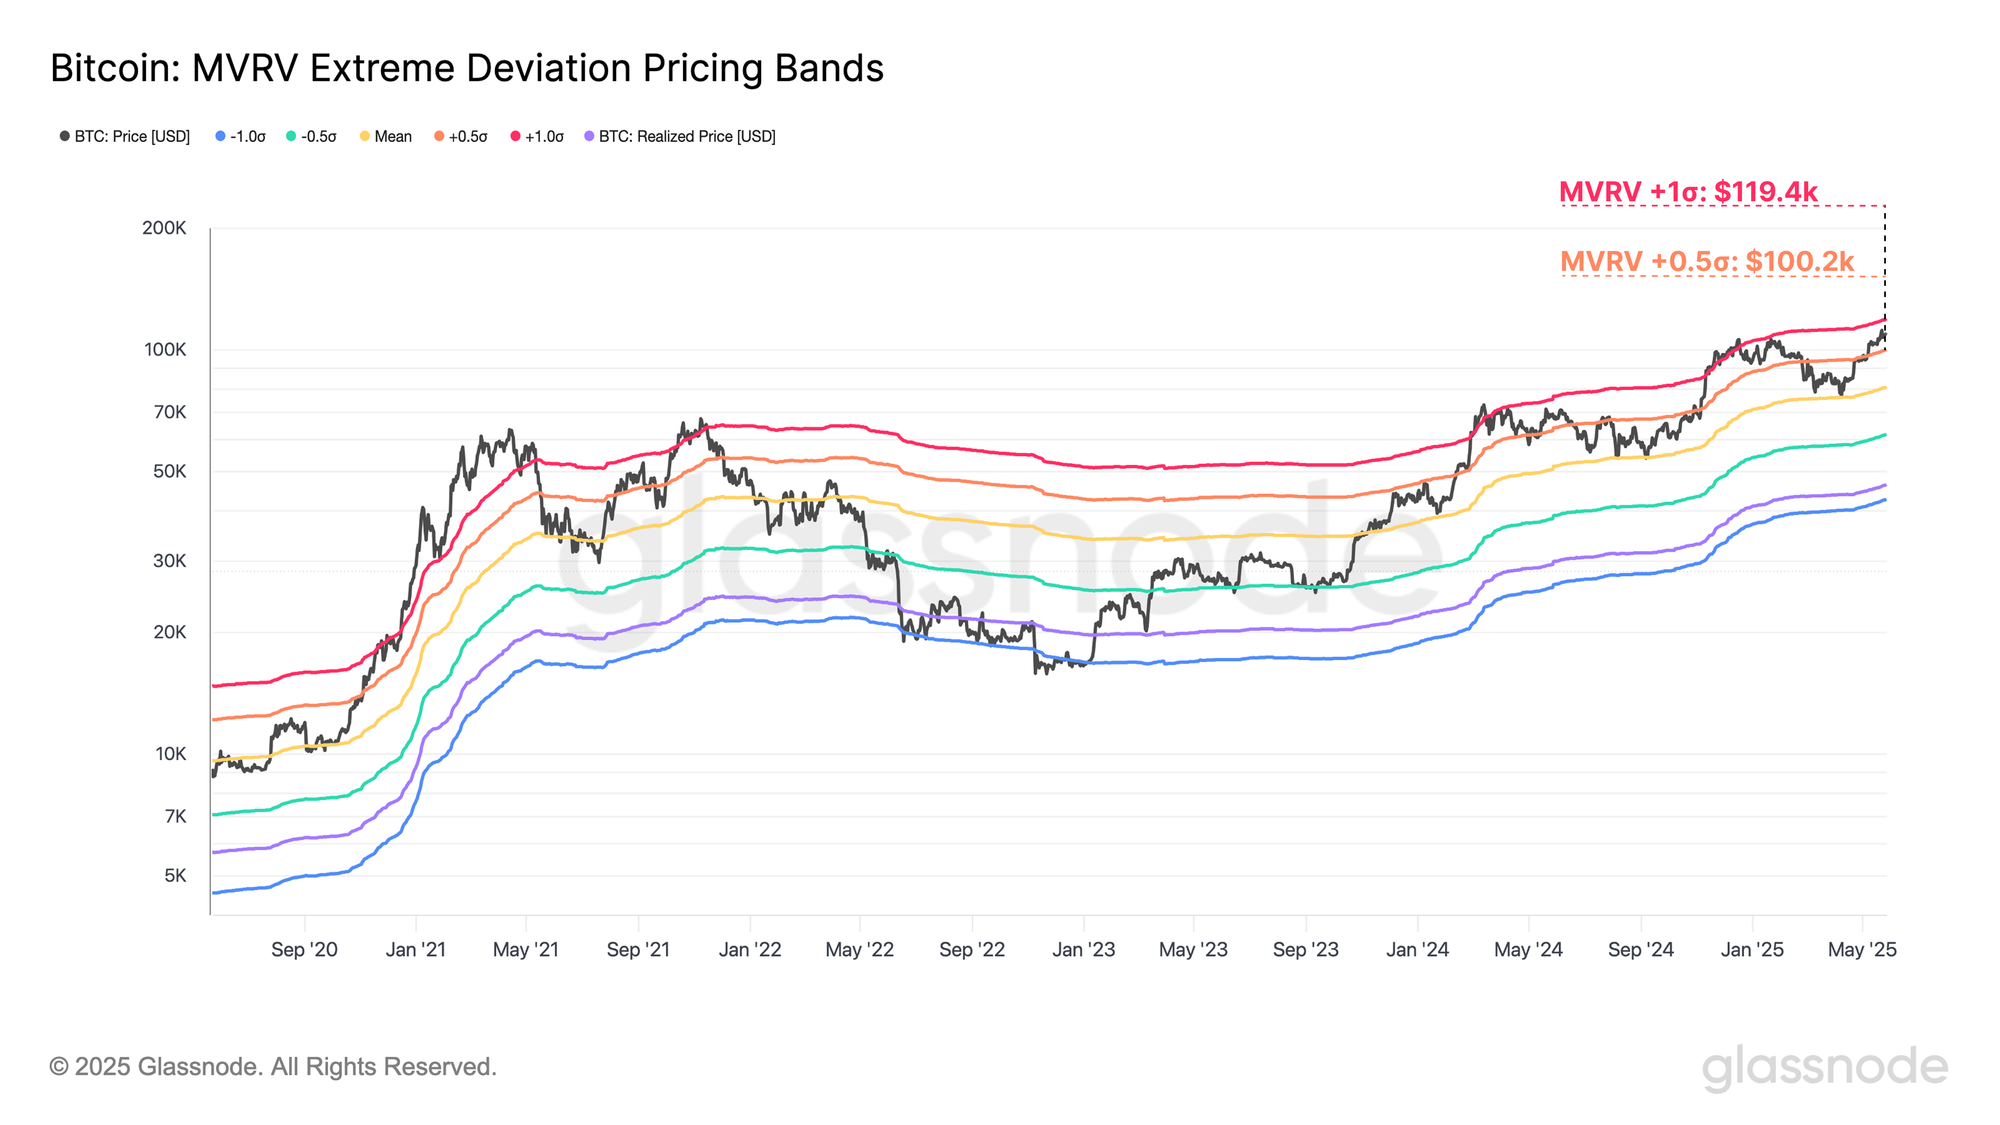
Additionally, we can utilize the MVRV Ratio to define pricing bands that highlight extreme deviations from the average investor cost basis. This helps to identify periods where investor profitability is very high relative to the long-term average. Historically, breakouts above the +1σ band have aligned with longer-term macro topping formations.
- Realized Price +0.5σ: $100.2k
- Realized Price +1σ: $119.4k
Presently, the Bitcoin price is consolidating between the +1σ and +0.5σ range. This suggests the market is relatively heated, but arguably still has room for further expansion before the unrealized profit held by investors reaches an extreme level above +1σ. Generally, these extreme levels inspire a widespread rush of profit taking activity, creating a major increase in sell-side pressure.
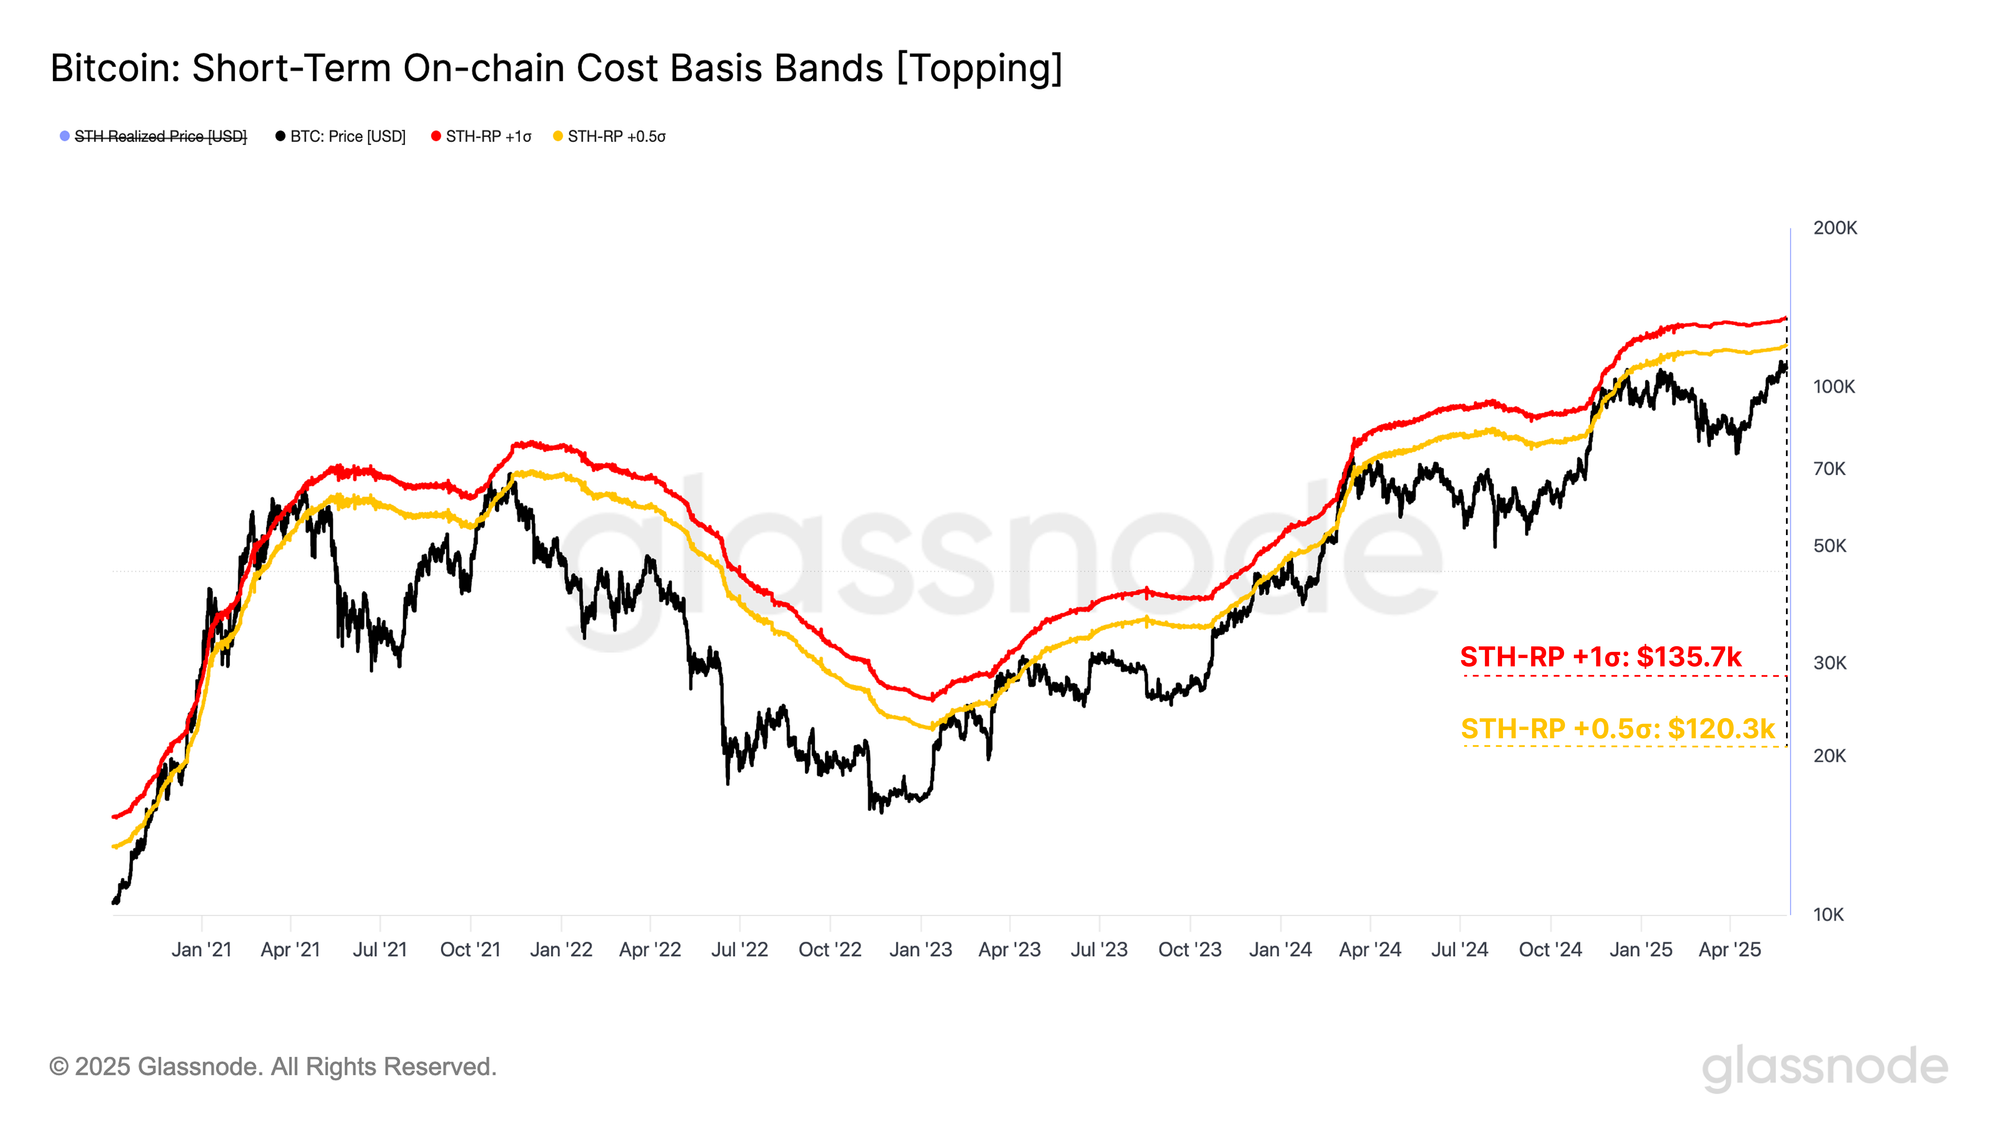
Finally, we can utilize the +0.5σ and +1σ standard deviation bands around the Short-Term Holder cost-basis to assess for locally overheated conditions.
- Short-Term Holder Cost-Basis +0.5σ: $120.3k
- Short-Term Holder Cost-Basis +1σ: $135.7k
Historically, price has traded between these two bands for 467 days, and above the +1σ level for 484 days, accounting for just 17.5% of Bitcoins trading history. This makes entry into this range a relatively uncommon occurrence, often acting as an upper bound for local price action.
While the MVRV +1σ level is typically associated with macro tops, the STH-CB +0.5σ and +1σ bands are more indicative of local topping formations. Together, the combination of these models can provide a robust framework for identifying overheated market conditions.
Summary and Conclusions
Bitcoin has reached a new all-time high of $111K, setting the third fresh ATH of this cycle. This milestone has triggered a broad uptick in activity across all major segments of the market, evidenced by rising investor profitability and profit taking, heightened exchange interaction, notable growth in futures and options open interest, and sustained buy-side demand from spot ETFs.
As the market moves into a phase of price discovery, the $120k level appears as a key zone of interest, with sell-side pressure expected to accelerate in and around this zone.
Disclaimer: This report does not provide any investment advice. All data is provided for informational, and educational purposes only. No investment decision shall be based on the information provided here and you are solely responsible for your own investment decisions.
Exchange balances presented are derived from Glassnode’s comprehensive database of address labels, which are amassed through both officially published exchange information and proprietary clustering algorithms. While we strive to ensure the utmost accuracy in representing exchange balances, it is important to note that these figures might not always encapsulate the entirety of an exchange’s reserves, particularly when exchanges refrain from disclosing their official addresses. We urge users to exercise caution and discretion when utilizing these metrics. Glassnode shall not be held responsible for any discrepancies or potential inaccuracies.
Please read our Transparency Notice when using exchange data.
- Join our Telegram channel.
- For on-chain metrics, dashboards, and alerts, visit Glassnode Studio.