Self-described Bitcoin maximalist Rob Wolfram has been charting the BTC price against the Stock-to-Flow model.
In the chart below, the IT security expert explained the dark blue area represents one standard deviation of error from the predicted price per the S2F model. At the same time, the light blue area covers two standard deviations of error from the expected price.
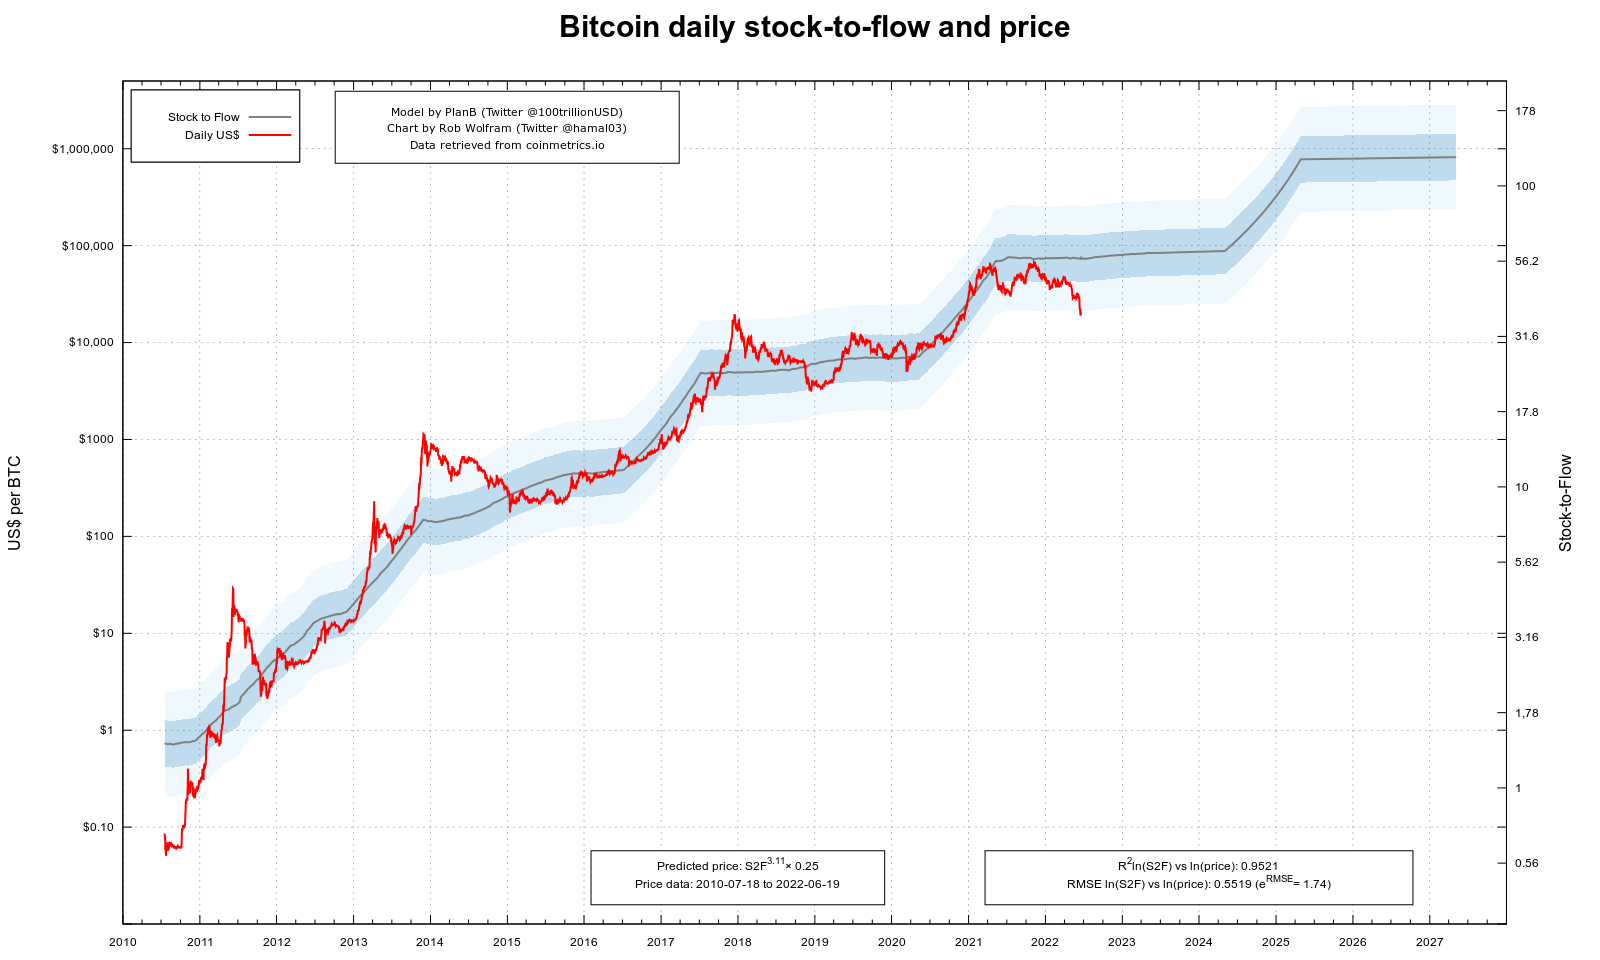
Source: s2f.hamal.nl
However, with recent bearish price action, Bitcoin sunk as low as $17,600 on June 18 and breached the lower bound light blue area for the first time, calling into question the validity of the S2F model.
What is the Bitcoin Stock-to-Flow Model?
The S2F model was created in March 2019 by the anonymous Twitter account @100trillionUSD, also known as Plan B.
The model uses an existing stock-to-flow model initially formulated for use with commodities, such as gold and palladium. The model asserts that it’s possible to predict the price of an asset based on its scarcity over time.
In other words, this model examines the relationship between flow (or mined annual output of tokens) and stock (or tokens in circulation).
It predicts the price of Bitcoin will reach $100,000 by mid-2024 and $1,000,000 by mid-2025.
Yet by breaching the lower bound limit for the first time, there is documented evidence that the model is invalid.
The limitations of the Stock-to-Flow model
In the past, critics have pointed out several reasons for the model’s limitations. Most pertinent is the assumption that scarcity or supply is the only driver of value. This doesn’t account for other essential price drivers, namely the effect of demand.
Perhaps the most fundamental theory on price is the relationship between demand and supply. In that, when supply exceeds demand, prices will fall. And when demand exceeds supply, prices will rise.
However, the S2F model skips over the influence of demand for Bitcoin while overlooking unexpected events, such as an economic meltdown or Black Swan event.
Critics say the model lacks scientific rigor by focusing only on scarcity and drawing from a data set spanning just 13 years.
In response to the lower bound breach, Writer and Mining Analyst Zack Voell tweeted that Bitcoin isn’t dead. But continued by saying the S2F has been exposed as a scam.
Bitcoin isn't dead.
But the Stock-to-Flow scam absolutely is. pic.twitter.com/ZYZ0NR8n92
— Zack Voell (@zackvoell) June 19, 2022
The coming weeks will reveal whether the breach was an outlier or a sign of worse to come.