The cryptocurrency market has concluded another week on a bearish note. With this, the top tokens continue to stumble around their important support levels. With a 24-hour trading volume of $43.61 billion, the cryptocurrency industry is currently worth $2.69 trillion. While the fear and greed index displays 32/100, the altcoin season still records 18/100, highlighting a delayed altcoin season.
Notably, the Bitcoin price is back above the $85,000 mark, but continues to struggle around the price range. This hints at increased price volatility in the crypto market.
On the other hand, the altcoin market is the worst affected as the top tokens constantly fail to break above their crucial levels. This brings marketers under a FUD-like situation with endless questions.
In this article, we will understand the market and technical sentiment of the top 3 cryptocurrencies, along with their potential weekly price predictions.
Bitcoin Price Reclaims $85,000 Mark!
Bitcoin price today has successfully maintained its value above the $85,000 mark. With an intraday trading volume of $14.208 billion and a market capitalization of $1.68 trillion, the dominance of this crypto token is beyond 63% for about 10 days now. Despite rising uncertainty, the Bitcoin community speculates a strong bullish reversal during this quarter.

The Moving Average Convergence Divergence (MACD) shows a constant rise in the green histogram, with its averages displaying a similar action in the daily time frame. This suggests a positive outlook for the largest crypto token during the upcoming week.
A sustained bullish price action could push the price of Bitcoin toward its upper target price of $90,000 within the next seven days. However, increased liquidation could pull the Bitcoin price toward its pivotal support trendline of $78,500.
ETH Price Regains Bullish Momentum!
The ETH price continues hovering around the $1,600 mark with an intraday trading volume of $6.89 billion. However, with a YTD correction of 51.63%, the dominance of the largest altcoin by market cap has dropped to 7.17%. This has created huge concern among the community about the future of smart contracts.
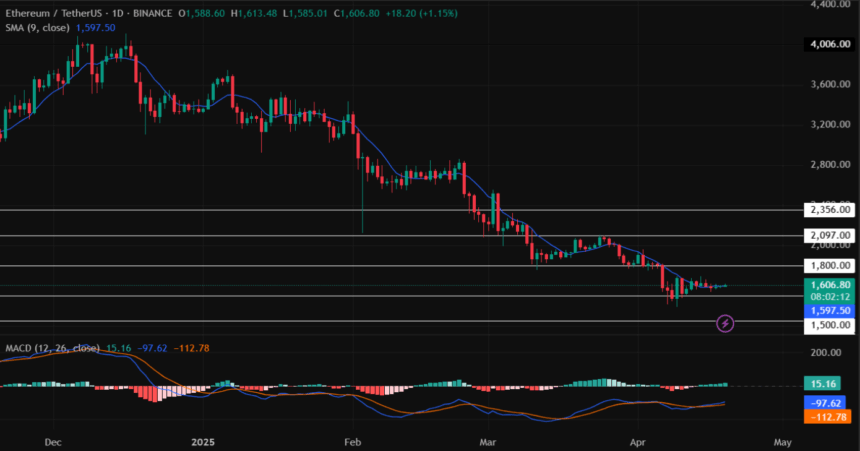
The Simple Moving Average (SMA) strongly supports the Ethereum price action in the daily time frame. This suggests an increase in the buying-over-selling pressure for the altcoin in the cryptocurrency space. Moreover, the technical indicator, MACD, witnesses a similar price action, indicating a bullish outlook.
If the cryptocurrency market favors the bulls, in that case, the Ethereum coin price could head toward its immediate resistance level of $1,800. Sustained positive action could push the price of this altcoin toward its upper high of $2000. Conversely, a negative influence could pull the value toward its crucial low of $1,500.
XRP Price Forms A Strong Support Above The $2 Mark!
The XRP price today continues to display stable price action. With this, altcoin has concluded the week with neutral price action. Considering the long-term price action, it has plunged by over 14% over the last 30 days. Moreover, with a market cap of $120.78 billion, it is currently trading at a discount of about 46% from its ATH.
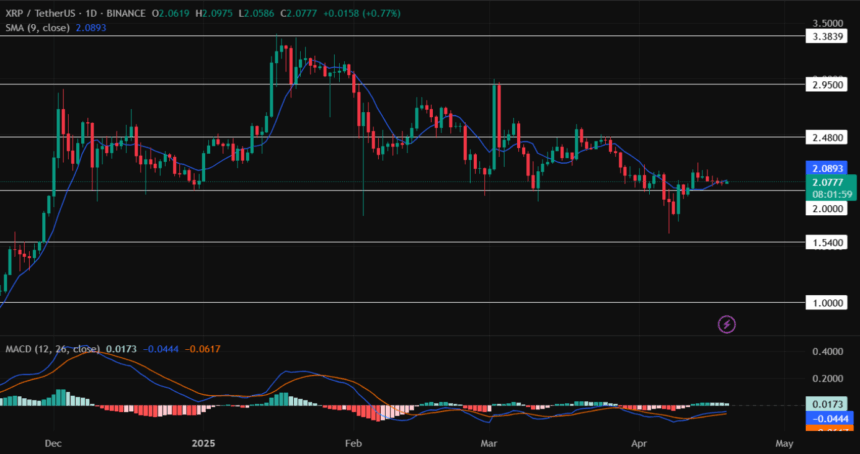
The technical indicators SMA & MACD have both displayed positive action over the past week. This hints at a rising bullish sentiment for the 2nd largest altcoin, suggesting that the price may retest its crucial levels.
Maintaining the price above its support level of $2 could prepare the altcoin to head toward its important resistance level of $2.50. On the flip side, a negative turnaround could result in it plunging toward its lower support of $1.75.
Also Read: XRP Price Set for July Surge; Historical Data Backs It