Executive Summary
- The Bitcoin spot price has briefly rallied above $69k after successfully clearing several significant technical and on-chain pricing levels.
- From an On-chain perspective, all sub-age-groups within the Short-Term Holder cohort now hold an unrealized profit, likely a tailwind for market sentiment.
- However, speculation in futures markets is increasing, with open interest surging to new ATHs and a non-trivial portion attributed to the cash and carry basis trade.
Accelerating Price Action
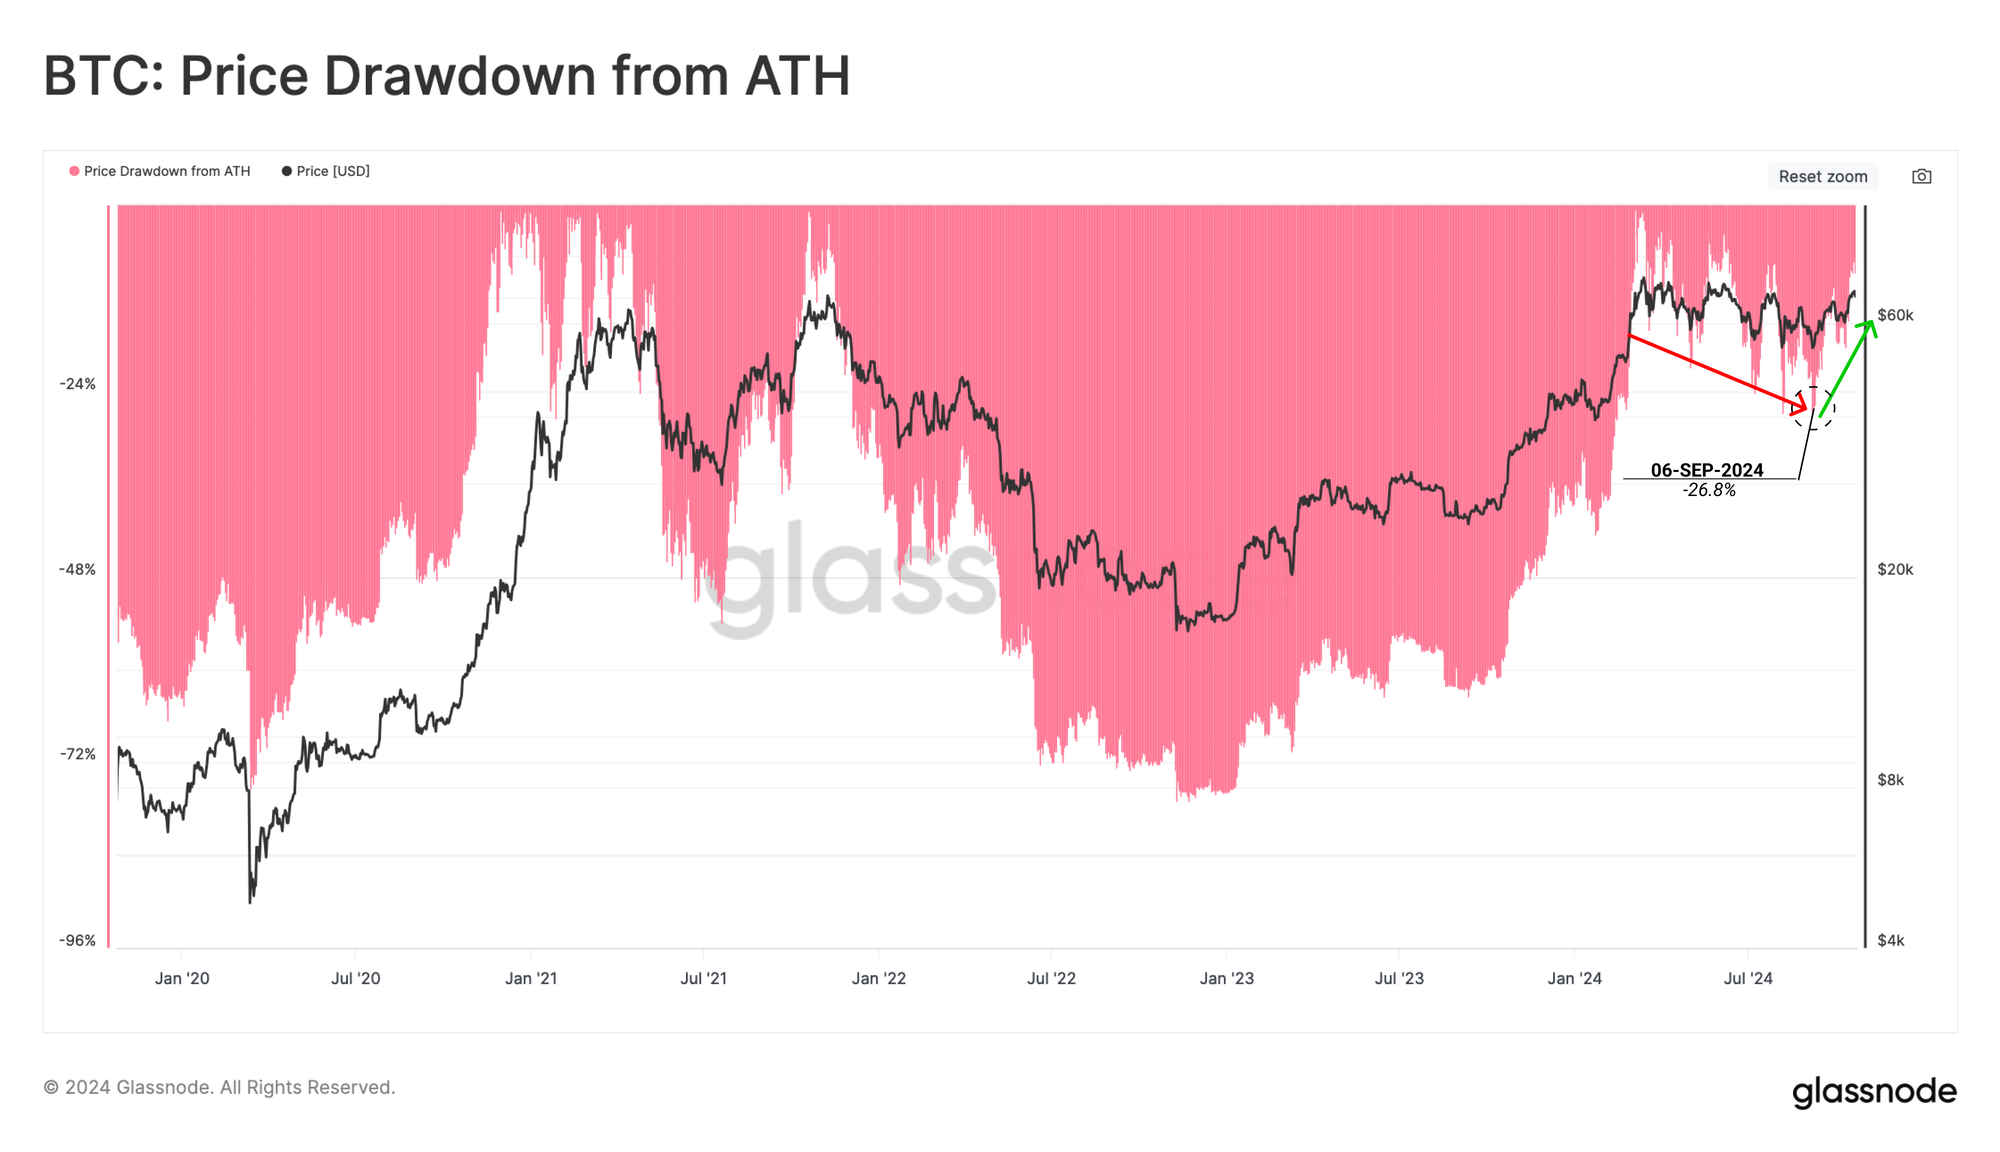
The Bitcoin spot price has caught a bid this week, rallying back to $69k, edging ever closer to the $73k ATH set in March. The market is trading just -6.8% below this peak price, relieving many investors after seven months of sideways and choppy conditions.
When we measure the depth of drawdowns relative to the ATH over time, we can see that the severity of this drawdown is more in line with the 2021 up-cycle and less so with the 2019 and 2022 bear markets.
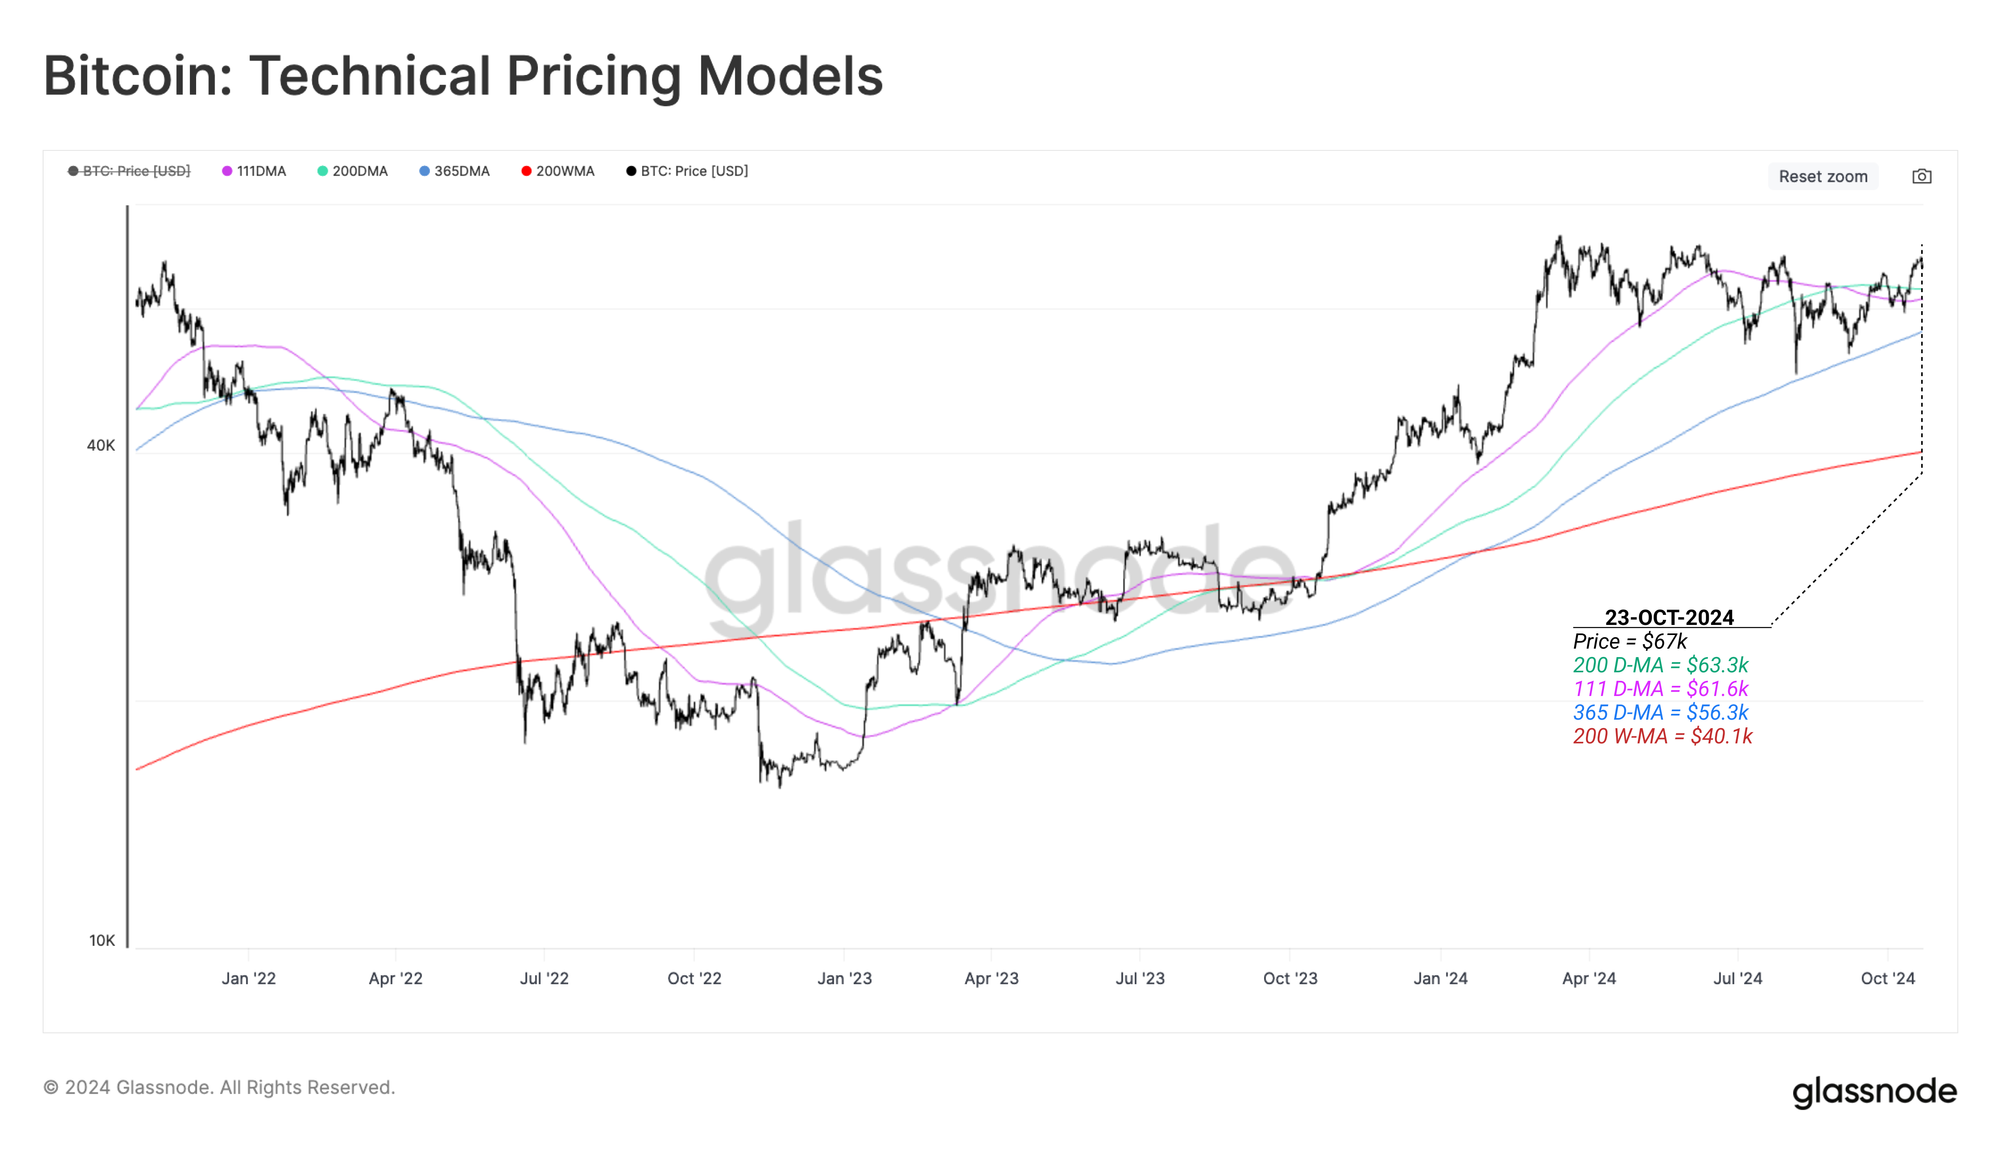
We can further profile the market's resilience by comparing the spot price and key technical pricing levels. This rally has seen the market break through the combined resistance of the 200DMA 🟢 and the 111DMA 🟣, both of which Bitcoin investors tend to respond.
Interestingly, the 365D SMA 🔵 has historically acted as either support or stubborn resistance at macro market inflection points. Recently, the 365DMA acted as strong support during the yen-carry unwind on 5 August and, to date, has defined the lower bound of the prevailing macro uptrend.
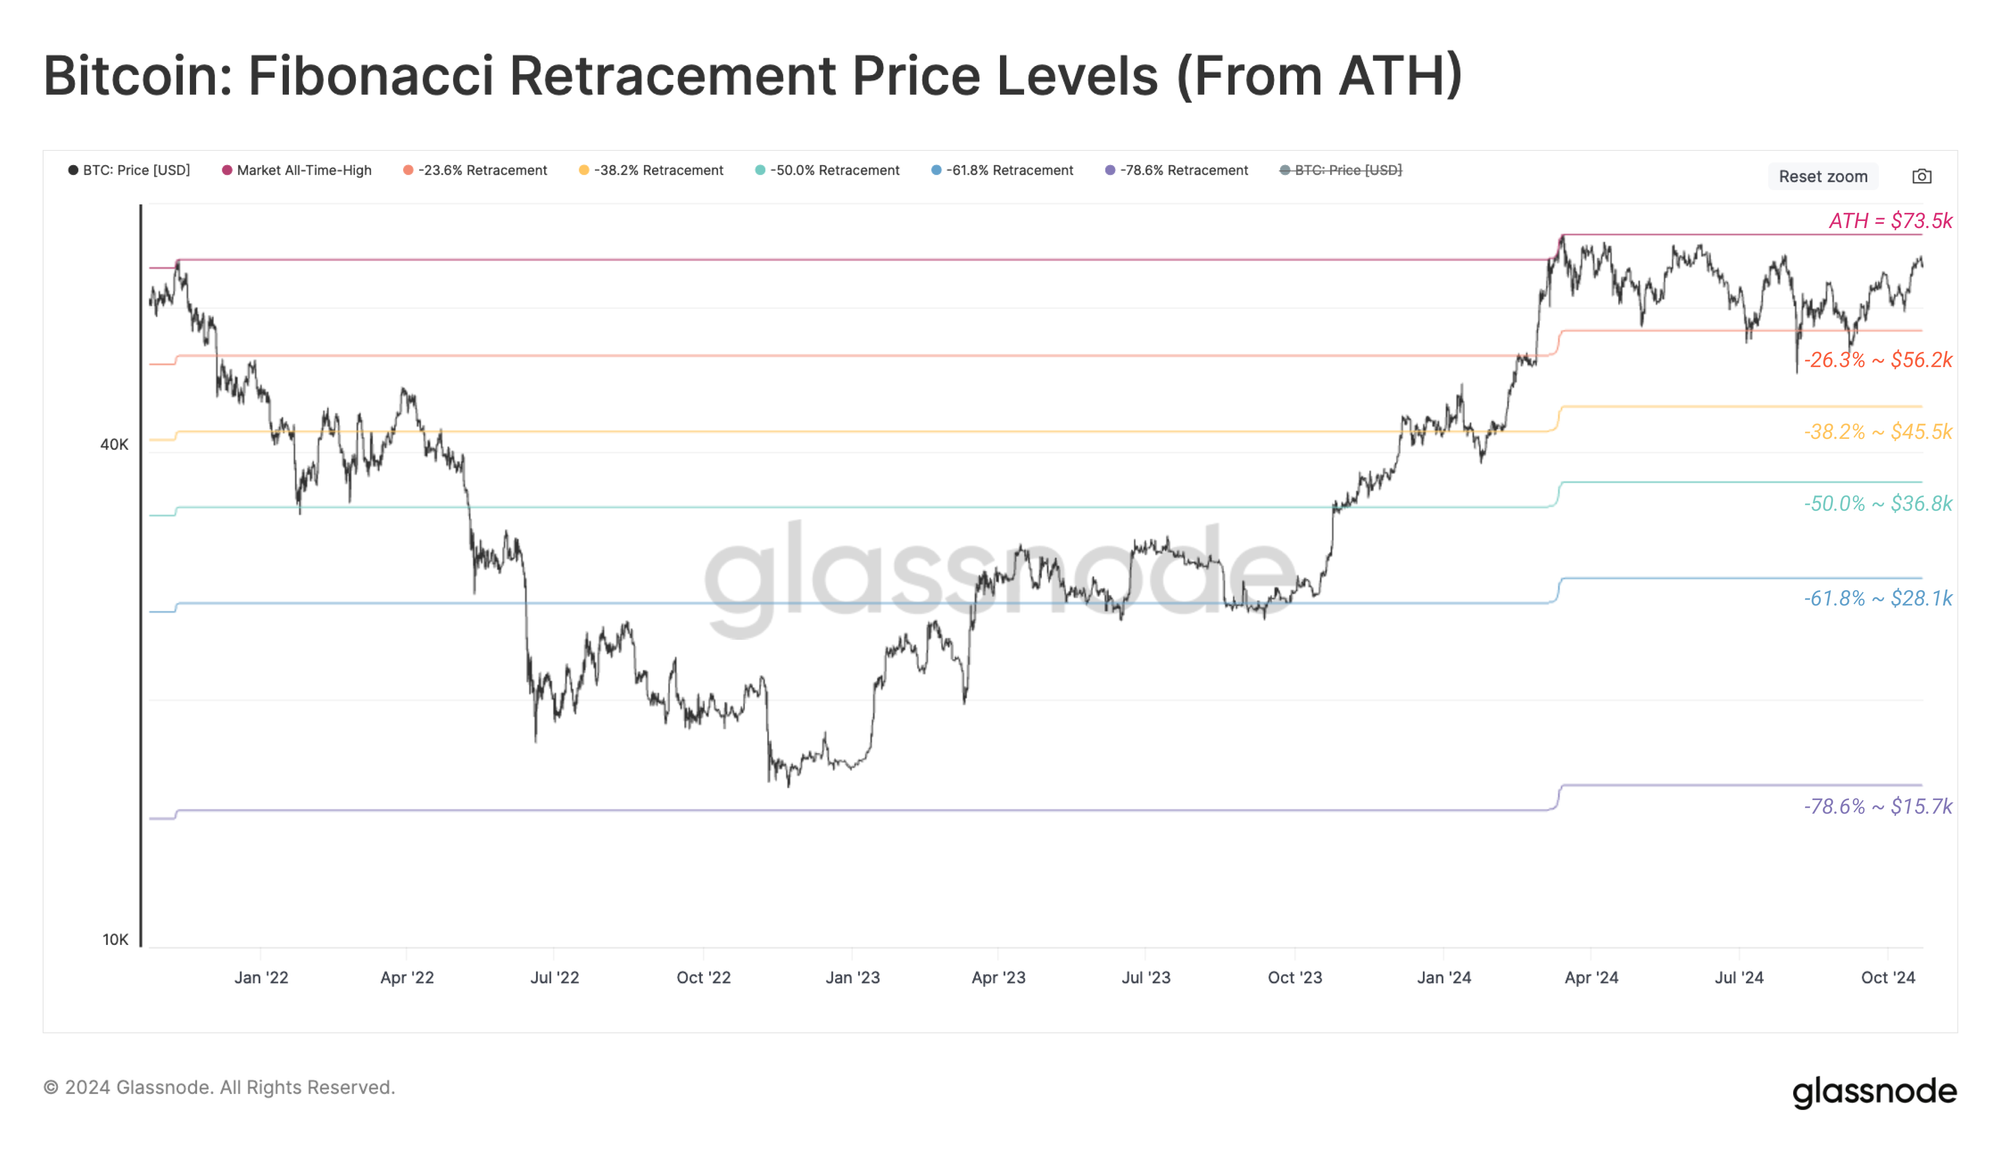
From the lens of Fibonacci retracement levels, the spot price has been primarily bounded between the ATH and the -23.6% region, acting as a general lower bound throughout the range bound price action.
Bitcoin trading within these bounds for several months is extremely atypical, underscoring how unique this sideways and choppy period has been. Typically, the Bitcoin market rallies to new ATHs or sells off more severely, which intrigues this consolidation period.
Key On-Chain Pricing Levels
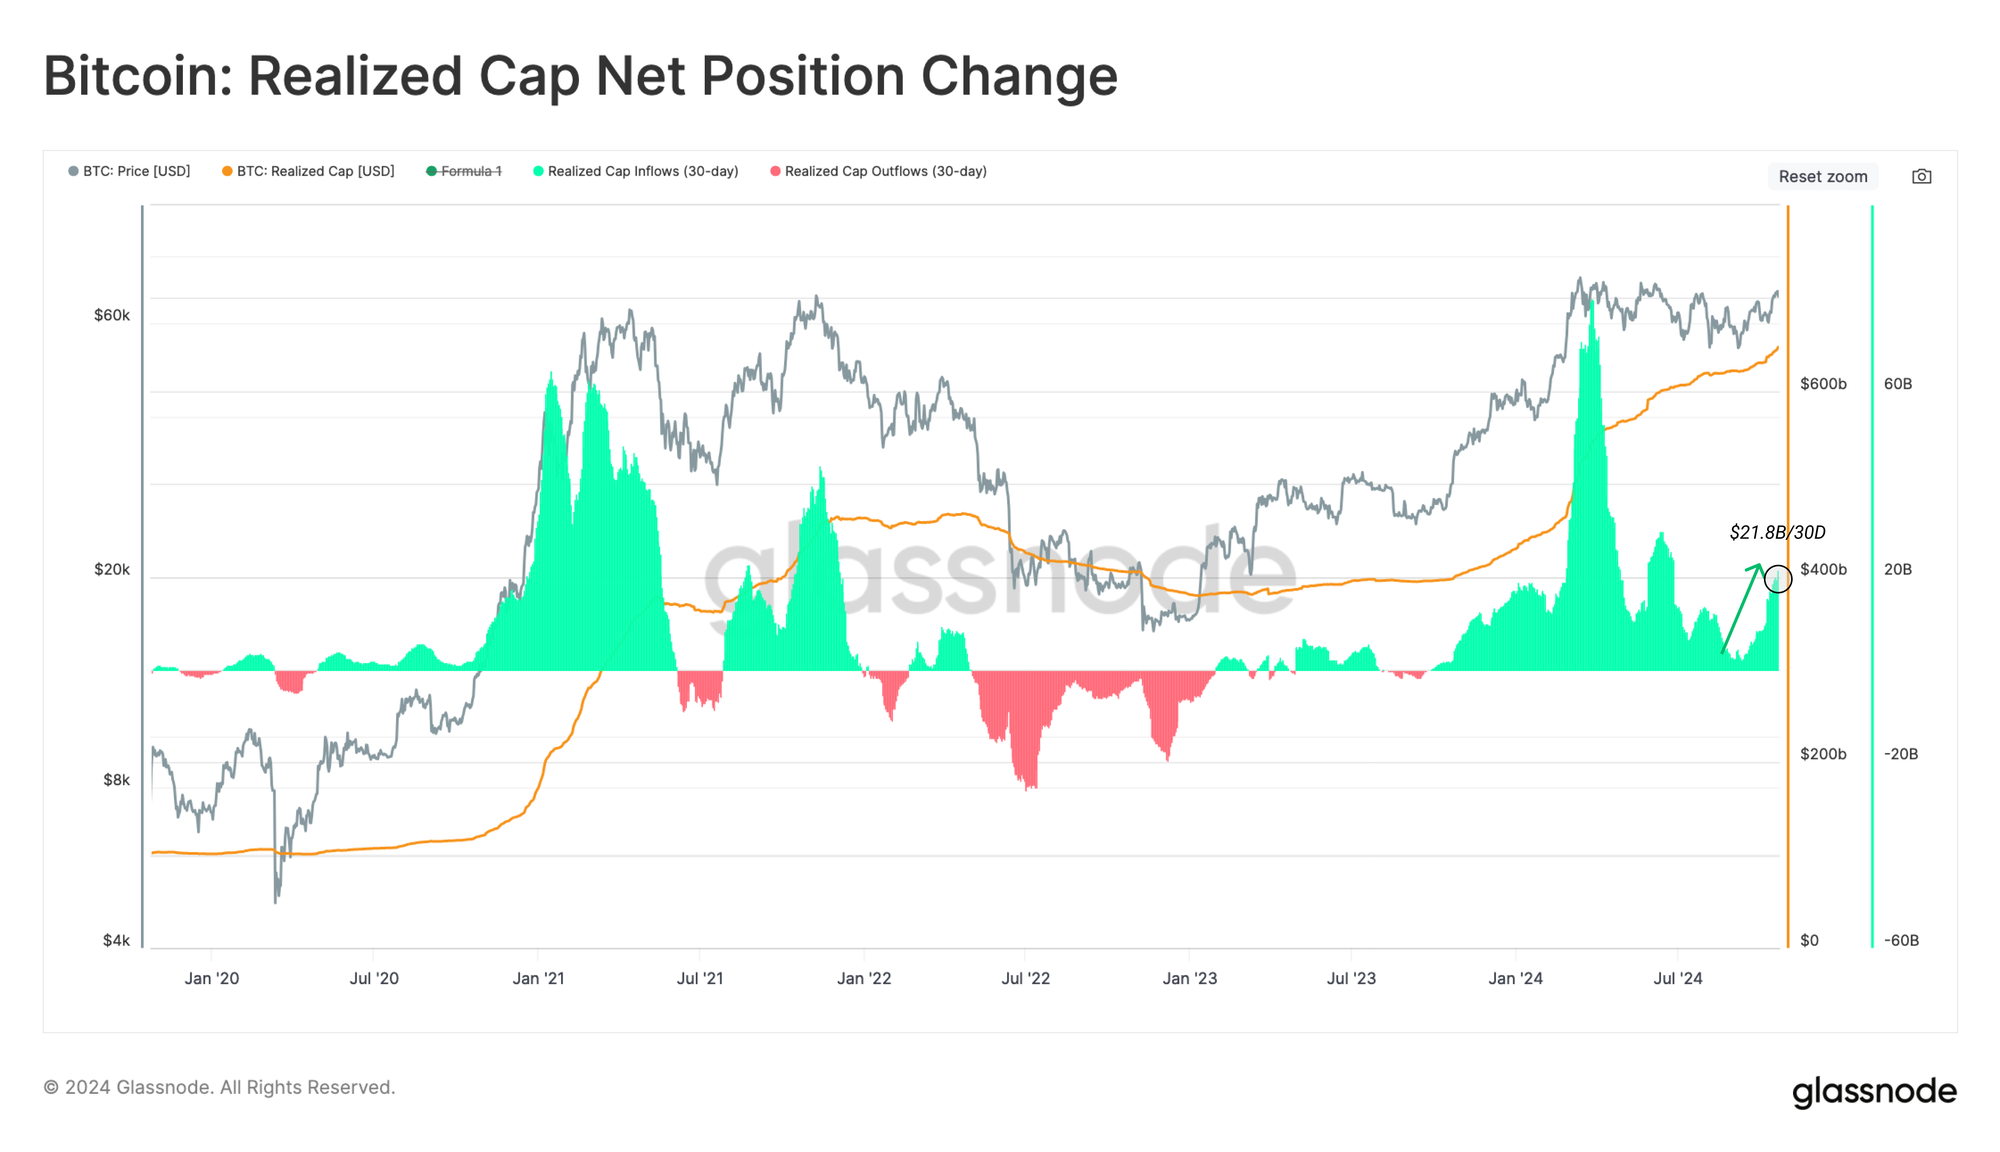
Net capital inflows into the Bitcoin asset have also accelerated, increasing by $21.8B (+3.3%) over the last 30 days. This has resulted in the Realized Cap ticking up to a new ATH, reaching over $646B.
This suggests that liquidity across the asset class is rising, and meaningful capital inflows support the price increase.
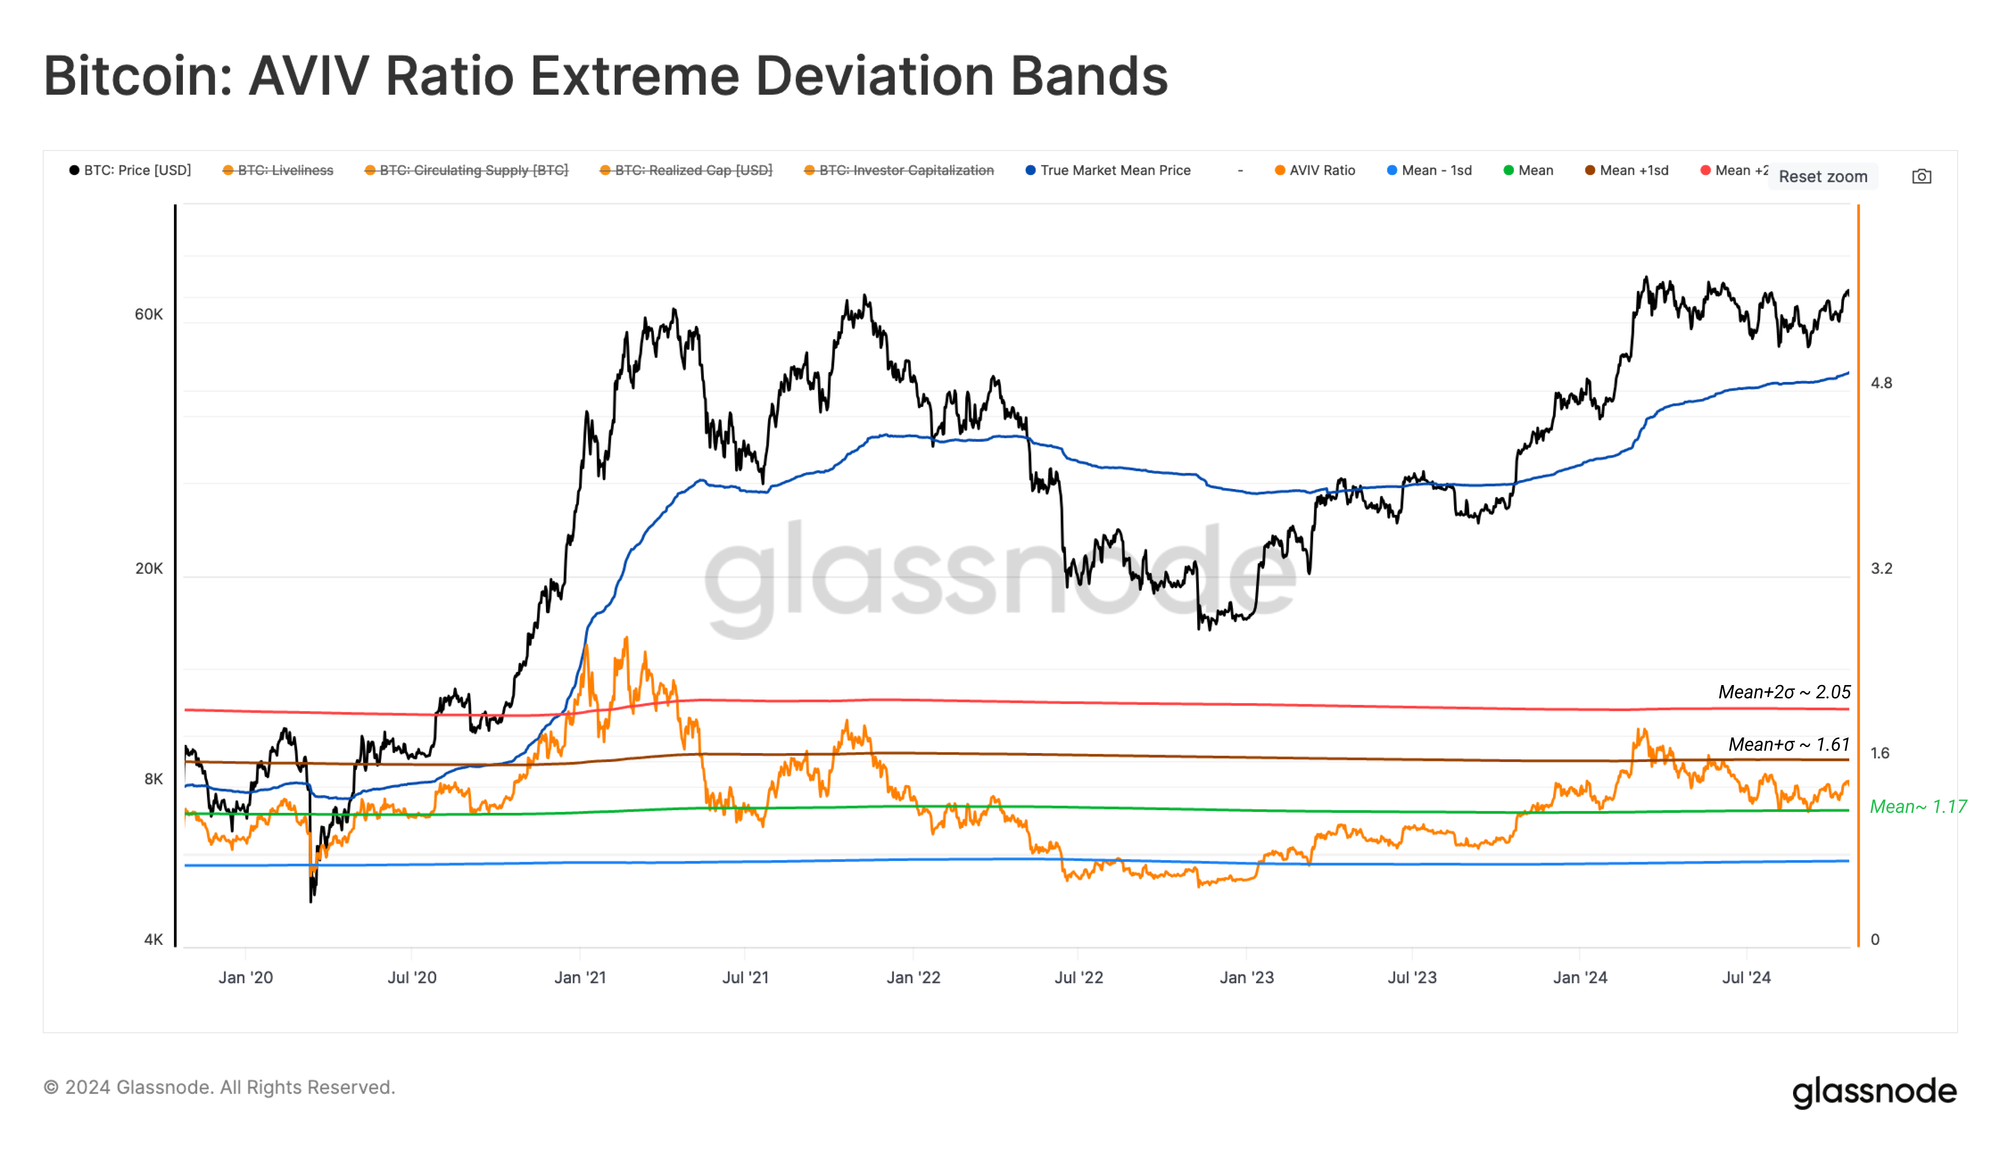
The AVIV Ratio is a fundamental metric within the on-chain analysts' toolkit, which assesses the magnitude of paper gains/losses held by active investors (by discounting inactive entities such as lost and long-dormant supply).
The AVIV Ratio has traded above its all-time mean YTD and bounced strongly off this mean when the yen-carry-trade unwound on 5 August. Generally speaking, this is a constructive signpost in that it suggests investor profitability remains relatively robust, and active investors have defended their cost basis over recent months.
In addition, we note that the AVIV Ratio has not breached its +1SD level since the March ATH, highlighting the potential room for growth should positive price momentum be established.
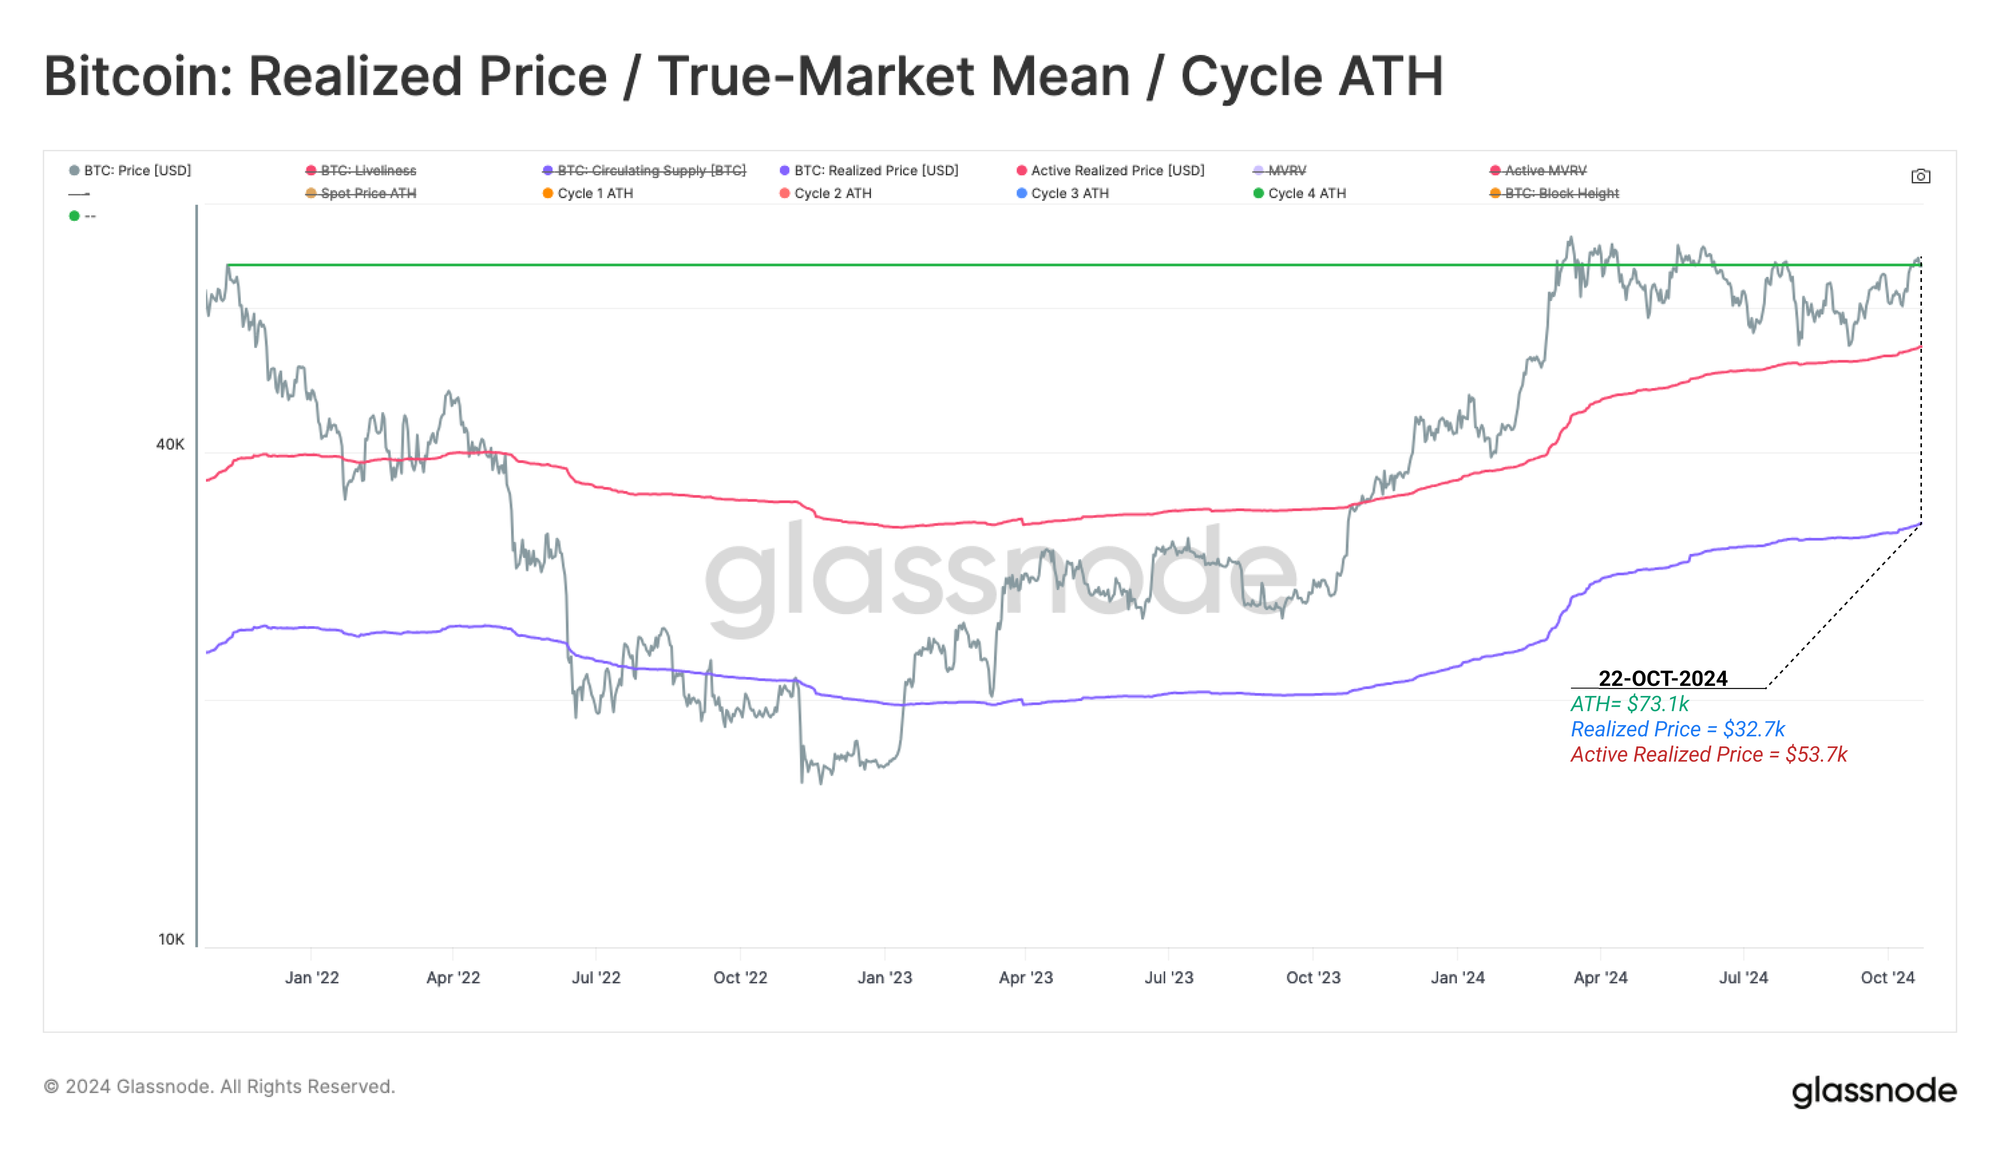
We can use key on-chain pricing levels to construct a framework for thinking about Bitcoin market cycles. This can be considered under the following framework:
- 🔴 Deep Bear Market: Prices trade below the Realized Price.
- 🔵 Early Bull Market: Prices trade between Realized Price and True Market Mean.
- 🟠 Enthusiastic Bull Market: Prices trade between the ATH and True Market Mean.
- 🟢 Euphoric Bull Market: Prices trade above the previous cycles ATH.
The price is attempting to transition from the Enthusiastic Bull Market regime into the Euphoric Bull Market, distinguished by a sustained break above the 2021 ATH of $69k. This level was briefly breached during the March 2024 peak, however profit taking was too heavy at the time, necessitating a period to cool off investor excitement.
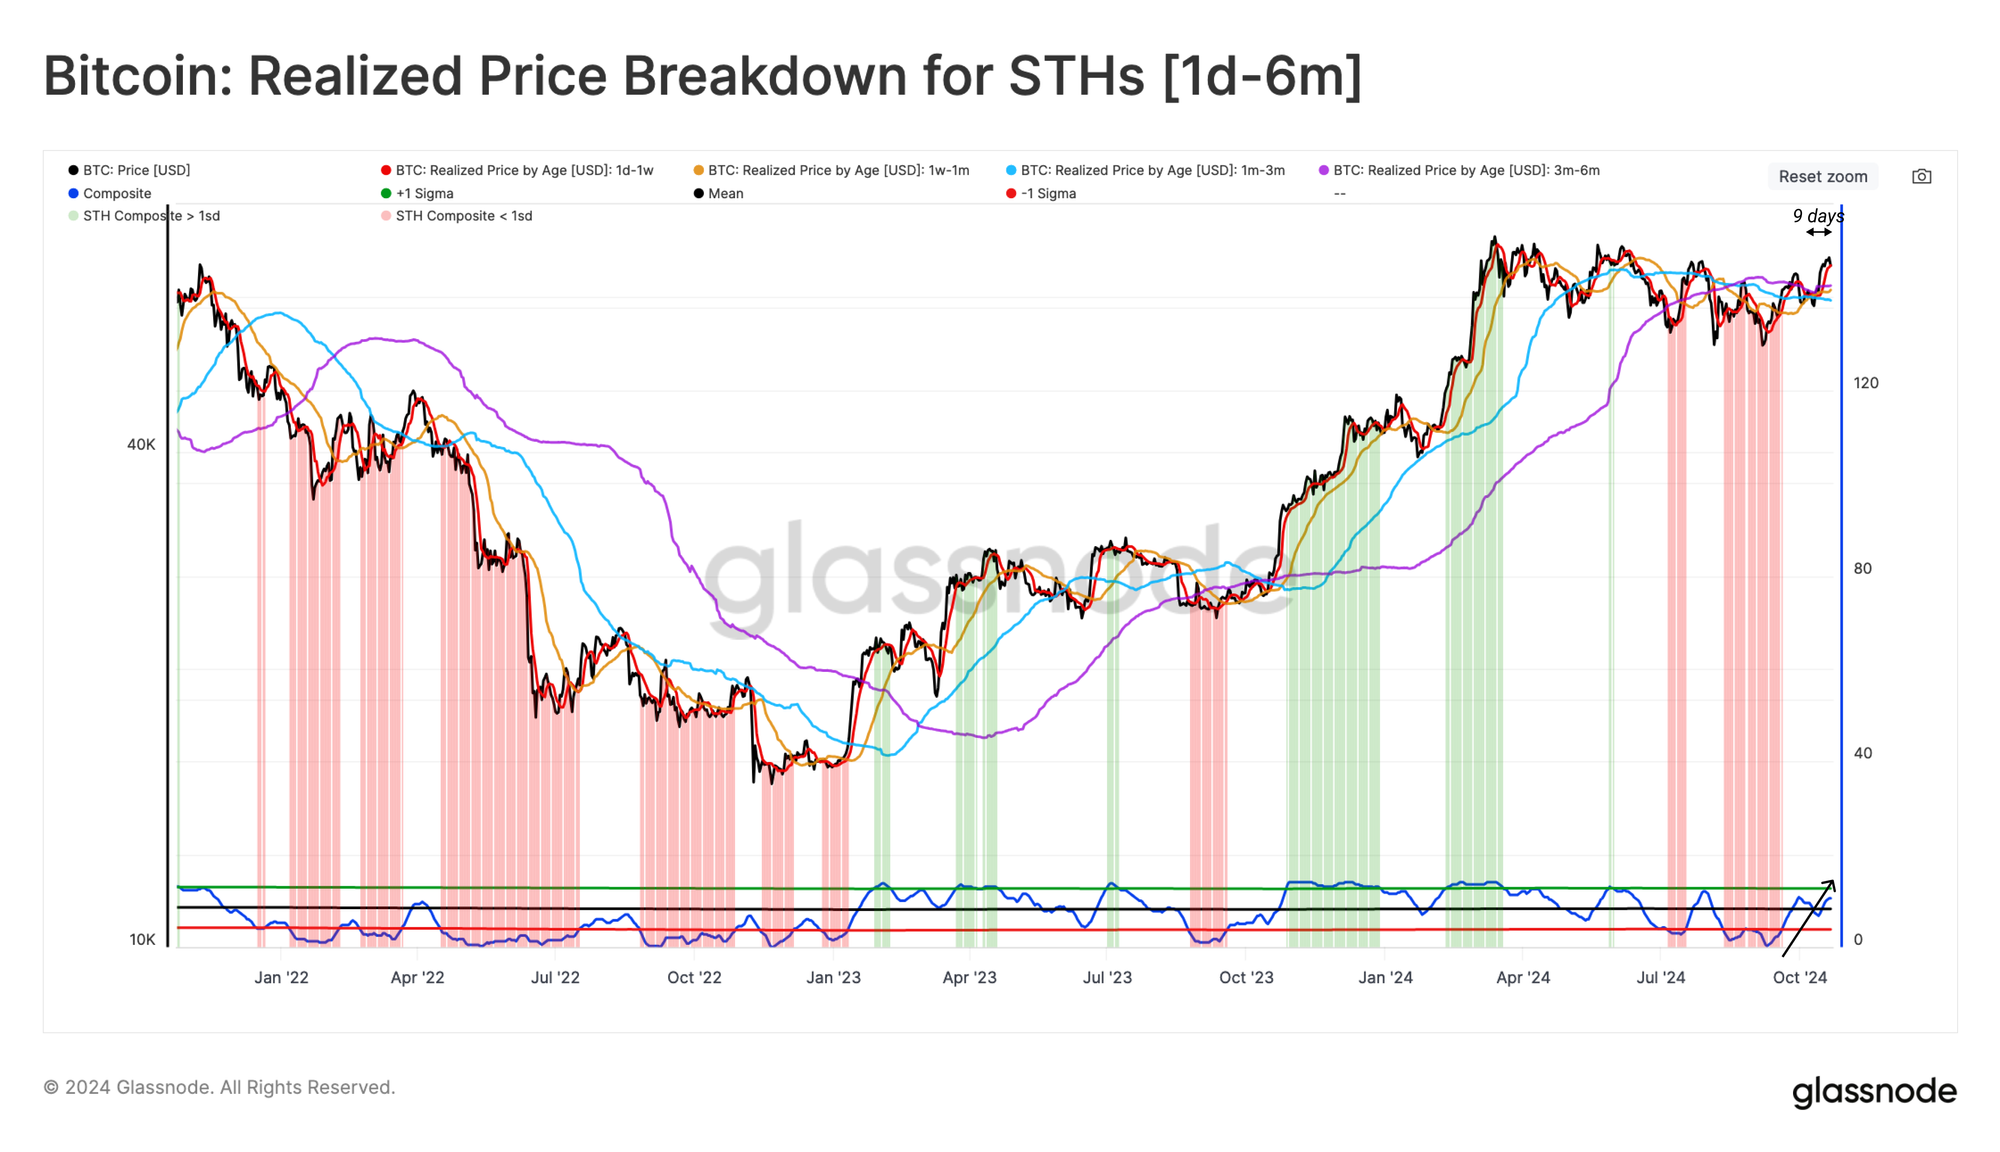
We can also assess the state unrealized profit for the Short-Term Holder cohort, which can be considered a proxy for recent buyers' sentiment in the market.
Presently, the spot price is trading above the average acquisition price of all Short-Term Holder cohort sub-age groups. This means almost all recent buyers hold an unrealized profit, spotlighting the relief this rally has provided investors.
Cash and Carry Intensifies
The derivative market for Bitcoin has experienced immense growth since the first perpetual swap instruments were launched in 2016. Derivatives markets have added significant depth and liquidity to the asset class, allowing for increasingly sophisticated trading and hedging strategies.
Open Interest across both perpetual and fixed-term futures contracts has recorded a new ATH of $32.9B this week, suggesting a marked increase in aggregate leverage entering the system.
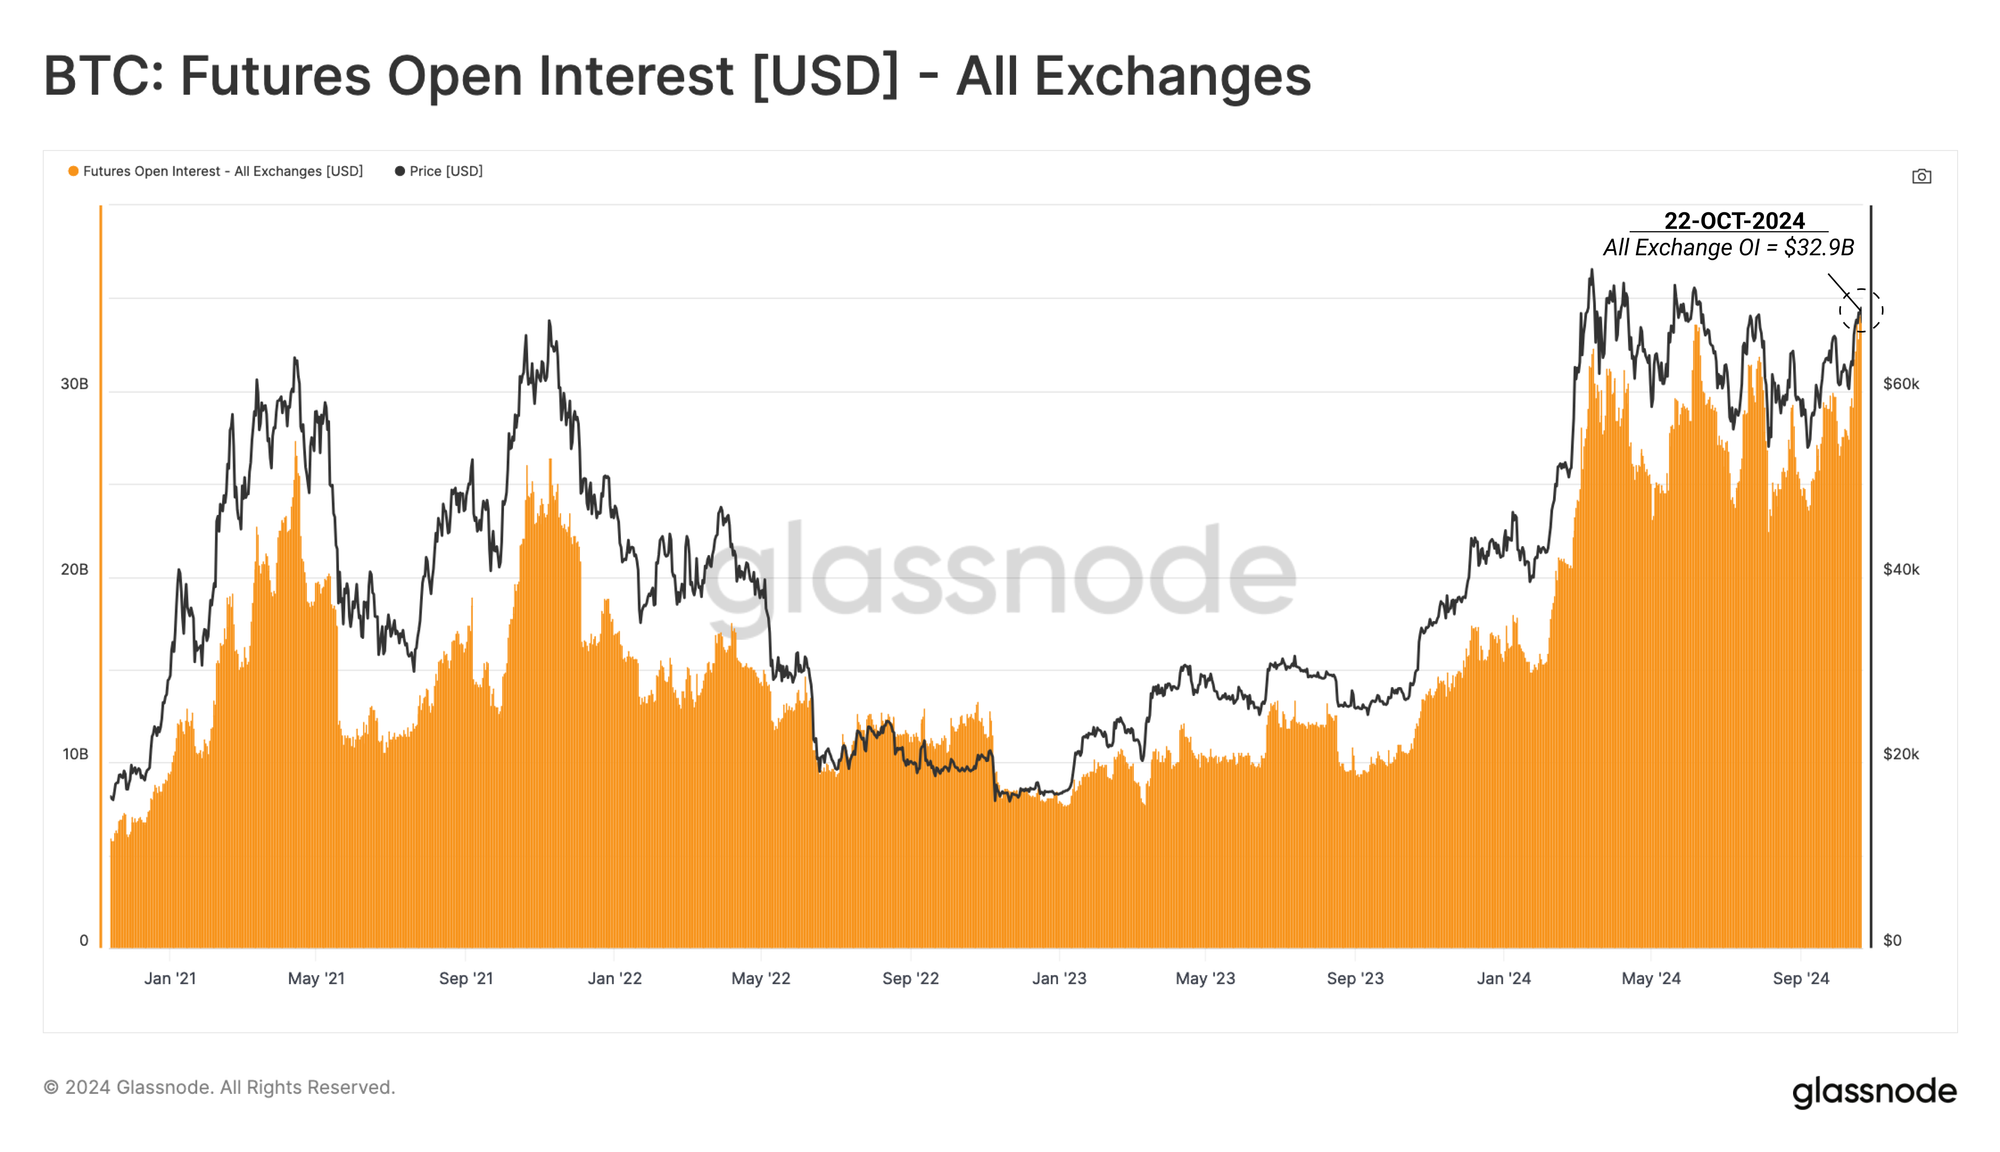
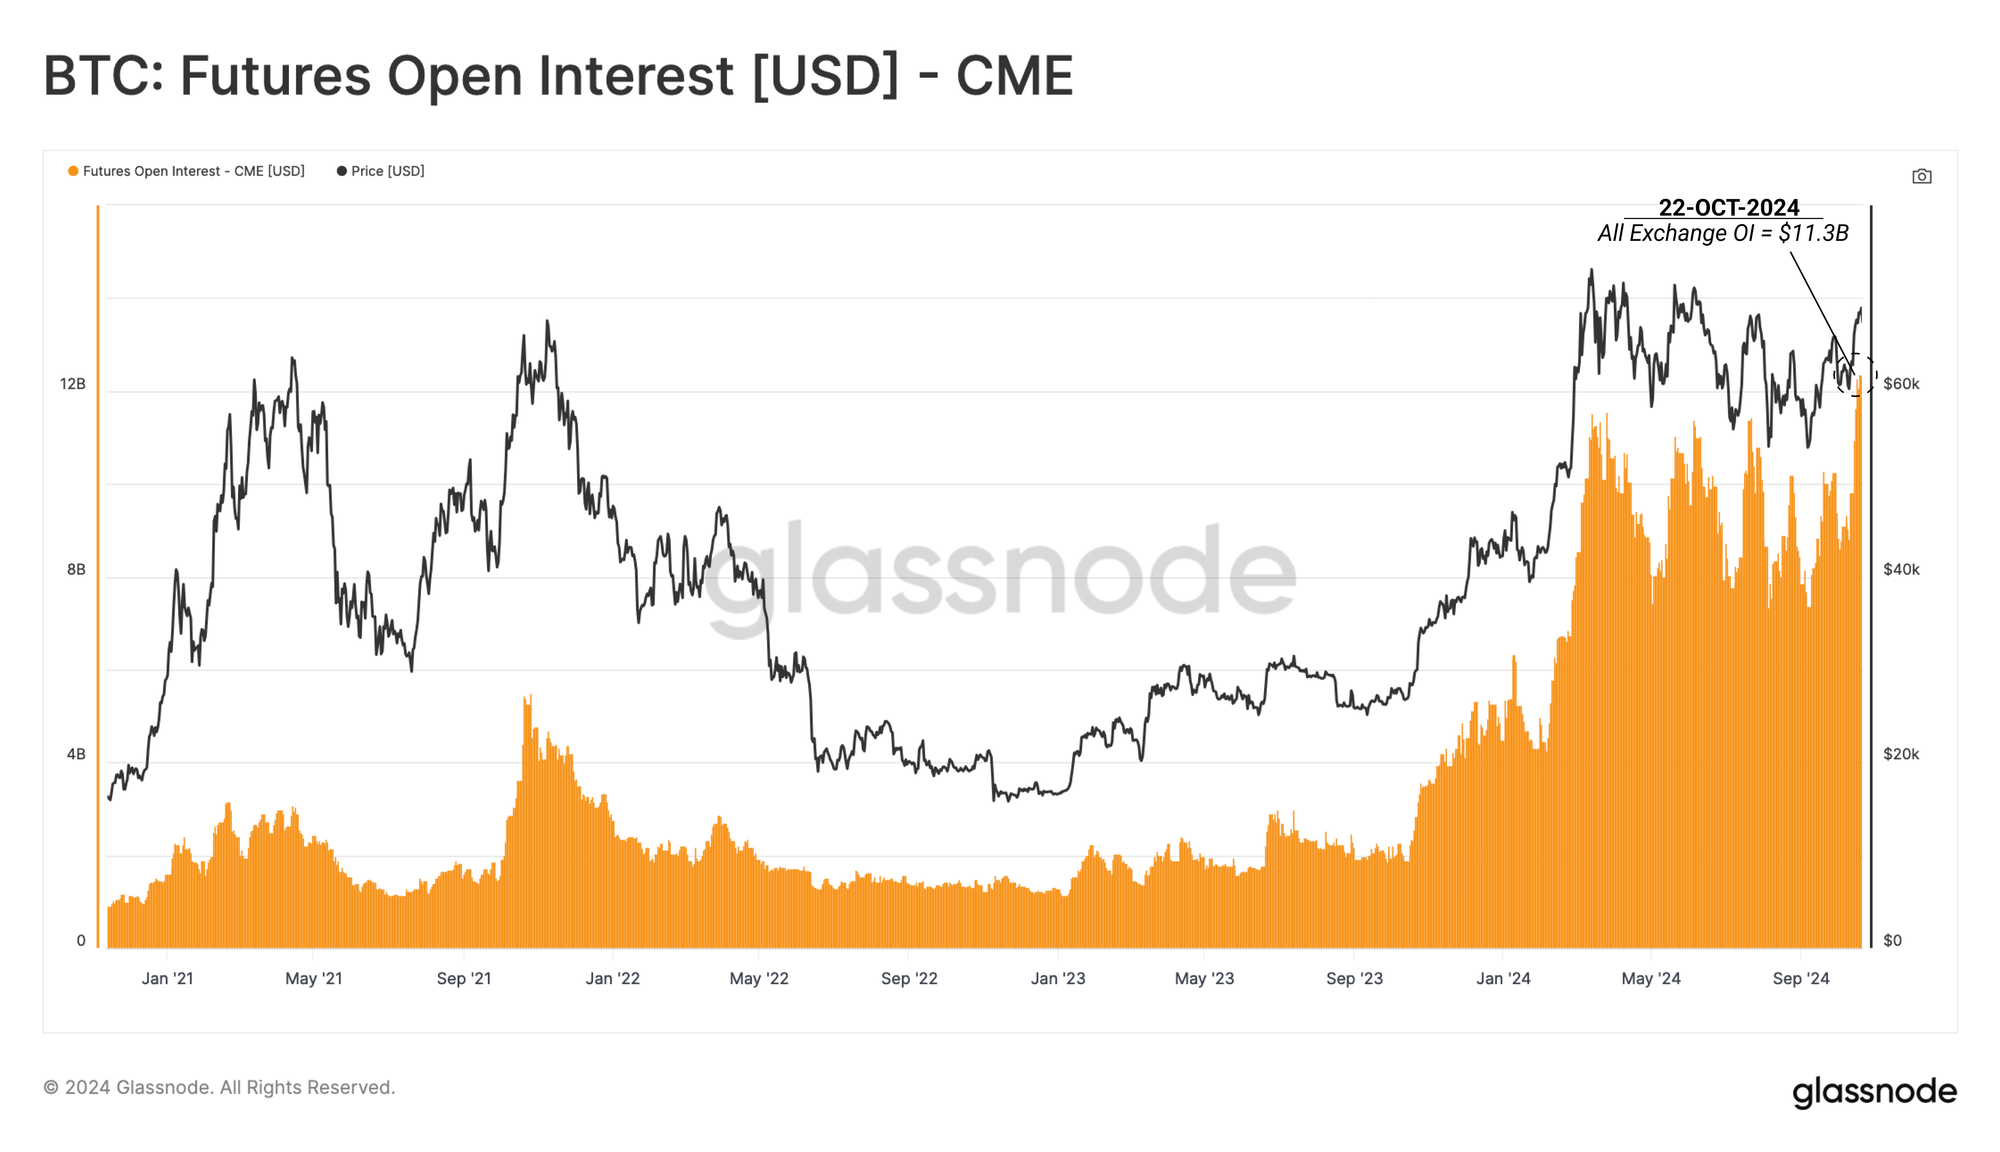
Despite the preference for perpetual swap instruments across crypto-natives, the traditional fixed-term futures contract at the CME Group has significantly driven this uptick in open interest.
This product has provided the new wave of institutional investors with an instrument for regulated derivative exposure and an opportunity to capture yield via a cash-and-carry strategy. Open Interest across CME contracts has surged to a new ATH of $11.3B, highlighting increased institutional activity within the digital asset space.
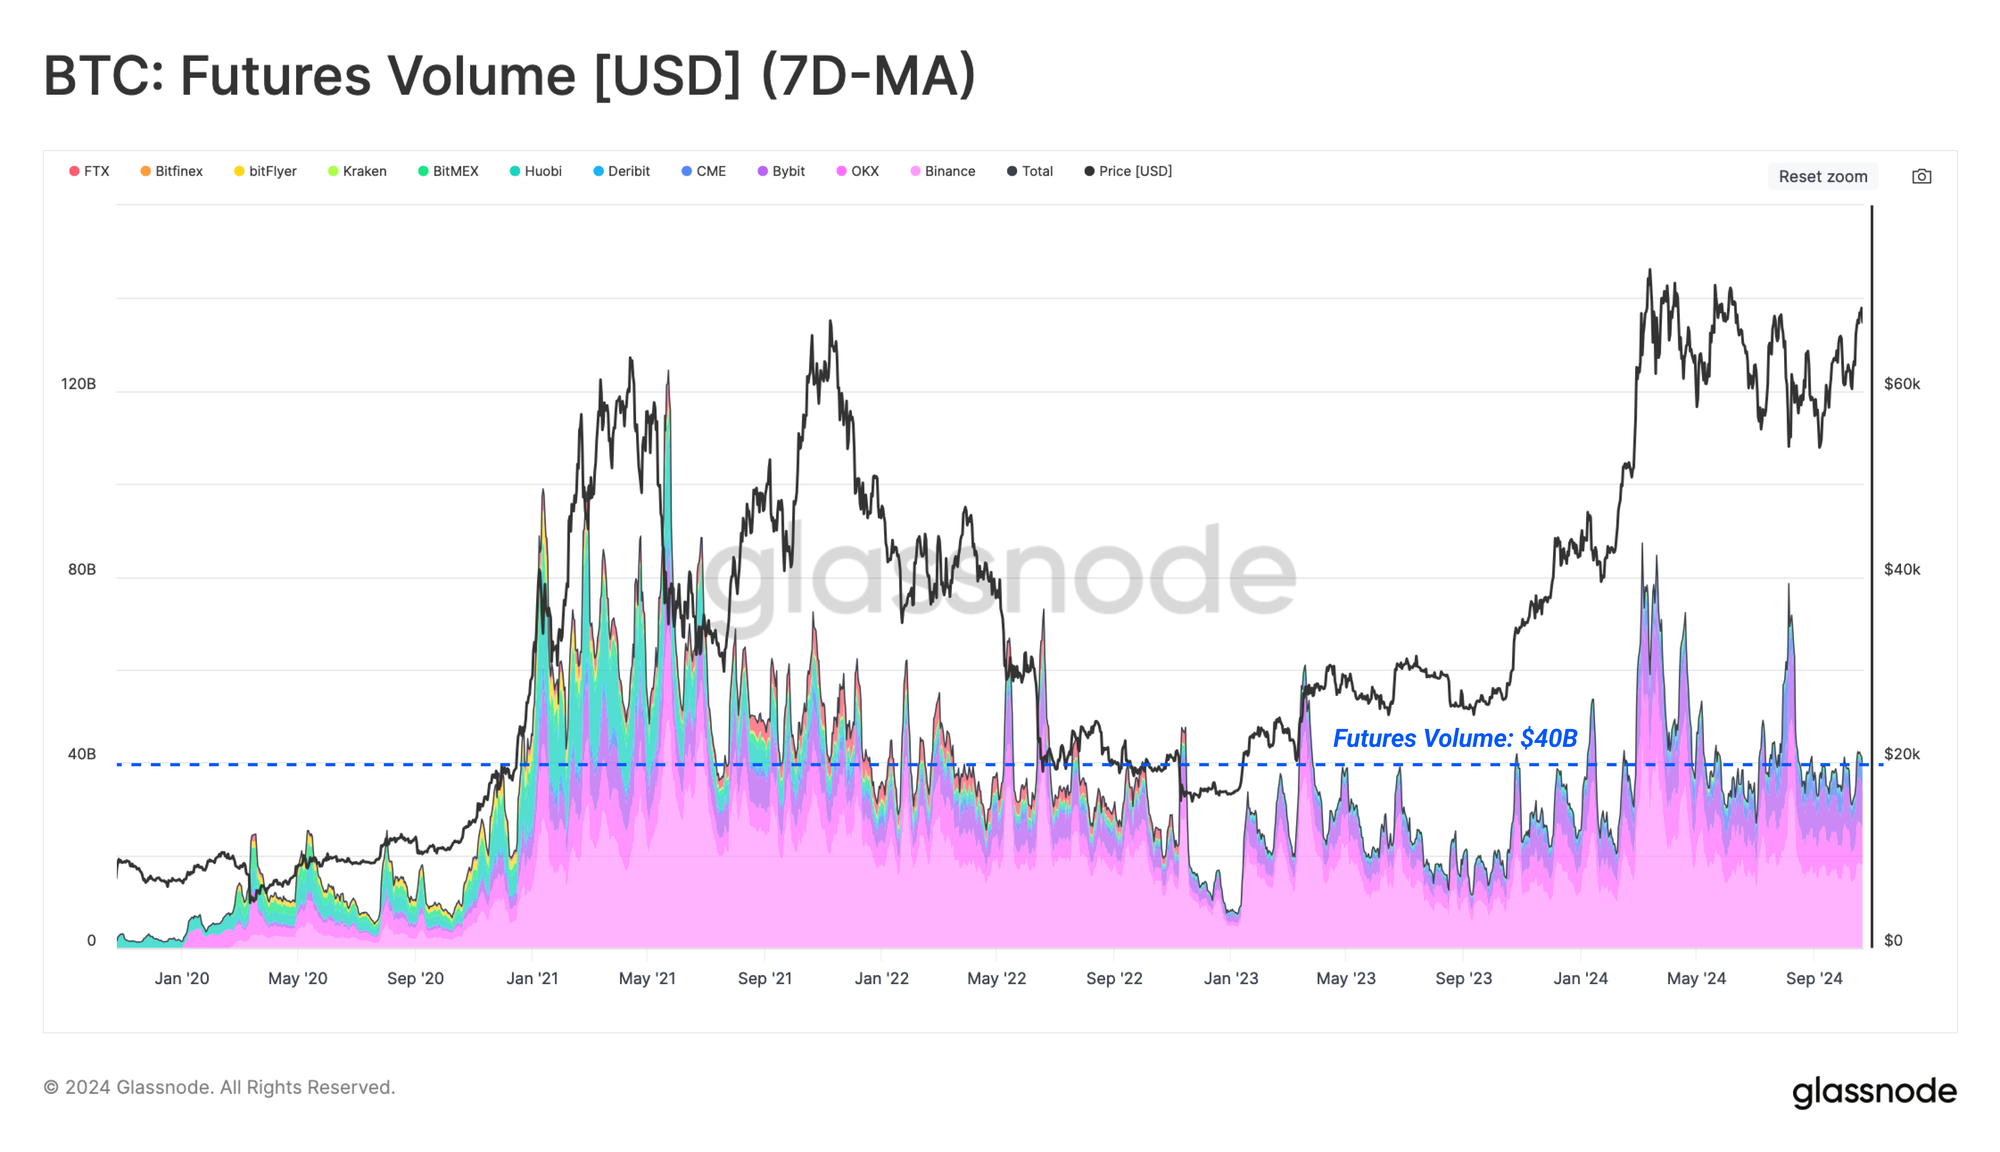
However, the volumes traded across all futures contracts ($35B per day) remain somewhat subdued, especially compared to the elevated volumes when the market peaked at the ATH in March. This suggests that there has not yet been a significant impulse in trading activity and perhaps alludes to a higher dominance of single trade basis strategies and arbitrage positions within futures markets.
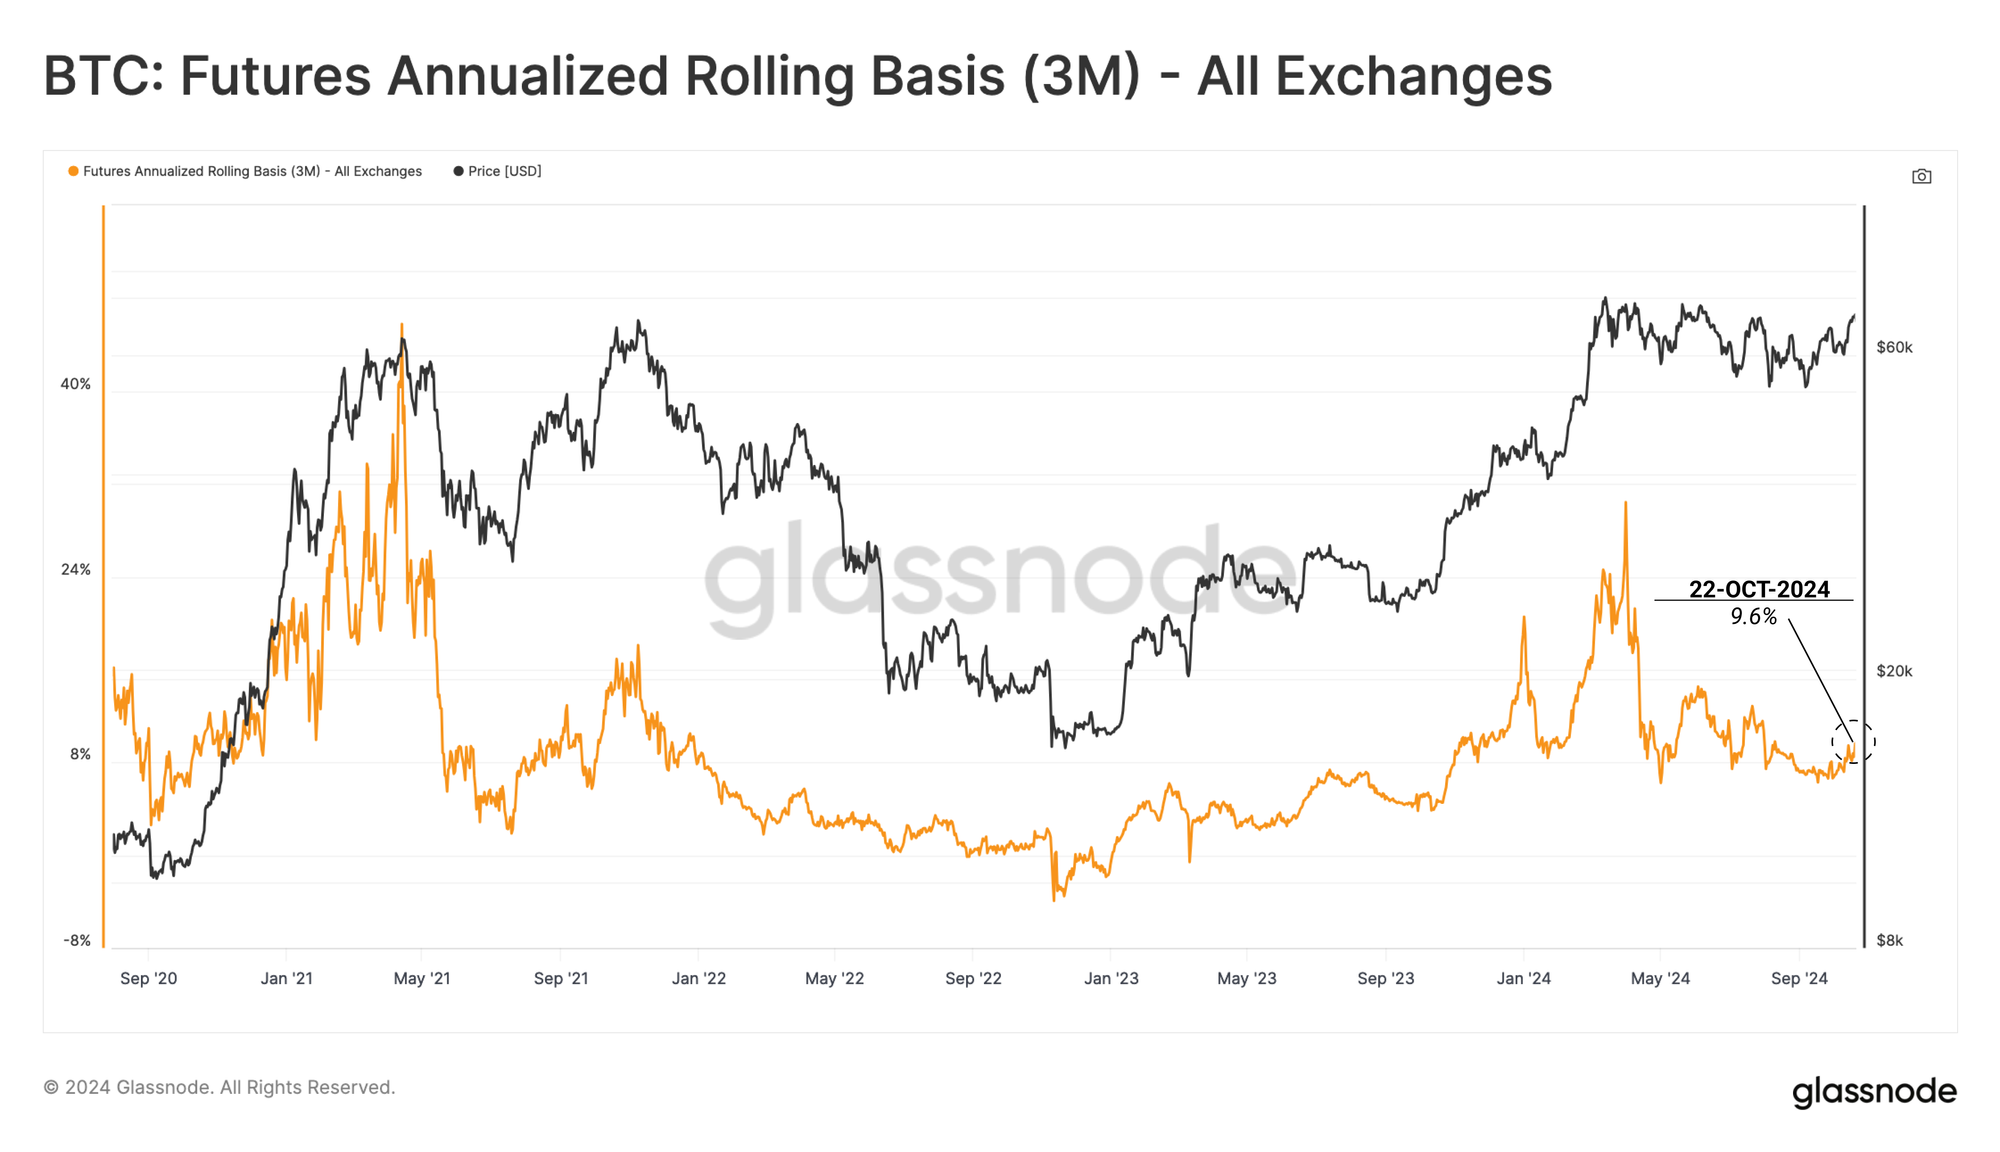
The yield available via Cash-and-Carry strategies is around 9.6%, almost double the ‘risk-free’ rate available from short-term US Treasuries. With additional Fed rate cuts expected in the months ahead, this basis trade will likely continue attracting institutional traders, further expanding market liquidity for Bitcoin.
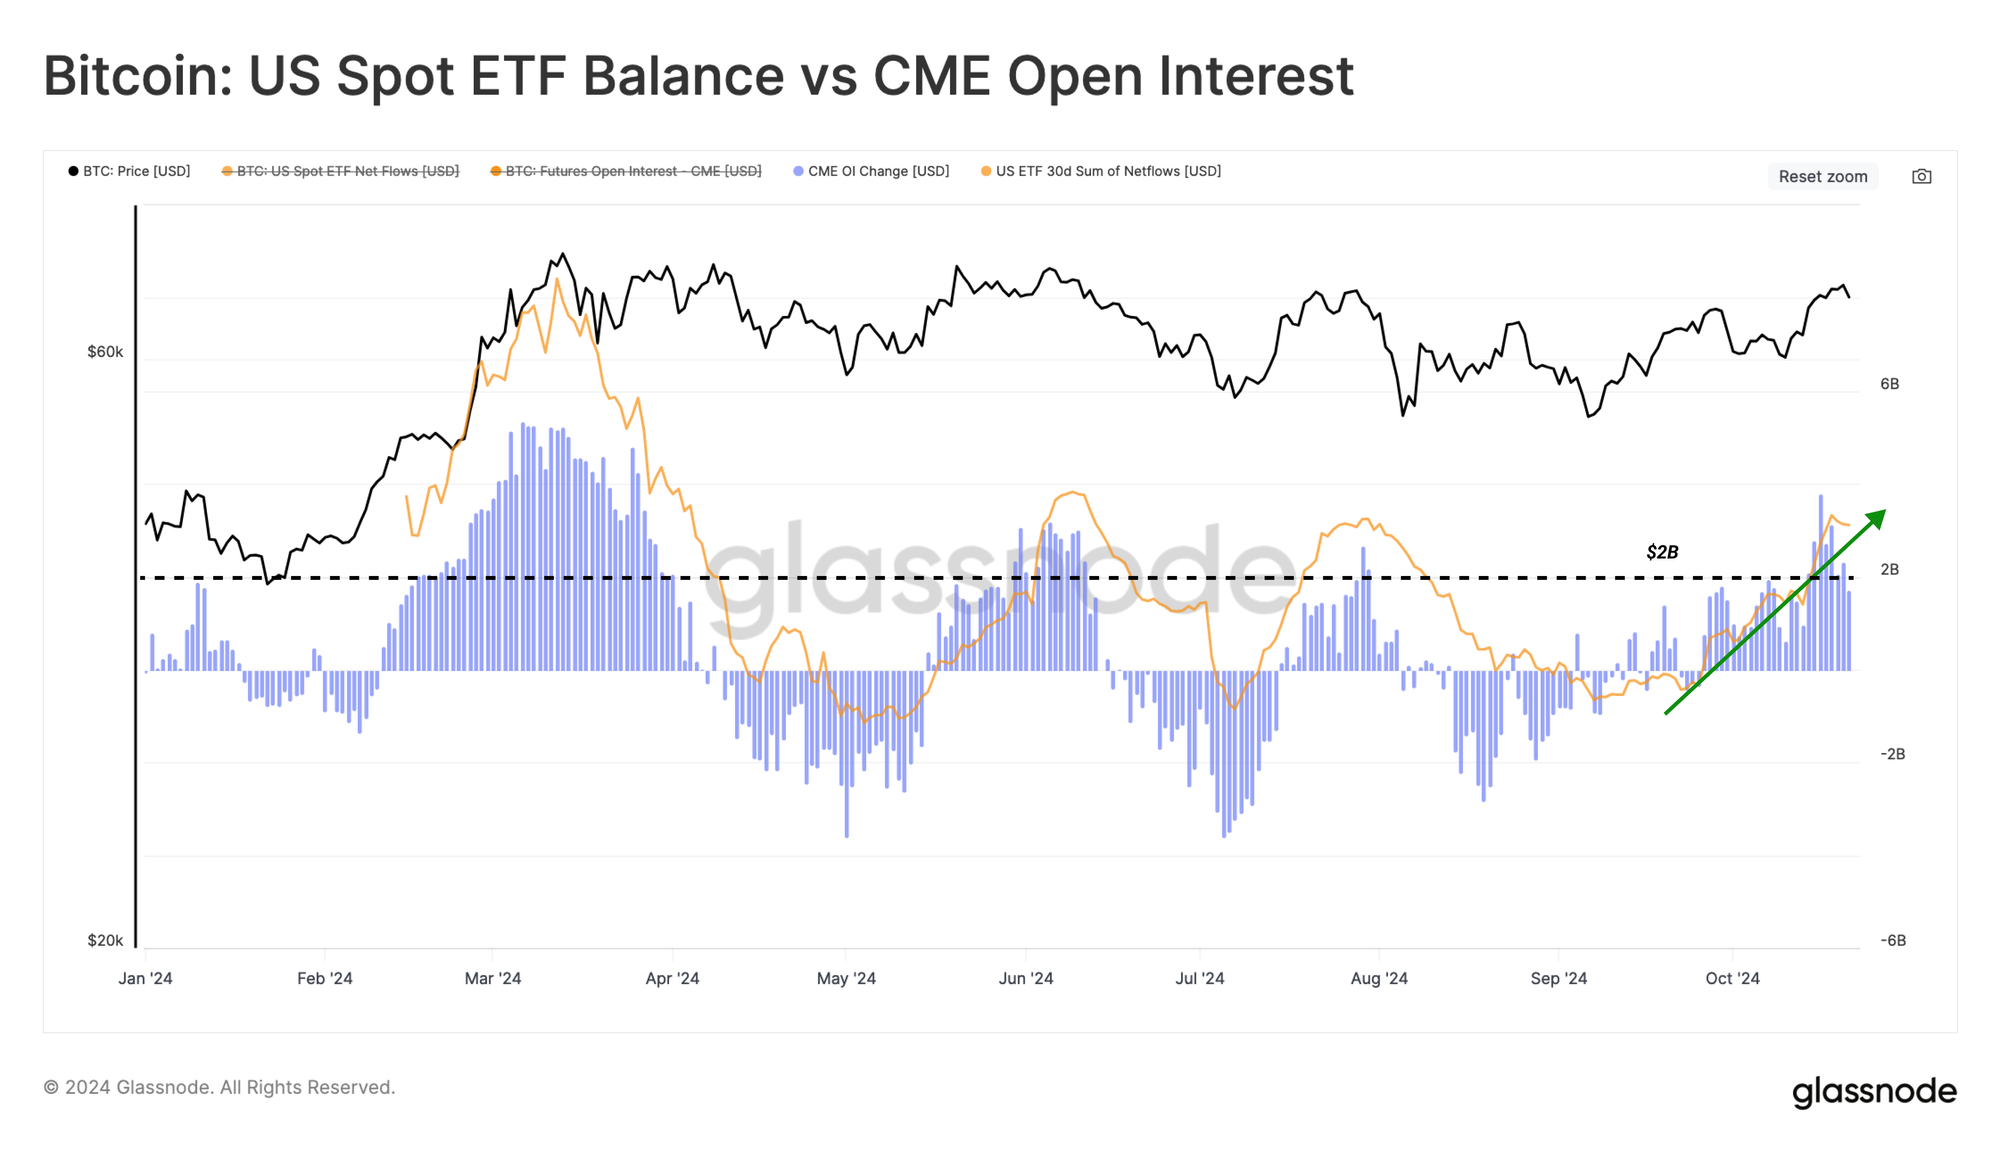
Further evidence of an increased cash-and-carry trade can be found by comparing the 30D sum of ETF netflows and the 30D change in CME open interest.
🟠 30-day sum of ETF net flows
🔵 30-day change in CME open interest
We can see a similar magnitude between these two metrics, which suggests a relationship between long-spot positions via Bitcoin ETFs and a short position via CME futures contracts to capture the yield.
Summary and Conclusions
Positive market momentum continues to develop with the Bitcoin market, with the spot price breaking above several key technical and on-chain price levels. This has brought many investor positions back into a state of unrealized profit, likely to be a tailwind for sentiment.
Open interest in futures markets has also expanded recently, reaching a new ATH. The dominance of the CME Group exchange highlights an increasing presence of institutional investors in the digital asset space, with strong indications that a cash-and-carry strategy is in play.
Disclaimer: This report does not provide any investment advice. All data is provided for information and educational purposes only. No investment decision shall be based on the information provided here and you are solely responsible for your own investment decisions.
Exchange balances presented are derived from Glassnode’s comprehensive database of address labels, which are amassed through both officially published exchange information and proprietary clustering algorithms. While we strive to ensure the utmost accuracy in representing exchange balances, it is important to note that these figures might not always encapsulate the entirety of an exchange’s reserves, particularly when exchanges refrain from disclosing their official addresses. We urge users to exercise caution and discretion when utilizing these metrics. Glassnode shall not be held responsible for any discrepancies or potential inaccuracies. Please read our Transparency Notice when using exchange data.
- Join our Telegram channel.
- For on-chain metrics, dashboards, and alerts, visit Glassnode Studio
- For automated alerts on core on-chain metrics and activity on exchanges, visit our Glassnode Alerts Twitter