Ethereum price jumped over 5% and surpassed $1,850 against the US Dollar. ETH might extend its rally if it clears the $1,920 and $2,000 resistance levels.
Ethereum gained bullish momentum after it broke the $1,850 resistance.
The price is trading above $1,850 and the 100-hourly Simple Moving Average.
There was a break above a rising channel with resistance near $1,880 on the hourly chart of ETH/USD.
The pair could rise further if it clears the $1,920 resistance zone.
Ethereum Price Rallies 5%
Ethereum price formed a base above the $1,760 support zone. ETH remained well-bid and started a fresh increase above the $1,800 and $1,820 resistance levels.
It outperformed Bitcoin when there was a clear move above the $1,850 resistance zone. The price rallied over 5% and surpassed the $1,880 resistance zone. During the increase, there was a break above a rising channel with resistance near $1,880 on the hourly chart of ETH/USD.
Ether traded to a new monthly high at $1,924 and is currently consolidating gains. It is now trading above $1,850 and the 100-hourly Simple Moving Average.
The bulls are now protecting the 23.6% Fib retracement level of the upward move from the $1,859 swing low to the $1,924 high. On the upside, the price is facing resistance near the $1,925 level. The next major resistance is near the $1,965 zone.
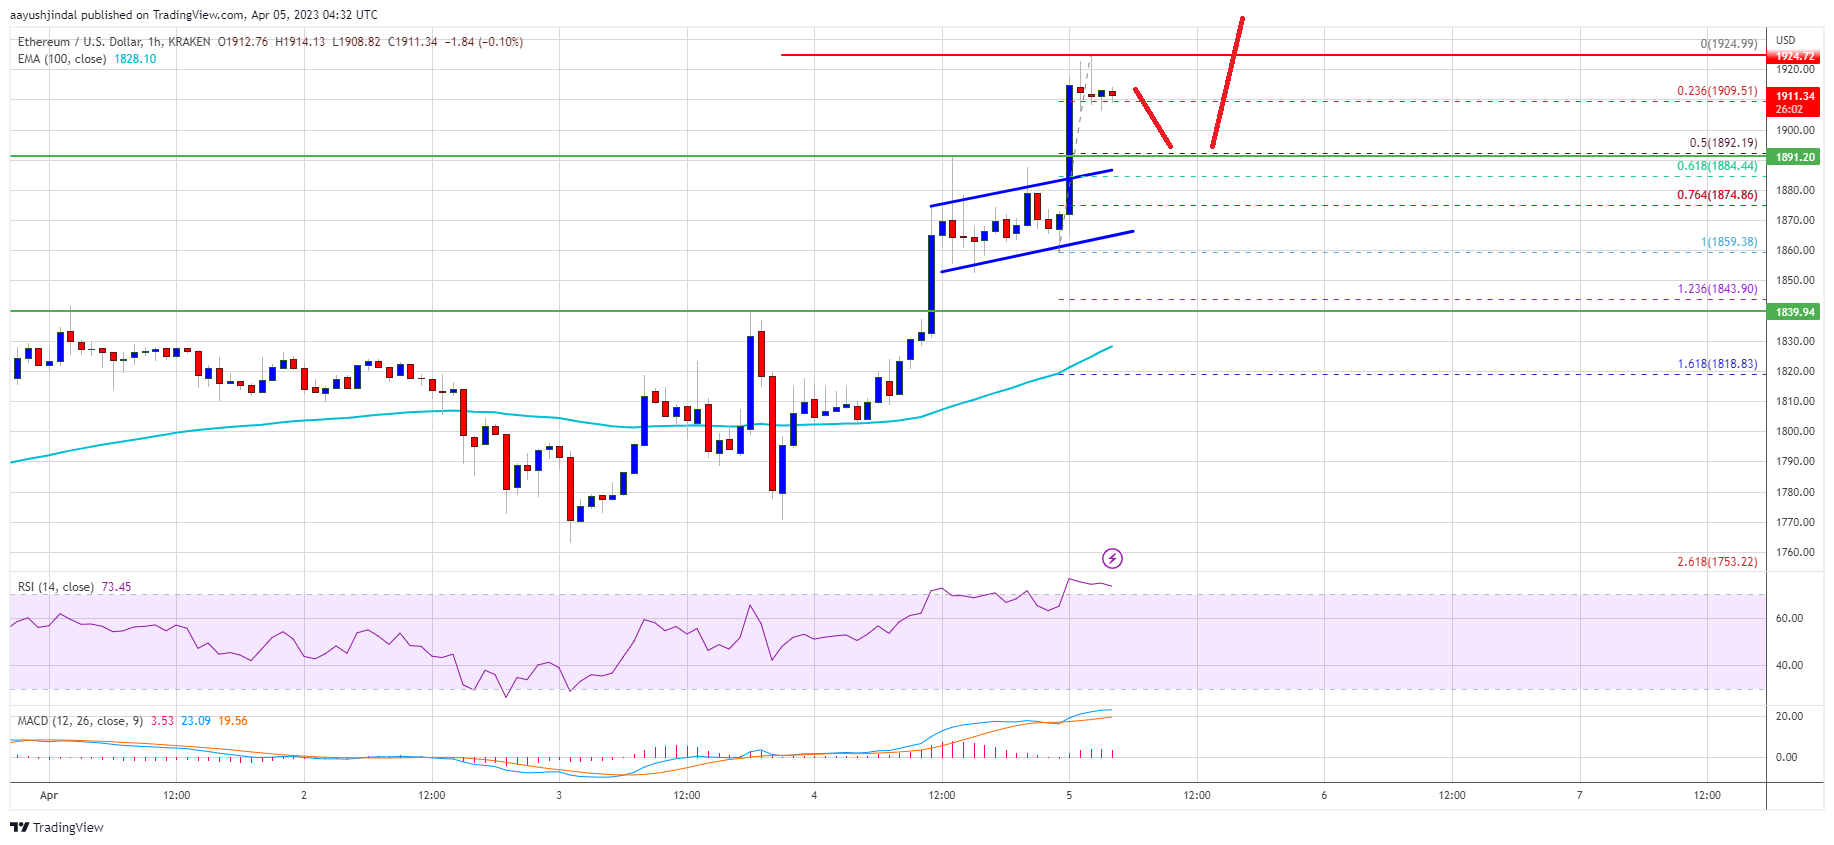
The main resistance is now near $2,000. A clear move above the $2,000 resistance zone might start a strong increase. The next major resistance might be $2,120. Any more gains could set the pace for a test of the $2,050 resistance.
Are Dips Supported in ETH?
If Ethereum fails to clear the $1,925 resistance, it could start a downside correction. Initial support on the downside is near the $1,900 level.
The next major support is near the $1,880 zone or the 61.8% Fib retracement level of the upward move from the $1,859 swing low to the $1,924 high, below which ether price might decline towards the $1,860 level. The main support is now near the $1,840 zone. If there is a break below $1,840, the price might resume its decline toward $1,800.
Technical Indicators
Hourly MACD – The MACD for ETH/USD is now losing momentum in the bullish zone.
Hourly RSI – The RSI for ETH/USD is now above the 50 level.
Major Support Level – $1,840
Major Resistance Level – $1,925