Решающая битва между быками и медведями на пороге: три стратегии для краткосрочной прибыли | Приглашенный анализ
BTC: Ключевые уровни и сценарии на неделю 5-11 января
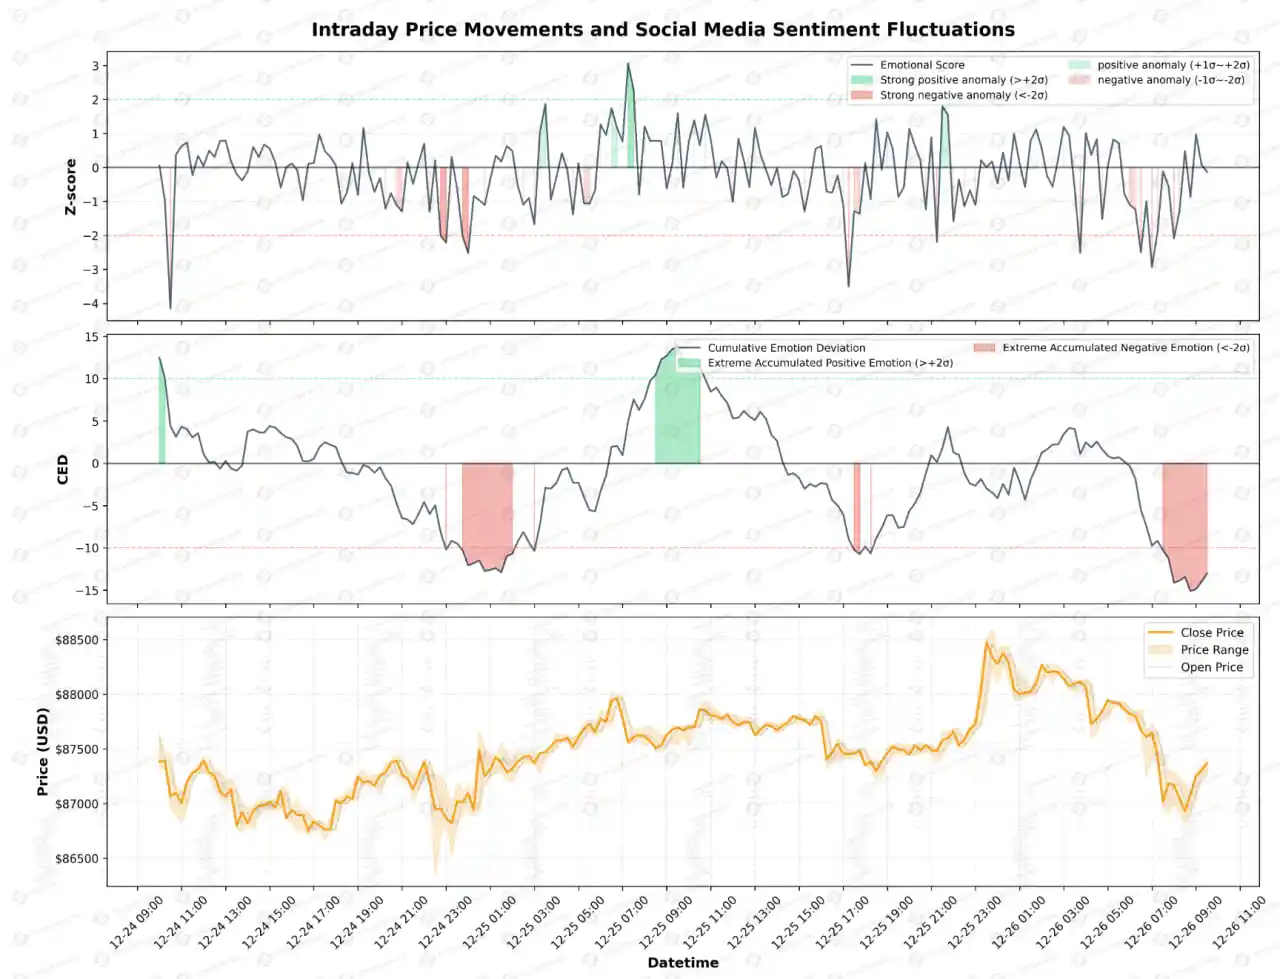
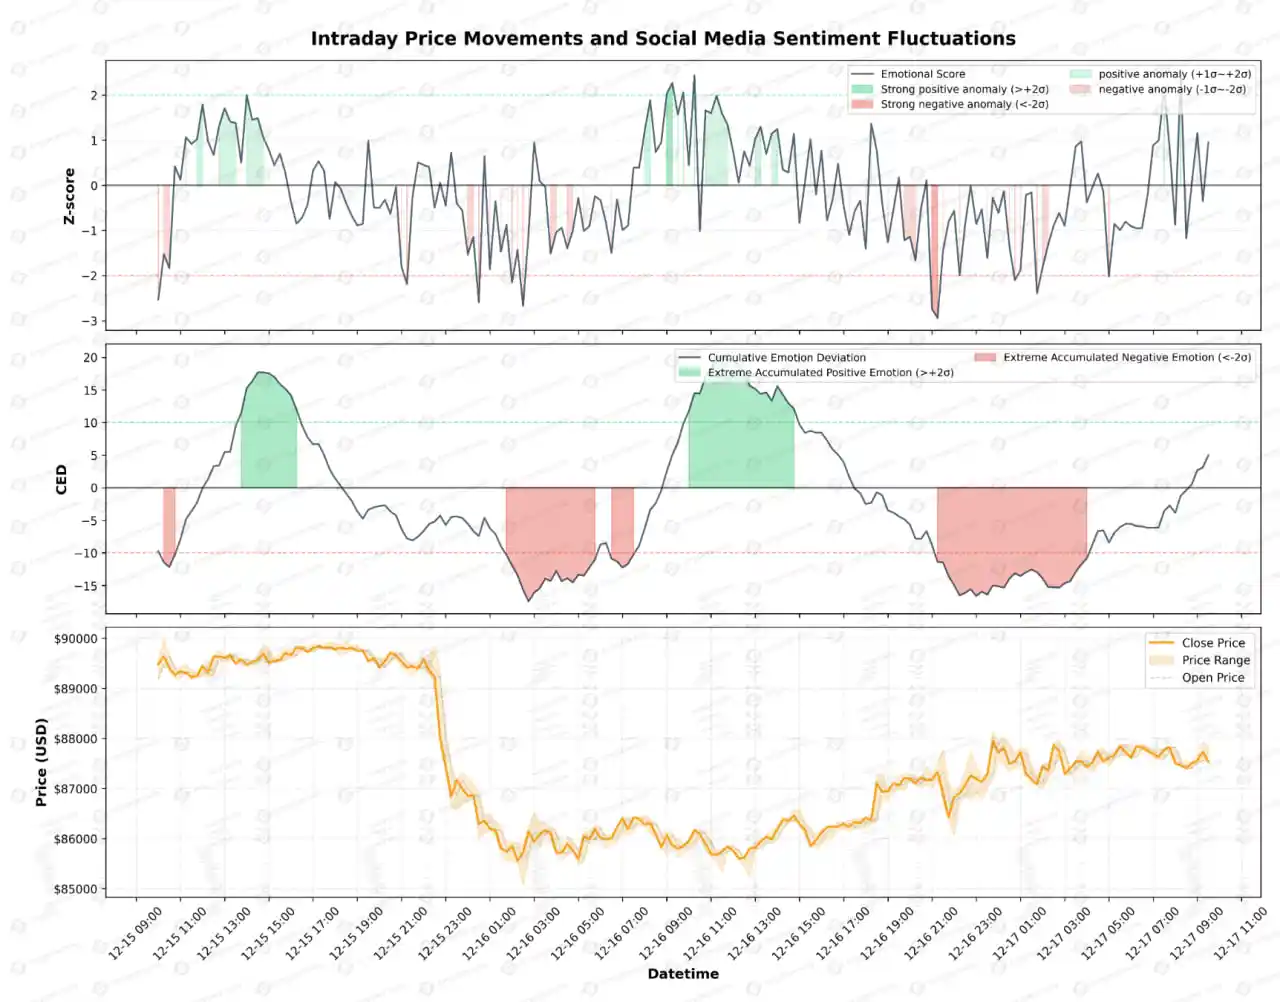
Аналитик Коди Фэн подводит итоги прошедшей недели: BTC подтвердил прогноз, удерживаясь в диапазоне $86,500–$91,000. Выполнены две короткие сделки с общим доходом 0.62%.
На предстоящую неделю ключевые уровни:
- Сопротивление: $93,000–$94,500 (первое), $97,500–$99,500 (второе), $104,000 (важное)
- Поддержка: $89,500–$91,000 (первая), $86,000–$86,500 (вторая), $83,500–$84,500 (третья), $80,000 (важная)
Основные сценарии:
A) Консолидация $84,000–$94,500: открывать короткие позиции на отскоке к $93,000–$94,500
B) Пробитие поддержки $84,000: цель $80,000
C) Прорыв сопротивления $94,500: цель $97,500
Риск-менеджмент: стоп-лосс при открытии, перемещение при прибыли 1% и 2%.
Ключевые события недели: выступления представителей ФРС, данные ADP по занятости (среда), заявки на пособие по безработице (четверг), отчет по занятости в несельскохозяйственном секторе (пятница).
marsbit01/05 07:50