Odaily приглашенный аналитик рынка Conaldo, магистр финансовой статистики Колумбийского университета (США). Со времен университета специализируется на количественной торговле акциями США, постепенно расширяя деятельность до цифровых активов, таких как биткоин. На практике создал систематизированную модель количественной торговли и систему управления рисками; обладает острым пониманием данных о рыночной волатильности и стремится к постоянному углублению знаний в области профессиональной торговли, добиваясь стабильной доходности. Еженедельно будет глубоко анализировать изменения в BTC с технической, макроэкономической и денежной точек зрения, проводить разбор и демонстрировать практические стратегии, а также анонсировать важные события на ближайшее время для вашего сведения.

Ключевые выводы еженедельного торгового отчета:
• Исполнение стратегии (краткосрочная): На прошлой неделе торговля строго следовала установленной стратегии, была совершена одна краткосрочная операция (плечо 1x) с доходностью -1.07%. (Подробности на Рис. 1)
• Подтверждение ключевой точки зрения (краткосрочная): Ключевая точка зрения, выдвинутая на прошлой неделе, была точно подтверждена рынком. На прошлой неделе цена монеты пробила важный диапазон сопротивления $94,500~$95,000 и в настоящее время подтверждает его действенность. Максимальная цена достигла $97,963, что отличается от данной нами нижней границы зоны сопротивления $97,500 менее чем на 0.5%, что вновь подтверждает наши способности к определению ключевых уровней.
• Прогноз行情 на следующие недели: Собирается ли биткоин перейти от медвежьего рынка к бычьему? Является ли текущий рынок отскоком или разворотом? 21-недельная скользящая средняя в ближайшие недели может стать разделительной линией между быками и медведями. (Подробное объяснение на Рис. 4)
Далее следует подробный обзор предсказания行情, исполнения стратегии и конкретного торгового процесса.
一、Обзор прошедшей недели для биткоина (12.01~18.01):
1、Обзор краткосрочных операций на прошлой неделе: Как показано на (Рис. 1)
Мы строго следовали торговым сигналам, подаваемым нашей собственной моделью торговли на спредах и количественной моделью импульса, в сочетании с прогнозом рыночного тренда, совершили одну краткосрочную операцию, в данной сделке убыток составил 1.07%.
Конкретные детали сделки и разбор如下:
График биткоина с 30-минутными свечами: (Количественная модель импульса + Модель торговли на спредах)
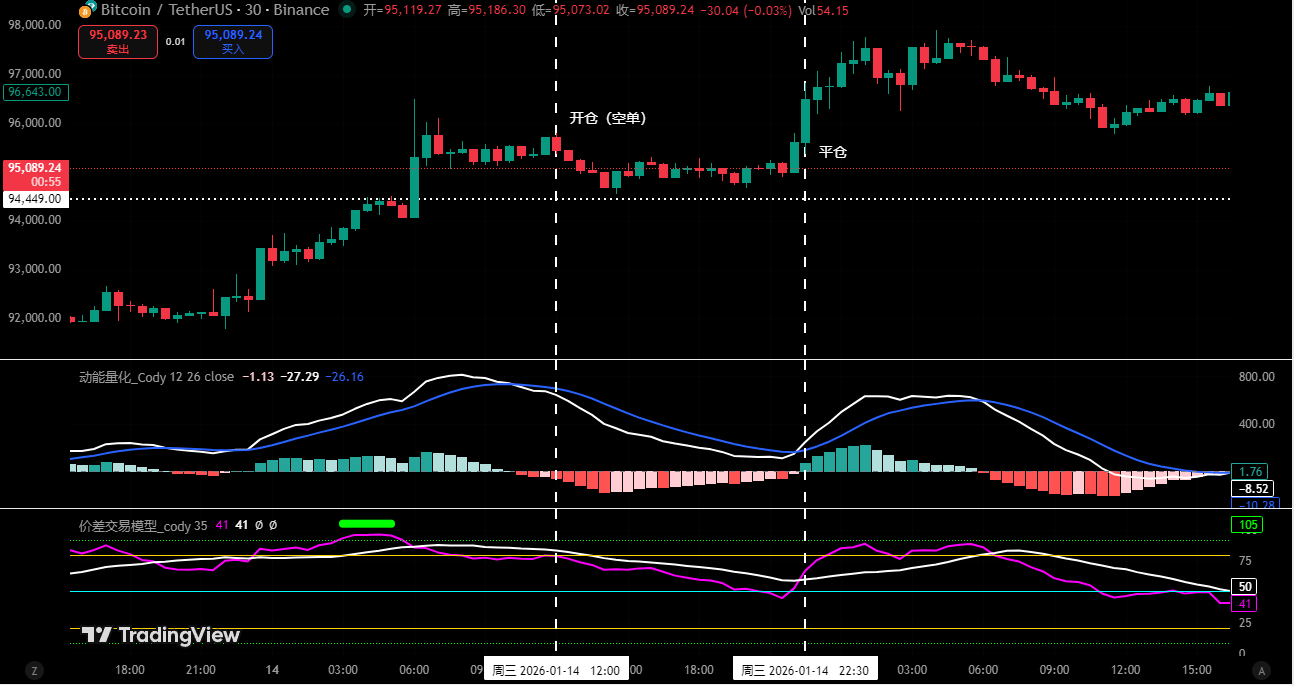
Рисунок 1
1、Сводка деталям сделки: (Без плеча)
2、Разбор краткосрочной сделки:
• Первая сделка (Убыток 1.07%): Данная операция выполнялась по стратегии Вариант A (Продажа на сопротивлении у уровня сопротивления): Когда цена поднялась до ключевого диапазона сопротивления $94,500~$95,000 и появились сигналы сопротивления, одновременно модель торговли на спредах также triggered сигнал вершины (зеленая точка), образовав двойное подтверждение. Поэтому мы по плану открыли 30% короткую позицию по цене $95,460; Однако, движение рынка отклонилось от ожиданий, и цена нашла поддержку near $94,500 и перешла к росту. Когда количественная модель импульса и модель торговли на спредах вновь подали сигнал дна, мы немедленно закрыли позицию с止损 на $96,493. Хотя данная сделка resulted in убытке, мы строго следовали операционной дисциплине «Сработал сигнал — совершаем сделку, приоритет управления рисками», добившись единства знания и действия.
2、Обзор прогноза движения и операционной стратегии на прошлой неделе:
1、На прошлой неделе четко указано: Сохранять колебания в диапазоне $84,000~$94,500, ключевое наблюдение за выбором направления и действенностью на обоих концах диапазона.
2、Обзор ключевых уровней: Уровень сопротивления смотреть в области $94,500~$95,000, важный уровень сопротивления смотреть near $97,500~$99,500; поддержка смотреть в области $89,500~$91,000.
2、Обзор операционной стратегии:
• Среднесрочная стратегия: Если цена успешно пробивает и закрепляется above $94,500, закрыть все среднесрочные позиции (шорты), держать монеты и наблюдать.
• Краткосрочная стратегия: Если сохраняются колебания в диапазоне $84,000~$94,500, то действовать согласно Варианту A:
• Открытие позиции: При отскоке до области $94,500~$95,000 в сочетании с сигналом вершины модели, можно открыть 30% короткую позицию.
• Управление рисками: Начальный止损 для шорта устанавливается above цены входа на 1.5% nearby (т.е. 1.015*цена входа).
• Закрытие позиции: При снижении до nearby ключевого уровня поддержки в сочетании с сигналами модели, можно постепенно закрывать позицию и фиксировать прибыль.
二、Анализ структуры движения биткоина с технической точки зрения: комплексное исследование на основе множественных моделей и измерений
Совмещая с рыночным движением, автор на основе собственной торговой системы проводит глубокий анализ структуры движения биткоина с уровней множественных моделей и измерений.
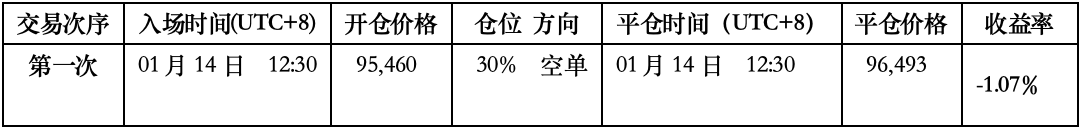
График биткоина с недельными свечами: (Количественная модель импульса + Количественная модель настроений)
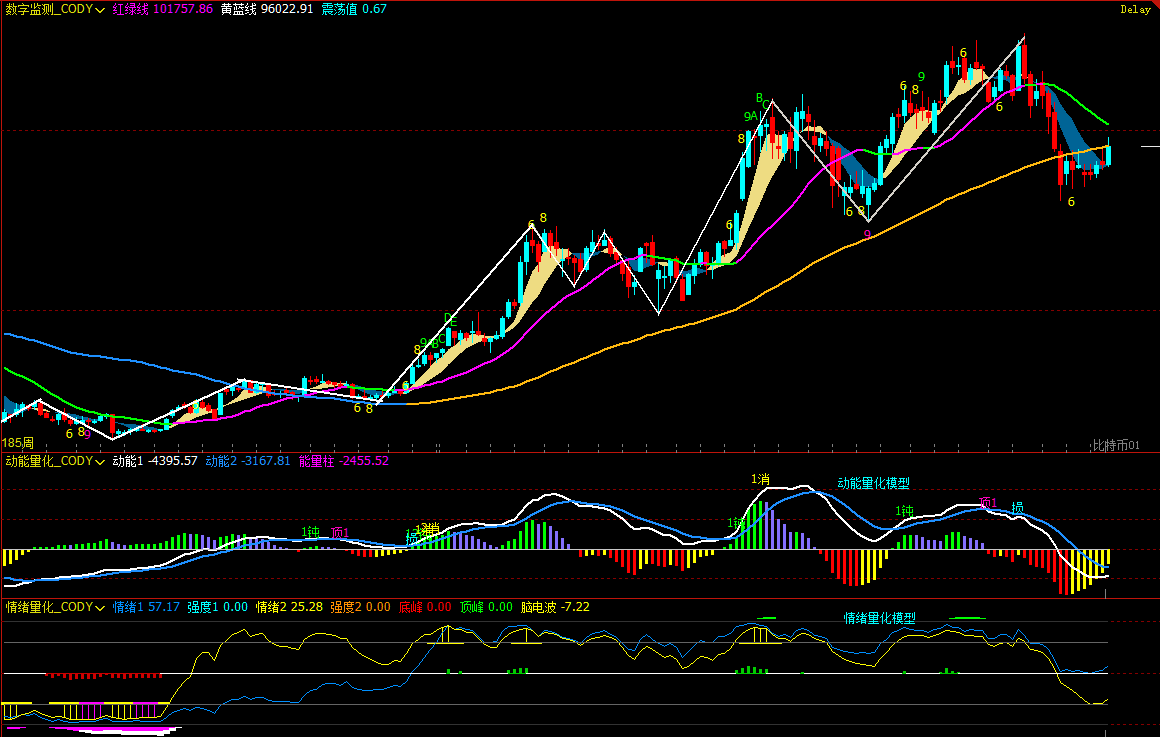
Рисунок 2
1、Как показано на (Рис. 2), анализ по недельному графику:
• Количественная модель импульса: Технические индикаторы показывают, что, продолжая форму предыдущих недель, линии импульса постепенно сближаются, одновременно столбики отрицательной энергии продолжают сокращаться. Однако, текущие сигналы не подтверждают разворот медвежьего тренда.
Количественная модель импульса предвещает: Индекс падения цены монеты: Высокий
• Количественная модель настроений: Значение синей линии настроений 57.17, интенсивность ноль; значение желтой линии настроений 25.28, интенсивность ноль, пиковое значение 0.
Количественная модель настроений предвещает: Индекс давления и поддержки цены монеты: Нейтральный
• Модель цифрового мониторинга: Цена монеты跌破 линии разделения быков и медведей (желто-синяя линия) уже 9 недель. На прошлой неделе быки вновь атаковали эту линию, закрытие nearby линии.
Модель цифрового мониторинга предвещает: Сигналы цифрового мониторинга (вершины/дна) не появились; недельная свеча закрылась средняя бычья свеча, прирост около 2.92%.
Вышеуказанные данные предвещают: Недельный медвежий тренд биткоина, необходимо остерегаться рисков корректировки колебаний.
График биткоина с дневными свечами: (Количественная модель импульса + Количественная модель настроений)
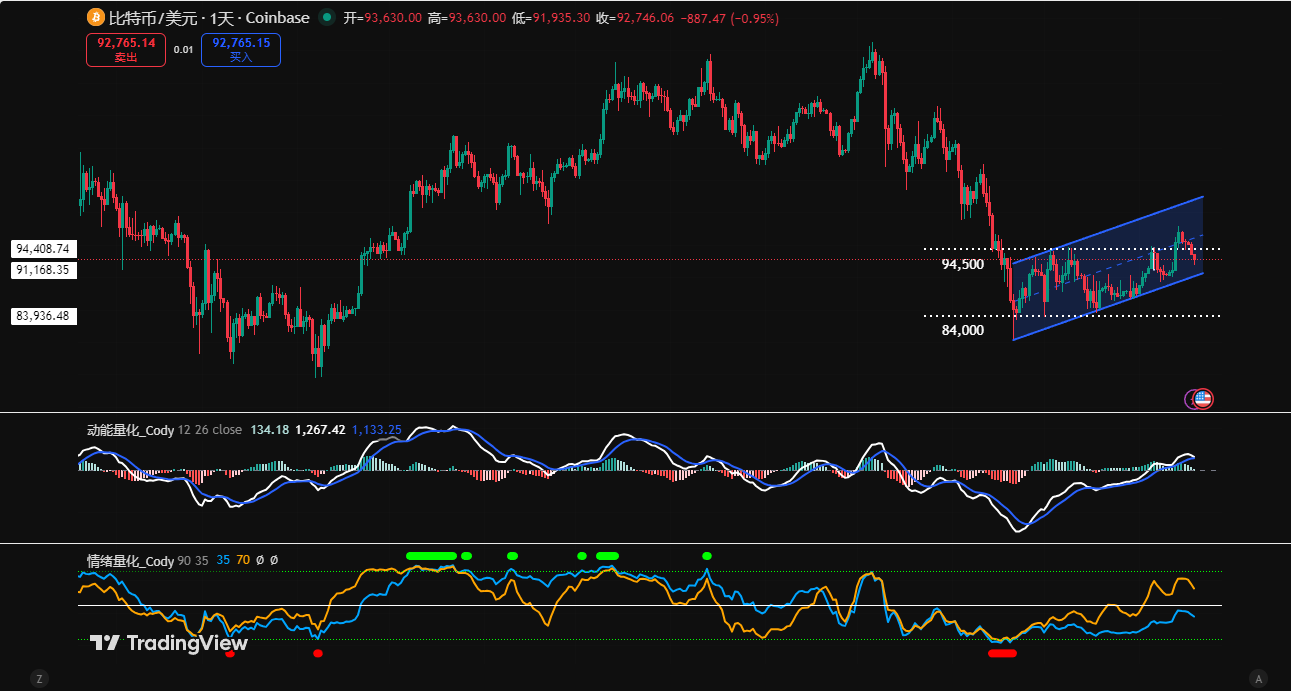
Рисунок 3
2、Как показано на (Рис. 3), анализ по дневному графику:
• Количественная модель импульса: На прошлой неделе в целом呈现走势 «сначала рост, затем спад». В первой половине недели цена ускорила отскок, линия импульса встала above нулевой оси, столбики положительной энергии быстро увеличились; но во второй половине столбики энергии明显萎缩, линии импульса вновь趋于粘合, начали медленно приближаться к нулевой оси.
Количественная модель импульса предвещает: Дневная энергия покупок показывает истощение, следить за得失 нулевой оси.
• Количественная модель настроений: После закрытия прошлой недели значение синей линии настроений 38, интенсивность ноль; значение желтой линии настроений 76, интенсивность ноль.
Количественная модель настроений предвещает: Индекс давления и поддержки: Нейтральный
Вышеуказанные данные提示: Дневной отскок продолжается, рынок初次呈现 бычью格局, но действенность还需要 подтверждения, далее ключевое внимание уделить борьбе быков и медведей за нулевую ось.
三、Прогноз на текущую неделю: (19.01~25.01)
1、Ключевая точка зрения недели: Ключевое внимание уделить得失 области $94,500~$95,000.
• Сопротивление действенно: Если цена отскочит до этой области и подтвердит давление, ожидается сохранение колебаний в диапазоне $84,000~$94,500, последующая首要 цель тестирования — область $89,500~$91,000.
• Действенное закрепление: Если сможет сильно закрепиться в этой области, то цена有望 колебательно отскакивать, но высота有限.
2、Ключевые уровни сопротивления:
• Первая зона сопротивления: $94,500~$95,000 (Предыдущий верхний край боковика)
• Вторая зона сопротивления: $97,500~$99,500 (Предыдущий колебательный центр)
• Важный уровень сопротивления: $102,000 nearby (21-недельная скользящая средняя nearby)
3、Ключевые уровни поддержки:
• Первый уровень поддержки: $89,500~$91,000 (Предыдущая область密集成交)
• Второй уровень поддержки: $86,000~$86,500 (Предыдущий важный уровень поддержки)
• Важный уровень поддержки: $84,000 nearby (Предыдущий нижний край боковика)
四、Операционная стратегия на текущую неделю (исключая влияние внезапных новостей): (19.01~25.01)
1、 Среднесрочная стратегия: Пустая позиция, движение行情 может быть колебательным и повторяющимся, временно держать монеты и наблюдать.
2、 Краткосрочная стратегия: Использовать 30% объема позиции, установить точки止损, на основе уровней поддержки и сопротивления искать возможности для «спреда». (В качестве операционного цикла использовать 30 минут).
3、 В операциях ключевое внимание уделить得失 области $94,500~$95,000. Для динамичного реагирования на рыночные изменения в сочетании с实时сигналами модели, мы拟定A/B два варианта краткосрочных операционных планов:
• Вариант A: Если цена закрепится в области $94,500~$95,000:
• Открытие позиции: После пробития ценой области $94,500~$95,000 появятся сигналы стабилизации в сочетании с сигналами дна модели, можно открыть 30% длинную позицию.
• Управление рисками: Начальный止损 для лонга устанавливается below цены входа на 1.5% nearby (т.е. 0.985*цена входа).
• Закрытие позиции: При отскоке до nearby ключевого уровня сопротивления в сочетании с сигналами модели, можно постепенно закрывать позицию и фиксировать прибыль.
• Вариант B: Если цена эффективно跌破 области $94,500~$95,000:
• Открытие позиции: Если отскок до этой области подтвердит эффективность пробития, можно открыть 30% короткую позицию.
• Управление рисками: Начальный止损 для шорта устанавливается above цены входа на 1.5% nearby (т.е. 1.015*цена входа).
• Закрытие позиции: При снижении до nearby $86,500 в сочетании с сигналами модели, можно постепенно закрывать позицию и фиксировать прибыль.
График биткоина с недельными свечами: Сравнительный анализ структур исторического движения (Ноябрь 2021 VS Октябрь 2025)
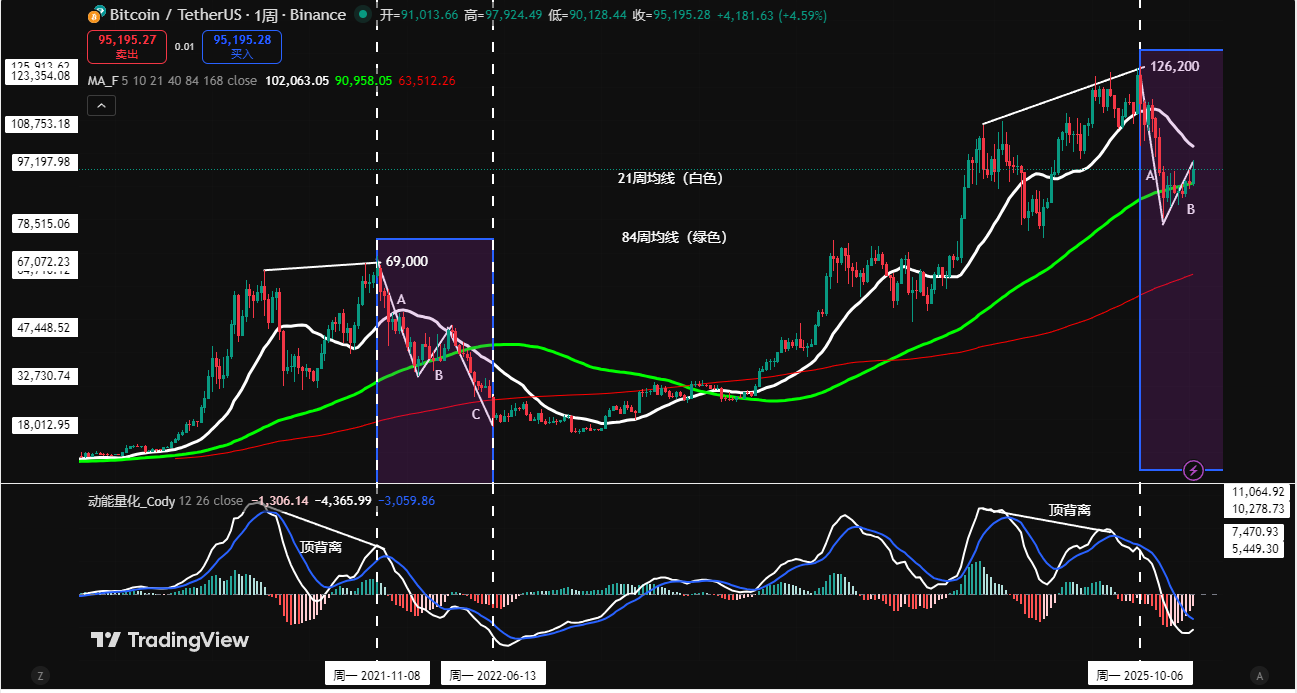
Рисунок 4
Примечание: На рисунке выше, 21-недельная скользящая средняя (белая), 84-недельная скользящая средняя (зеленая)
五、Как повторится история? Сравнение сходств и различий двух раундов недельной корректировки и启示:
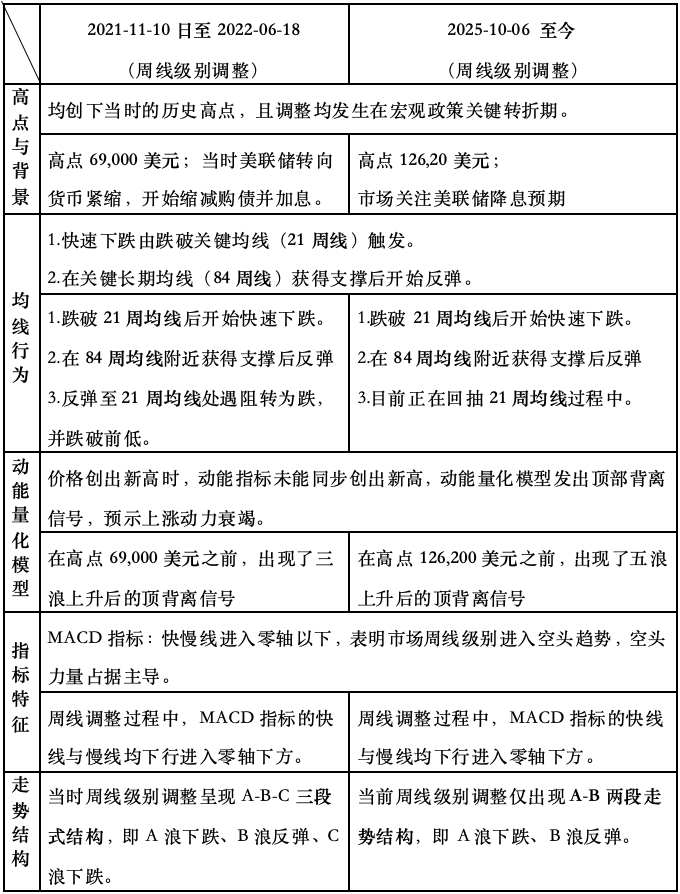
В综上所述, мы можем выделить следующие ключевые启示:
1、Текущий недельный уровень находится в медвежьем тренде, это ограничивает пространство дневного отскока.
2、В ближайшие недели, сможет ли цена эффективно пробить и закрепиться above 21-недельной скользящей средней станет фокусом внимания рынка. Если при отскоке цены к этой скользящей средней не сформируется эффективного пробития, рынок может重现 историческую格局 корректировки,甚至跌破关口 $80,000.
3、Сможет ли недельный индикатор MACD показать сигналы остановки падения и стабилизации, и линия импульса эффективно пересечет нулевую ось, станет ключевым依据 для определения, развернулся ли рыночный тренд.
六、Особое提示:
1. При открытии позиции: Немедленно установить начальный уровень止损.
2. При достижении прибыли 1%: Переместить уровень止损 на цену открытия позиции (точка безубыточности), обеспечив безопасность本金.
3. При достижении прибыли 2%: Переместить уровень止损 на позицию с прибылью 1%.
4. Постоянное отслеживание: Впоследствии при каждой дополнительной прибыли цены на 1%, уровень止损同步移动 на 1%, динамически защищая и фиксируя.
Финансовые рынки瞬息万变, все анализ行情 и торговые стратегии требуют динамической корректировки. Все точки зрения, аналитические модели и операционные стратегии,涉及 в данной статье, основаны на личном техническом анализе, предназначены только для личного торгового журнала, не являются инвестиционной рекомендацией или основанием для операций. Рынок имеет риски, инвестиции требуют осторожности, DYOR.