Родной токен Solana SOL (SOL) упал на 52% между 18 сентября и 21 ноября, следуя за общим обвалом рынка альткоинов, в результате которого Bitcoin достиг семимесячного минимума в $80 000. В результате цена SOL потеряла ключевые долгосрочные уровни поддержки, а данные ончейн- и технического анализа предполагают более глубокую коррекцию ниже $100.
Ключевые выводы:
Общая стоимость, заблокированная (TVL) в Solana, упала до шестимесячного минимума в $8,67 миллиарда.
Еженедельный объем торгов мемкоинами на Solana сократился на 95% в 2025 году.
Медвежий вымпел прогнозирует падение цены SOL до $86.
TVL Solana падает до уровней июня
Общая стоимость, заблокированная (TVL) в блокчейне Solana, упала более чем на 34% до шестимесячного минимума в $8,67 миллиарда в среду с пика в $13,22 миллиарда, достигнутого 14 сентября. TVL Solana оставалась ниже $10 миллиардов в течение последних 30 дней.
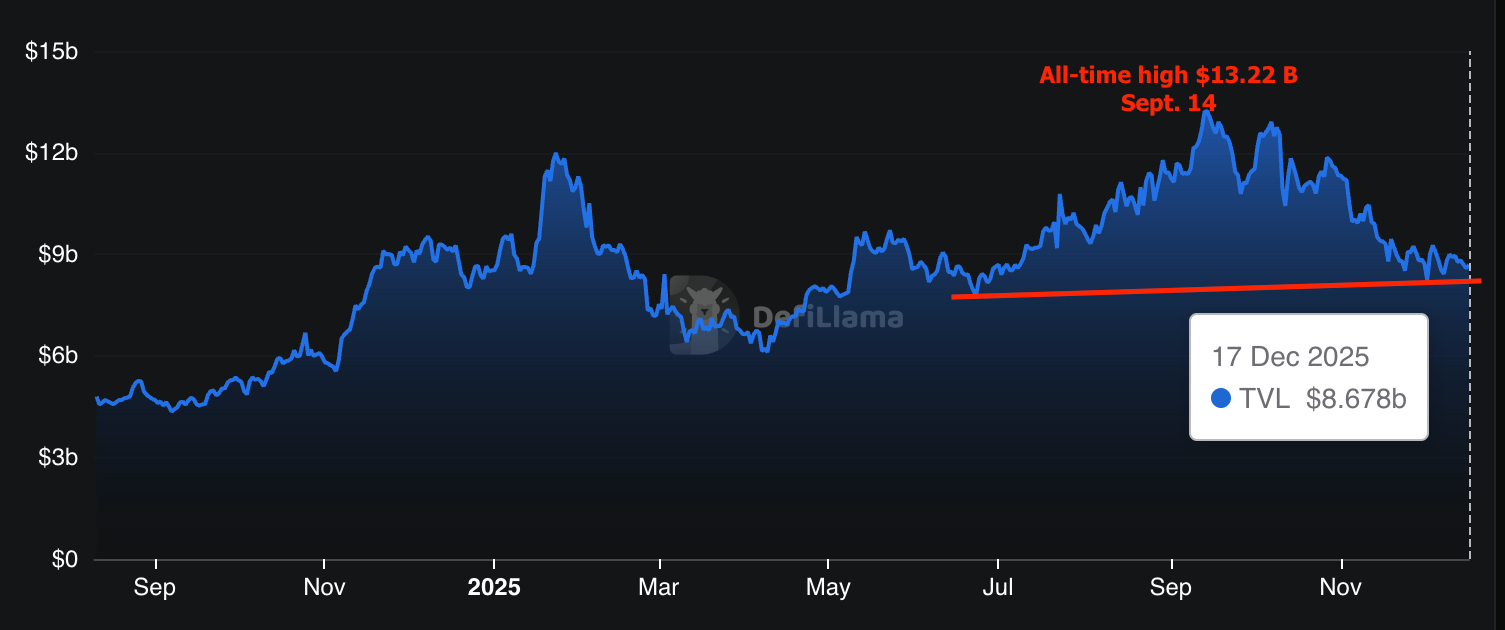
Данные DefiLlama показывают, что последующее падение TVL было вызвано ликвидационным стейкингом Jito, который снизился на 53% с середины сентября. Другие крупные децентрализованные приложения, такие как Jupiter DEX, Raydium и Sanctum protocol, зарегистрировали снижение на 30%, 46% и 46% соответственно.
По теме: ETF на Solana фиксируют 7-дневный приток средств несмотря на падение цены
Потенциал падения SOL ниже $100 подтверждается снижением комиссий сети Solana, количества активных адресов и количества транзакций за последние семь дней.
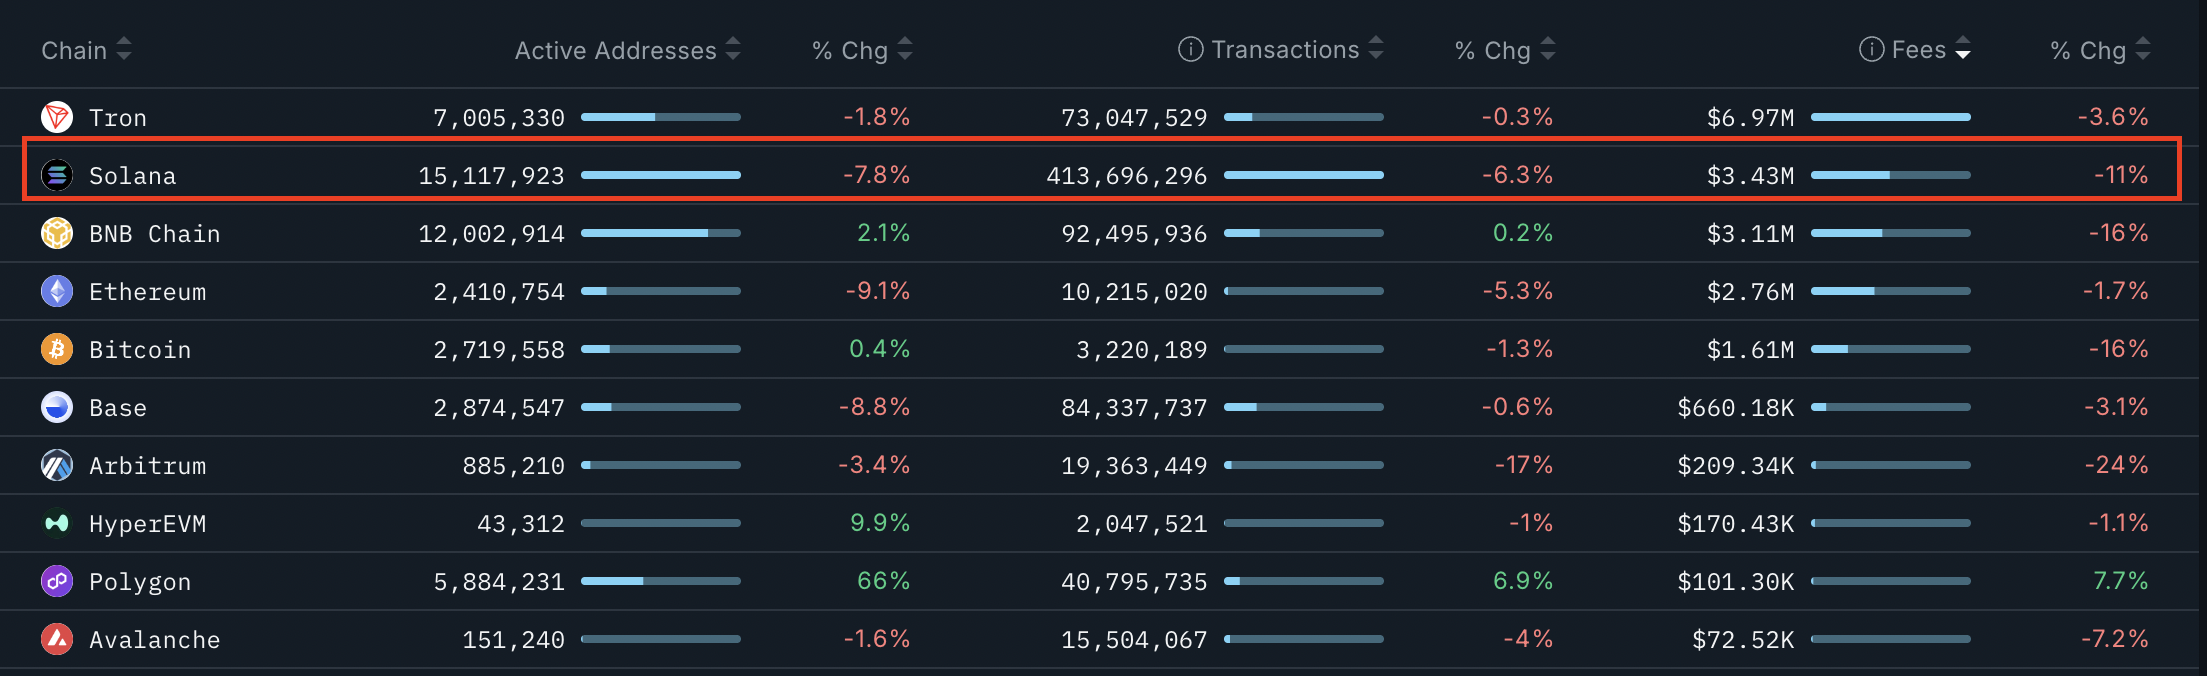
Комиссии цепи Solana составили $3,43 миллиона за последнюю неделю, что на 11% меньше, чем на предыдущей неделе, и на 23% меньше, чем в прошлом месяце.
Аналогичным образом, количество активных адресов (AA) на базовом уровне Solana уменьшилось на 7,8% за тот же период, в то время как количество транзакций уменьшилось на 6,3% за семь дней.
Падение количества активных адресов, количества транзакций и комиссий сети свидетельствует о снижении ончейн-спроса на SOL, добавляя давление сверху.
Объем торгов мемкоинами на Solana резко сокращается
Падение TVL Solana отражает медвежьи настроения на мемкоинах, основанных на Solana, поскольку они повсеместно показывали падение.
Мемкоины на основе Solana показали двузначные убытки в недельном и месячном разрезе, как показано на рисунке ниже. Большинство этих токенов упали на 10–25% от локальных максимумов.
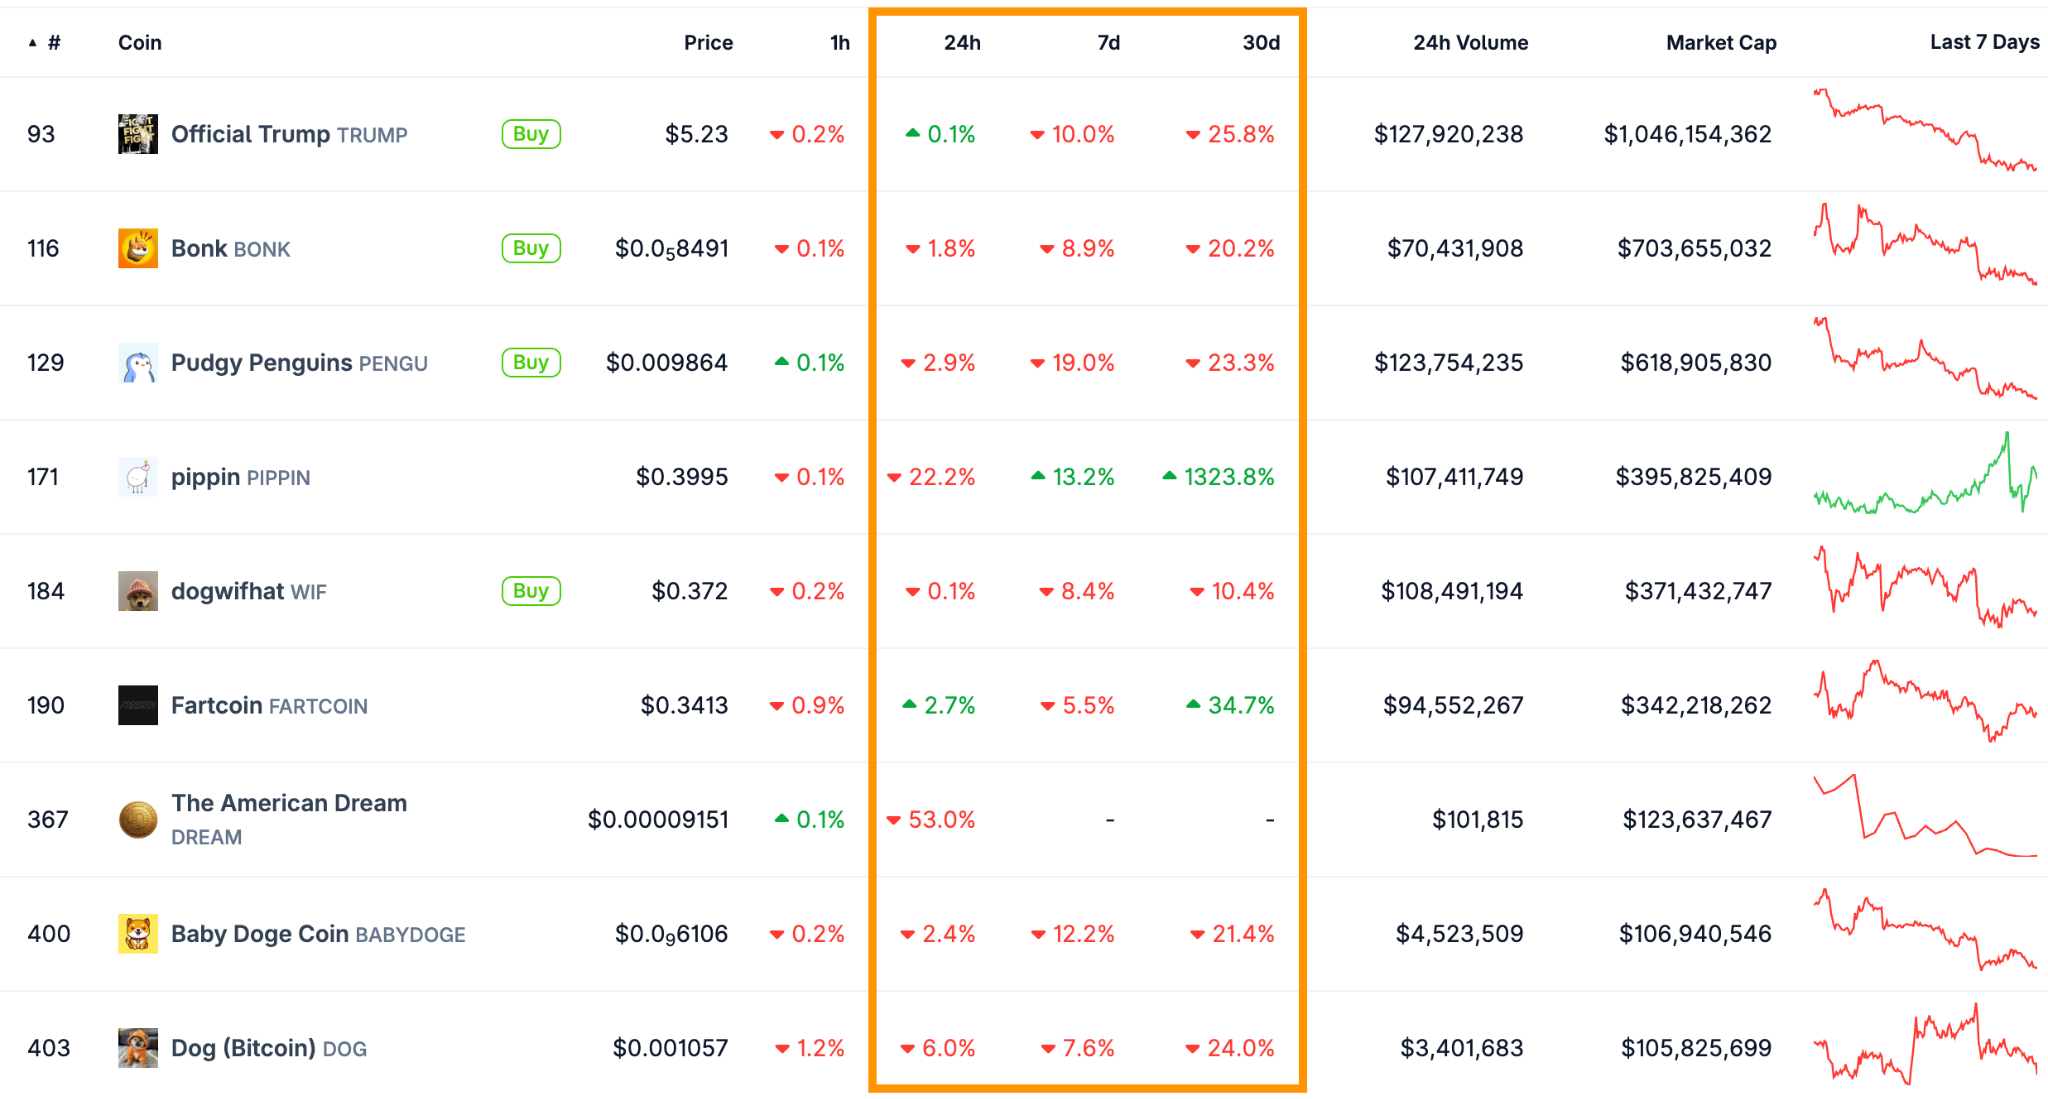
Это падение цен на мемкоины, основанные на Solana, сопровождалось снижением активности DEX в блокчейне первого уровня. Еженедельный объем DEX на Solana, приходящийся на мемкоины, остается низким, сократившись на 95% до $2,7 миллиарда с пика в $56 миллиардов, зарегистрированного в январе, согласно данным Blockworks Research.
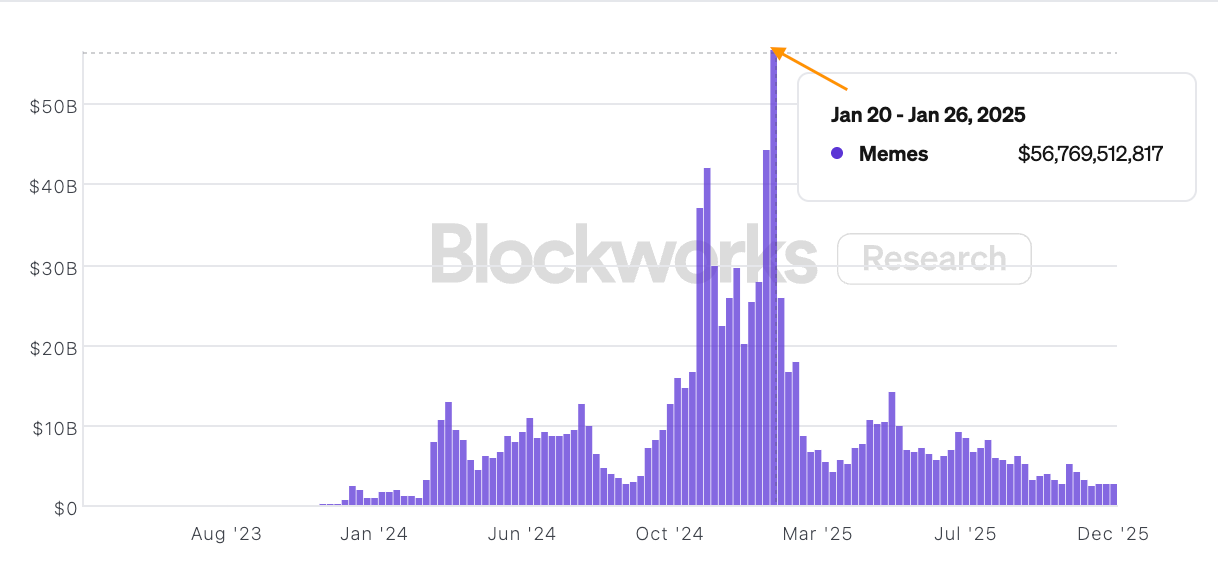
Снижение активности мемкоинов на Solana указывает на низкую активность сети и ослабевающее использование, что негативно сказывается на спросе и цене SOL.
«Медвежий вымпел» SOL целится в $86
Данные Cointelegraph Markets Pro и TradingView указывают на то, что SOL торгуется ниже медвежьего вымпела, что предполагает риск дальнейшего снижения.
Медвежий вымпел — это модель продолжения нисходящего тренда, которая возникает после значительного падения, за которым следует период консолидации в нижней части ценового диапазона.
Пробитие ниже линии поддержки вымпела на уровне $135 на прошлой неделе расчистило путь для следующего этапа снижения альткоина. Измеренная цель медвежьего вымпела находится на уровне $86, что на 32% ниже текущего уровня цены.
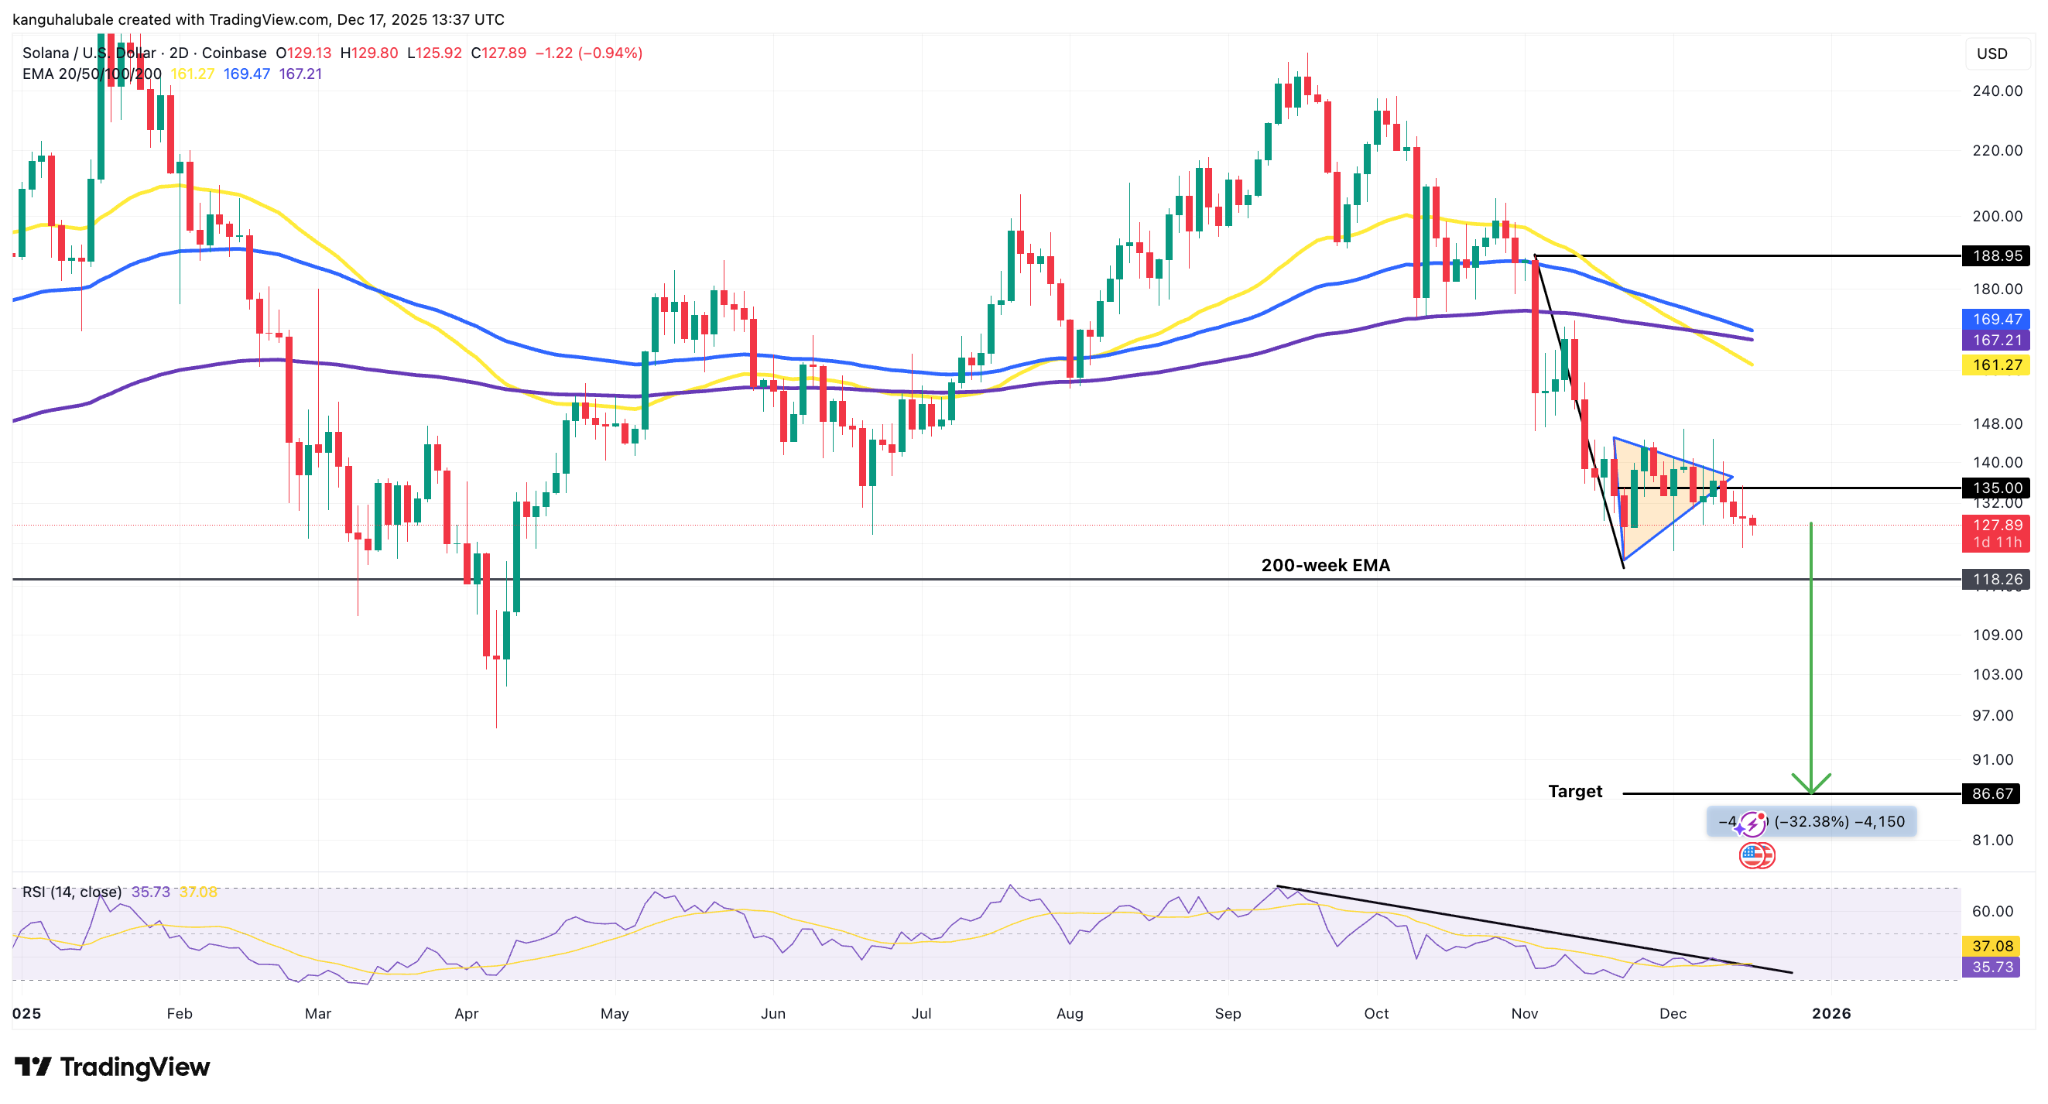
Прежде чем достичь этого уровня, SOL может найти поддержку на 200-недельной EMA на уровне $118, где быки, как ожидается, окажут агрессивную защиту.
«На четырехчасовом графике Solana формируется медвежий вымпел», — заявил псевдонимный трейдер с плечом Grim в публикации X в среду, добавив:
«Я не удивлюсь, если вскоре увижу Solana в диапазоне от $90 до $100.»
Как сообщал Cointelegraph, падение цены SOL ниже линии поддержки симметричного треугольника на уровне $126 сигнализировало бы о том, что медведи контролируют ситуацию, что ведет к более глубокой коррекции до $95.
Эта статья не содержит инвестиционных советов или рекомендаций. Каждое инвестиционное и торговое решение связано с риском, и читатели должны провести собственное исследование при принятии решения. Хотя мы стремимся предоставлять точную и своевременную информацию, Cointelegraph не гарантирует точность, полноту или надежность любой информации в этой статье. Эта статья может содержать прогнозные заявления, которые подвержены рискам и неопределенностям. Cointelegraph не несет ответственности за любые убытки или ущерб, возникшие в результате вашей reliance на эту информацию.