The Bitcoin bear market may have ended earlier. The golden ratio has fallen below the 350-day moving average and touched a key Fibonacci support level, with the current area being an accumulation zone.
Bitcoin has struggled to maintain a sustained correlation with gold, recently moving in sync only during market declines. However, if we observe Bitcoin's price through the lens of gold rather than the US dollar, we can gain a more comprehensive understanding of the current market cycle. By measuring Bitcoin's true purchasing power relative to comparable assets like gold, we can identify potential support levels and gauge when the bear market cycle might end.
Breaking Below Key Support, the Bitcoin Bear Market Officially Begins
When Bitcoin fell below the 350-day moving average around $100,000 and the key six-figure psychological barrier, it effectively entered bear market territory, with the price immediately dropping by about 20%. From a technical analysis perspective, a price drop below the "Golden Ratio Multiplier" moving average is typically seen as a signal of entering a bear market. However, the situation becomes more interesting when priced in gold rather than US dollars.
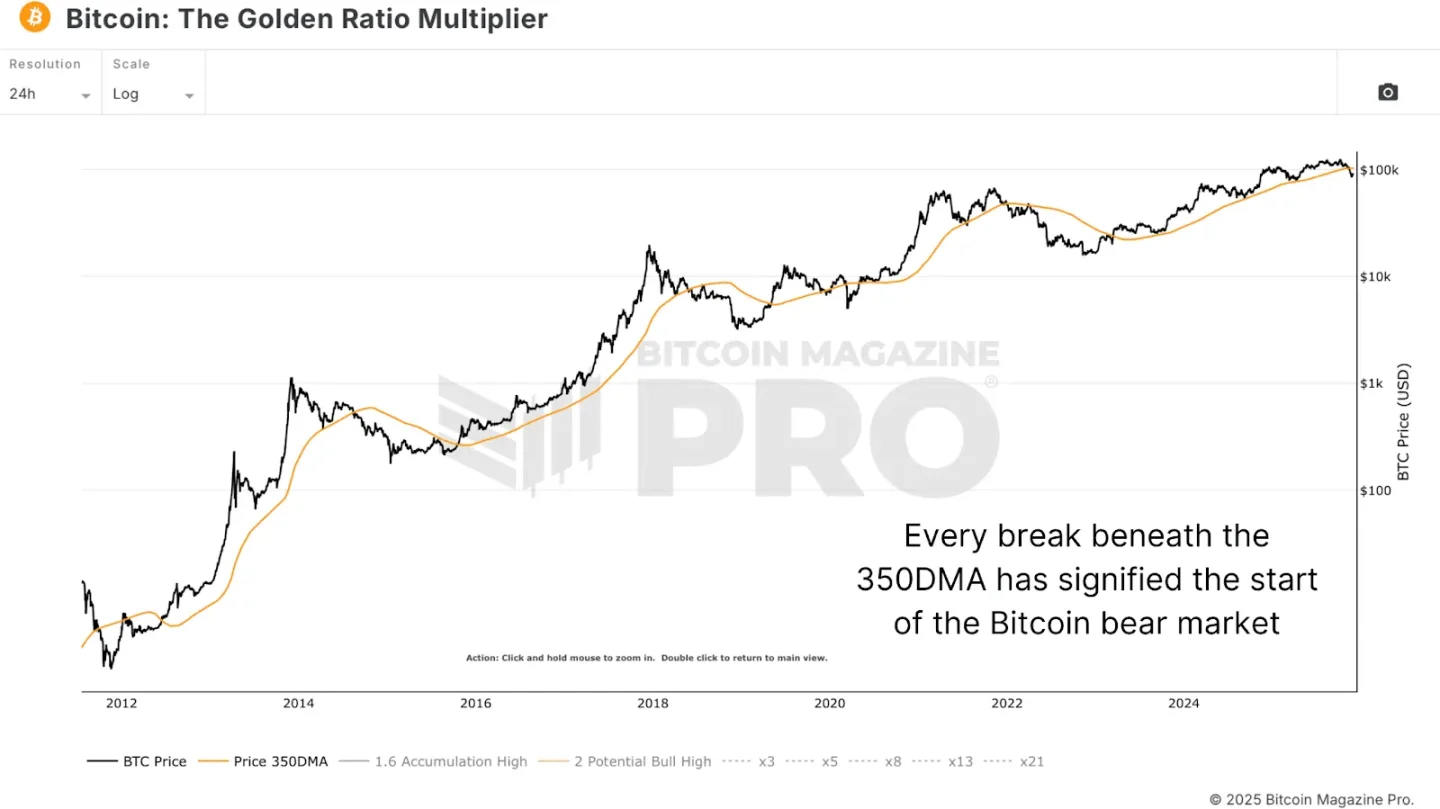
Figure 1: Historically, BTC falling below the 350-day moving average has coincided with the start of bear markets.
Bitcoin's performance against gold is markedly different from its performance against the US dollar. Bitcoin has fallen over 50% since its peak in December 2024, while its peak in US dollar terms occurred in October 2025, well below the previous year's high. This discrepancy suggests that Bitcoin may have entered a bear market much earlier and for a longer duration than most people realize. Looking back at the historical bear market cycles of Bitcoin priced in gold, it appears the current pullback may be approaching a key support area.
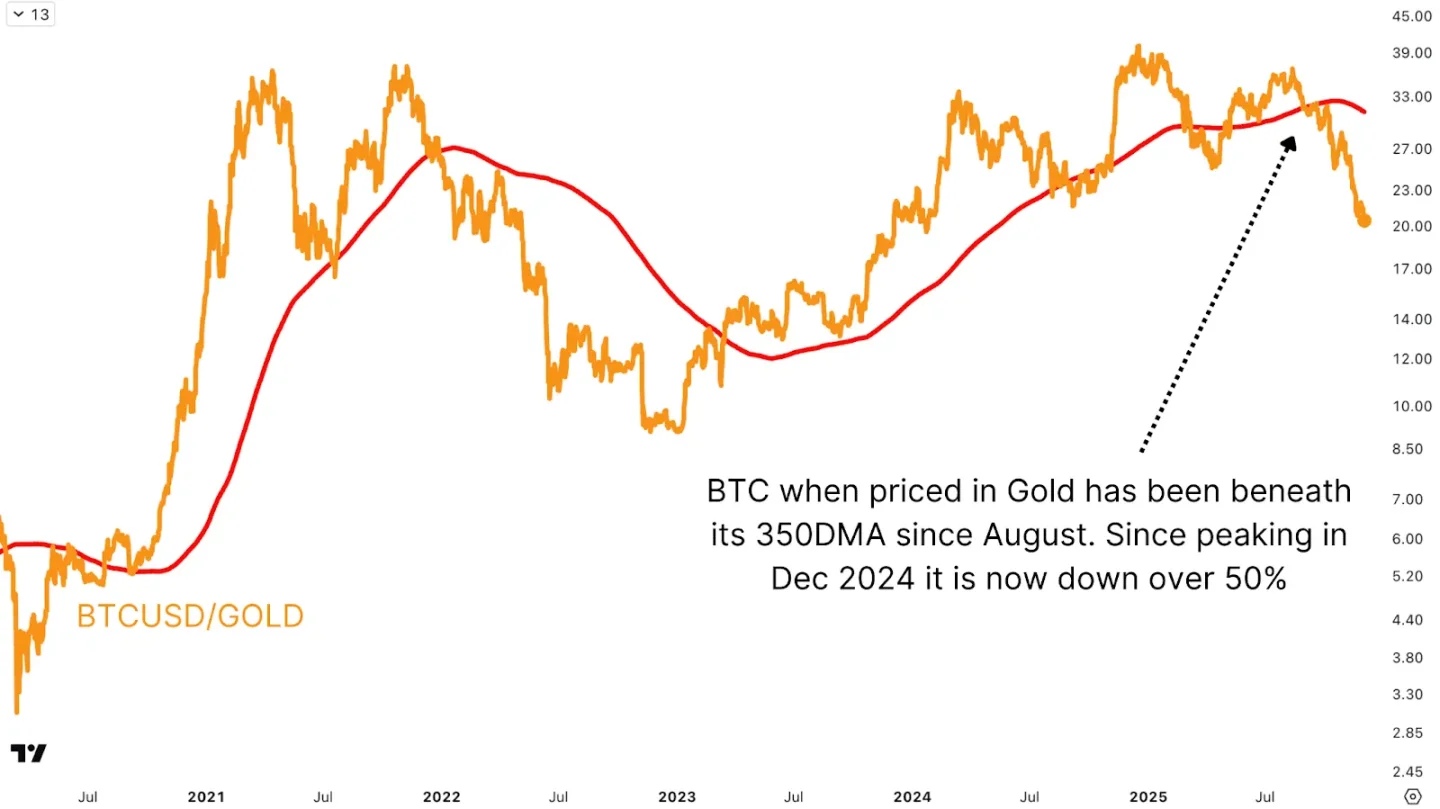
Figure 2: When priced in gold, BTC fell below the 350-day moving average as early as August.
The bottom of the 2015 bear market cycle occurred after a 86% decline over 406 days; the 2017 cycle lasted 364 days with an 84% drop; the previous bear market saw a 76% decline over 399 days. As of this analysis, Bitcoin priced in gold has fallen 51% over 350 days. Although the percentage decline has gradually decreased as Bitcoin's market capitalization has grown and market inflows have increased, this primarily reflects higher institutional participation and a reduction in Bitcoin supply, rather than a fundamental change in cycle patterns.
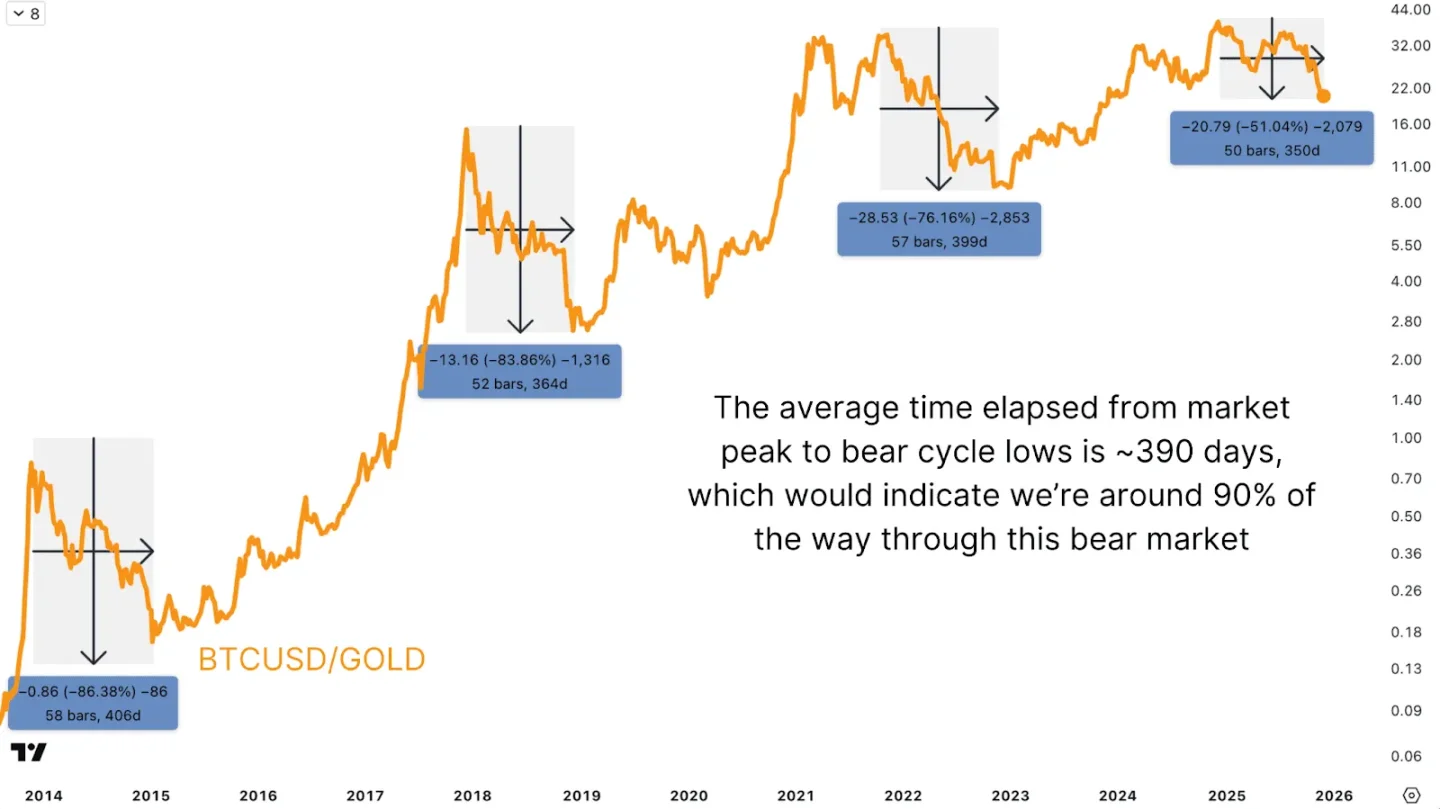
Figure 3: BTC's price movement in gold terms suggests this bear market may be 90% complete.
Multi-Cycle Indicators Suggest Bitcoin Bear Market Bottom is Near
Beyond observing the decline and its duration, Fibonacci retracement levels spanning multiple cycles can provide more precise judgment. Analyzing from the historical cycle bottoms to tops using the Fibonacci tool reveals obvious level coincidences.
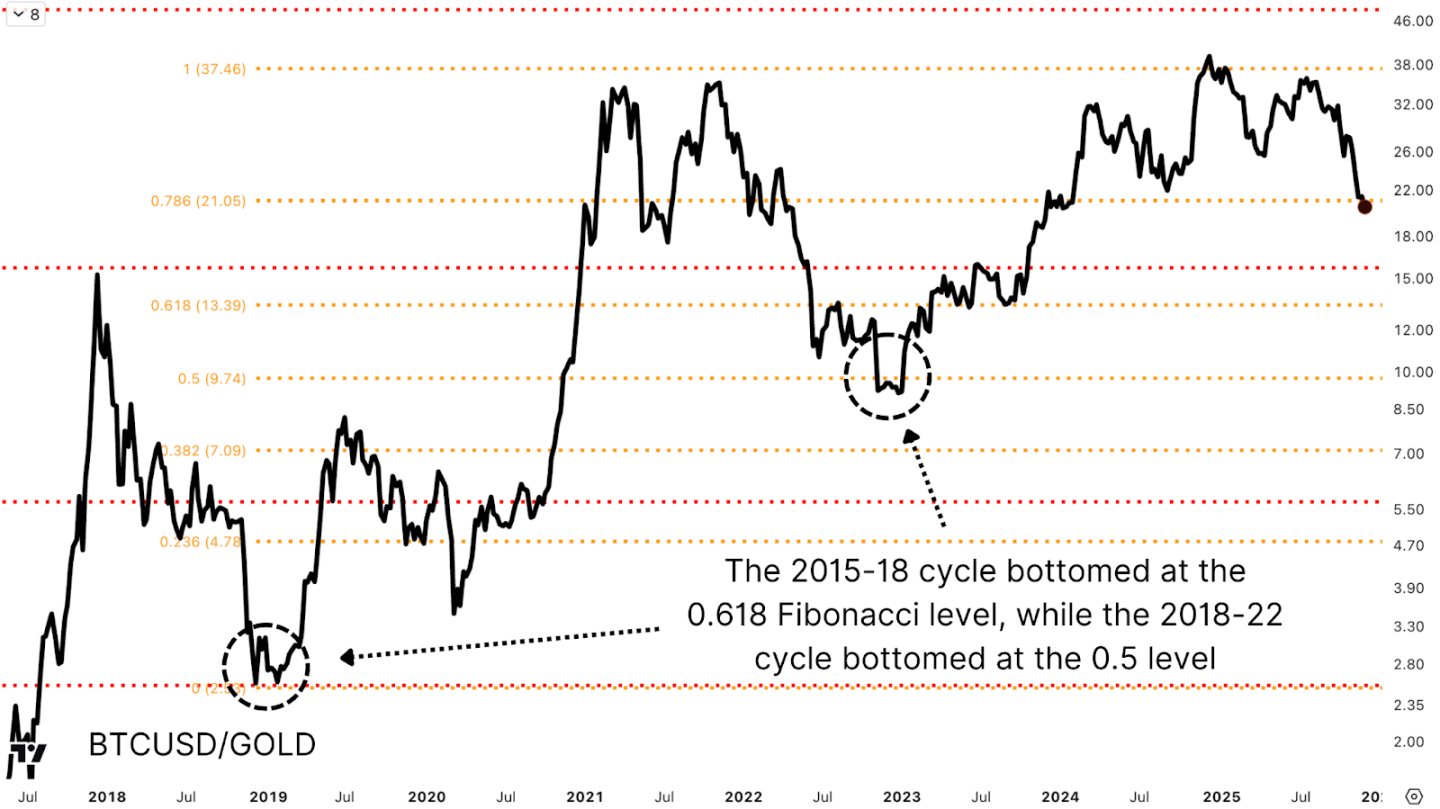
Figure 4: The bottoms of previous bear market cycles have aligned with key Fibonacci retracement levels.
In the 2015-2018 cycle, the bear market bottom appeared at the 0.618 Fibonacci level, corresponding to approximately 2.56 ounces of gold per bitcoin; the bottom of the 2018-2022 cycle precisely landed at the 0.5 level, corresponding to about 9.74 ounces of gold per bitcoin. The latter later became a significant resistance-turned-support level in the subsequent bull market.
Converting the Golden Ratio into US Dollar Price Targets
From the low of the last bear market to the high of this bull market, the 0.618 Fibonacci level corresponds to approximately 22.81 ounces of gold per bitcoin, and the 0.5 level corresponds to 19.07 ounces. The current price is right between these two, potentially forming an ideal accumulation zone from a purchasing power perspective.
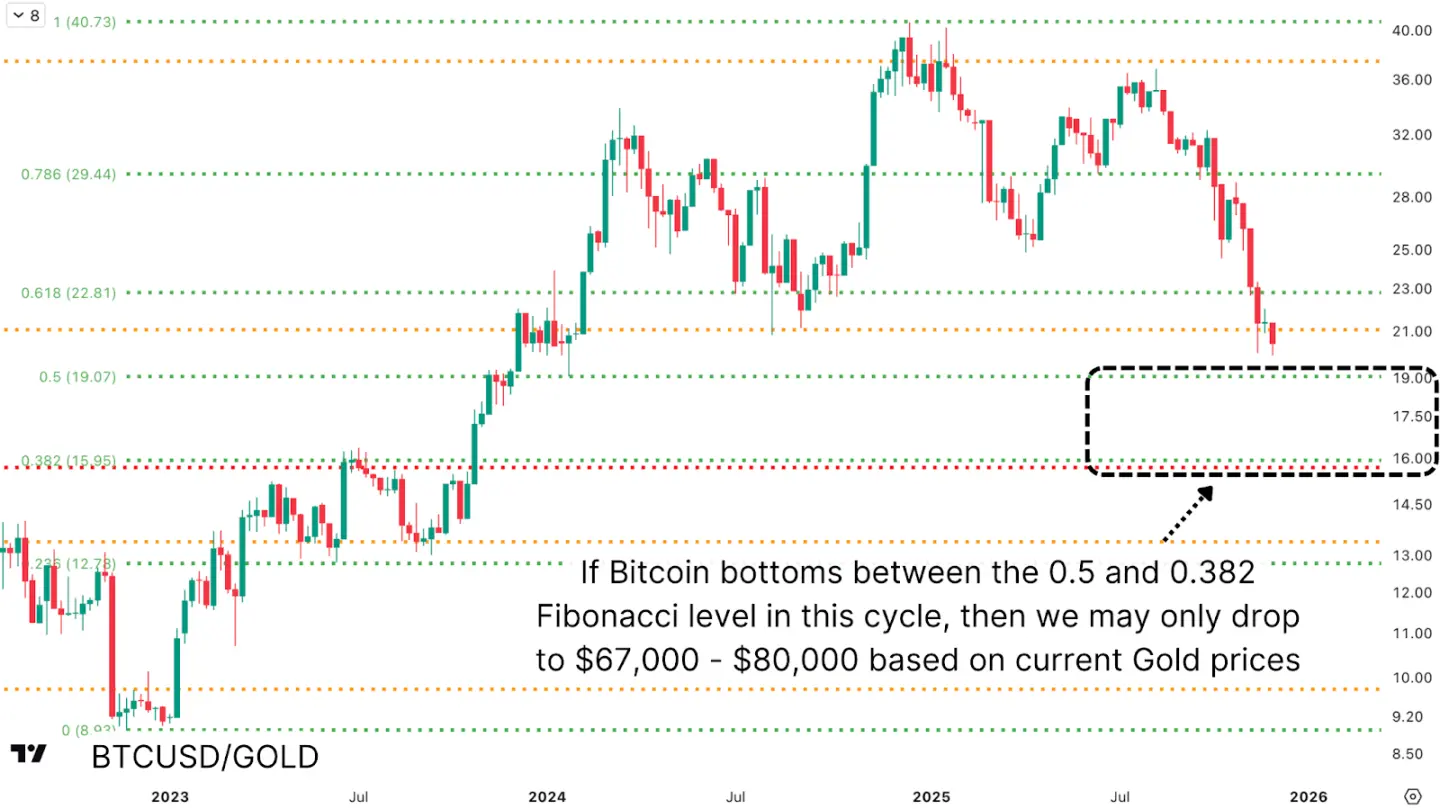
Figure 5: Predicting BTC's low against gold via Fibonacci levels and converting it to a US dollar price can infer Bitcoin's potential bottom area.
Fibonacci levels from different cycles form multiple coincidences: the 0.786 level of the current cycle (approx. 21.05 ounces of gold) corresponds to about $89,160 for Bitcoin; the 0.618 level of the previous cycle again points to the vicinity of $80,000. If the price falls further, the next key technical target is around $67,000, corresponding to the 0.382 Fibonacci level (approx. 15.95 ounces of gold per bitcoin).
Conclusion: The Bitcoin Bear Market May Be 90% Complete
Measured against assets like gold, Bitcoin's purchasing power has been declining continuously since December 2024, and the bear market has lasted far longer than analyses based solely on the US dollar suggest. Cross-cycle Fibonacci retracement levels, converted to US dollars, point to strong support existing in the $67,000-$80,000 range. Although the analysis is theoretical and actual price movements may not perfectly align, the convergence of data across multiple time dimensions and valuation frameworks suggests: the end of the bear market may arrive sooner than market expectations.


