Криптоаналитик, публикующий технический анализ для своей аудитории в X, представил недельный график Ethereum с уменьшенным масштабом, который интерпретирует текущую слабость цены как финальную стадию многолетнего цикла накопления. На данный момент цена Ethereum торгуется около $2100, что на 57% ниже своего пика. Таким образом, технический анализ предполагает, что криптовалюта находится в зоне накопления, которая готовит движение цены до $20 000.
Схема накопления, разыгрывающаяся на недельном графике ETH
Недельный график ETH/USDT, опубликованный Crypto Patel в X, иллюстрирует структурированную ценовую модель, которая развивается с 2024 года. На графике идентифицирован Пик продаж (SC) в начале 2024 года, за которым последовал Автоматический ралли (AR) к сопротивлению в течение двух месяцев, а затем Вторичное тестирование (ST) Пика продаж в середине 2024 года.
Все это терминология схемы Вайкоффа, и это создало последовательность ценовых событий, которые установили границы текущего торгового диапазона. Верхняя граница этого диапазона обозначена горизонтальной линией сопротивления около $4700, в то время как Поддержка 1, на уровне $1549, представляет собой дно.
Также есть два заметных нижних хвоста, обозначенных как Пружина 1 и Пружина 2, оба расположены вокруг Поддержки Пружины 1, что произошло в середине 2025 года, когда цена Ethereum ненадолго упала ниже Поддержки 1, прежде чем восстановиться и вернуться к новому историческому максимуму чуть выше линии сопротивления.
С тех пор, однако, цена Ethereum находится на нисходящем пути, и текущее ценовое действие обозначено как Пружина 2, которая находится чуть выше Поддержки 1. Если Поддержка 1 будет пробита, следующая целевая зона покупок - это Поддержка 2 на уровне $1065. Именно в рамках предполагаемого падения к Поддержке 2 Crypto Patel идентифицирует диапазон от $1800 до $1400 как лучшую зону для покупок и накопления.
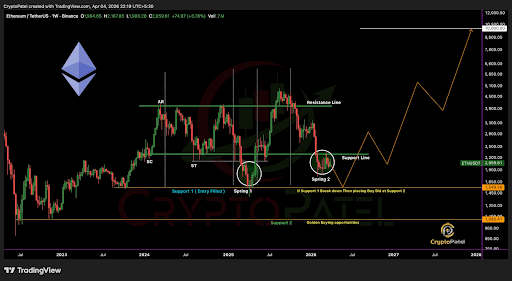
График цены Ethereum. Источник: @CryptoPatel On X
Движение цены к $20 000
Карта накопления ETH прогнозирует рост цены до $20 000 после того, как Ethereum выйдет из зоны накопления. Однако этот рост зависит от преодоления сильного уровня сопротивления / пробоя вокруг $4700.
Прогнозируемые цели Crypto Patel ($10 000, $15 000 и $20 000) нанесены на график в виде поэтапной восходящей траектории, простирающейся до конца 2027 и 2028 годов. Прогнозируемый рост показывает движение от текущей зоны накопления к $4700, откат ниже $4000 для консолидации пробоя, а затем параболическое расширение до новых исторических максимумов на уровне $10 000 с последующим ростом до $15 000 и $20 000.
Целевая цена в $20 000 для Ethereum будет означать примерно 10-кратную доходность от текущей цены, которая торгуется на уровне $2135, показав рост на 4,8% за последние 24 часа.