Ethereum все больше борется за сохранение убедительного бычьего нарратива, поскольку рыночные настроения продолжают ухудшаться. Ценовое действие остается хрупким, и все больше аналитиков открыто обсуждают возможность того, что Ethereum переходит в фазу более широкого медвежьего рынка.
Повторные неудачи в поддержании восходящего импульса ослабили уверенность, в то время как аппетит к риску на рынке криптовалют продолжает иссякать. В условиях сохраняющейся волатильности и оборонительного вращения капитала ETH оказывается в центре дебатов между структурной слабостью цены и устойчивостью под поверхностью.
Согласно недавнему отчету CryptoQuant, текущее состояние Ethereum отражает заметный сдвиг в поведении предложения на биржах. Коэффициент биржевого предложения (Exchange Supply Ratio, ESR), который отслеживает долю ETH, хранящегося на централизованных торговых платформах, неуклонно снижается на всех крупных биржах.
Эта тенденция сигнализирует о том, что меньшая доля циркулирующего предложения доступна для немедленной продажи, что является критическим фактором при оценке динамики спроса и предложения.
Исторически сложилось, что снижение биржевых балансов свидетельствует о снижении давления продаж, поскольку инвесторы перемещают активы в самохранилища или на долгосрочное хранение, а не готовятся к ликвидации. В текущей обстановке это структурное изменение добавляет нюансов медвежьему нарративу.
Снижение биржевого предложения сигнализирует о структурном сдвиге
В отчете подчеркивается выраженное снижение Коэффициента биржевого предложения (ESR) Ethereum, что укрепляет взгляд на то, что динамика предложения тихо меняется под поверхностью. На всех платформах ESR упал примерно до 0,137, что является одним из самых низких значений с 2016 года.
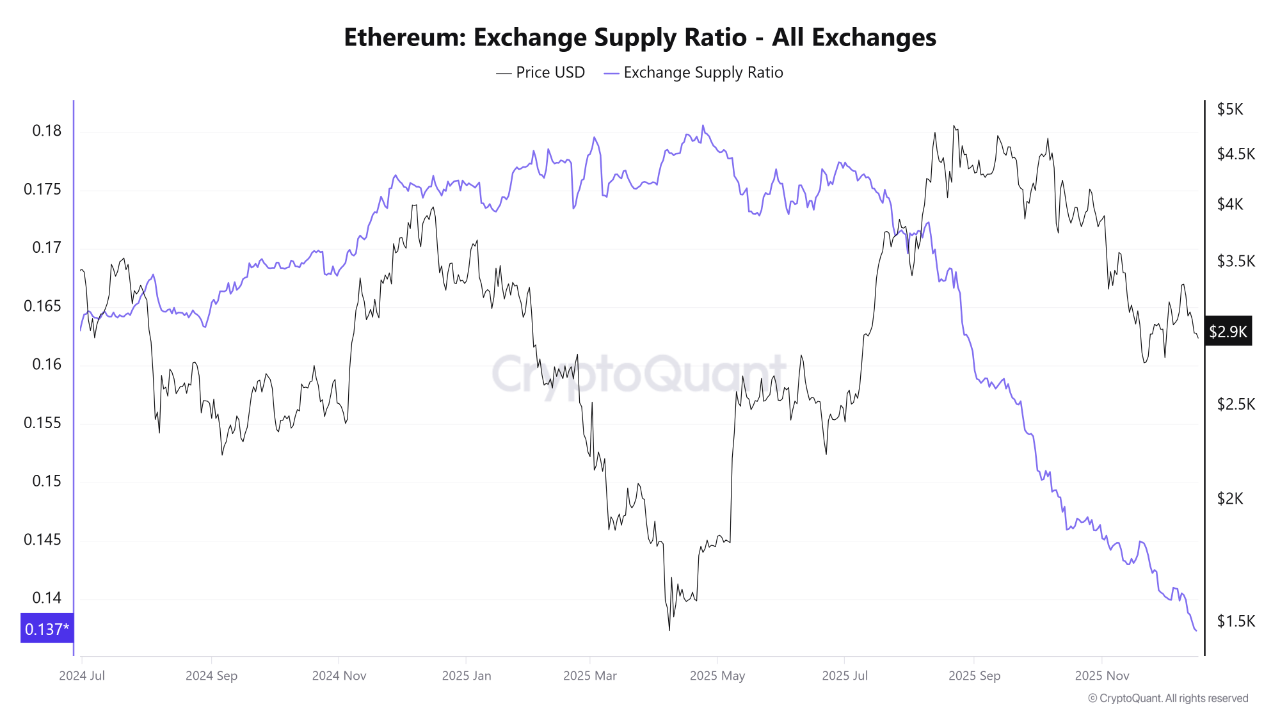
Это устойчивое падение отражает стабильный отток ETH с бирж во внешние кошельки, сигнализируя о снижении склонности к немедленной продаже и растущем предпочтении долгосрочного хранения. Исторически подобные модели появлялись во время фаз повторного накопления или в переходные периоды, следующие за продолжительной волатильностью, часто предшествуя более стабильному ценовому поведению.
Тенденция еще более очевидна на Binance, где ESR снизился примерно до 0,0325. Как биржа с самой глубокой ликвидностью, балансы Binance служат ключевым барометром условий краткосрочного предложения. Продолжающийся вывод ETH с ее кошельков свидетельствует о значительном сокращении предложения для спотовой продажи, указывая на повышенную осторожность трейдеров, а не на агрессивное распределение.
В то же время Ethereum торгуется около $2960, на среднем уровне, который отражает временное равновесие между покупателями и продавцами. Комбинация падающего биржевого предложения и относительно стабильных цен указывает на то, что рынок не находится под сильным давлением продаж.
Вместо этого, похоже, он вступает в фазу поглощения ликвидности и стратегического перепозиционирования, где участники сокращают exposure к краткосрочным сделкам, готовясь к потенциальному сдвигу в структуре рынка.
Цена Ethereum борется ниже ключевых уровней тренда
Дневной график ETH highlights рынок, который остается структурно хрупким, несмотря на краткосрочную стабилизацию. После неудачной попытки удержаться выше региона $3200–$3300 Ethereum продолжил формировать более низкие максимумы, подтверждая потерю бычьего импульса с конца октября. В настоящее время цена торгуется в районе $2850–$2900, зоны, которая acted как карман краткосрочного спроса, но ей не хватает сильного продолжения со стороны покупателей.
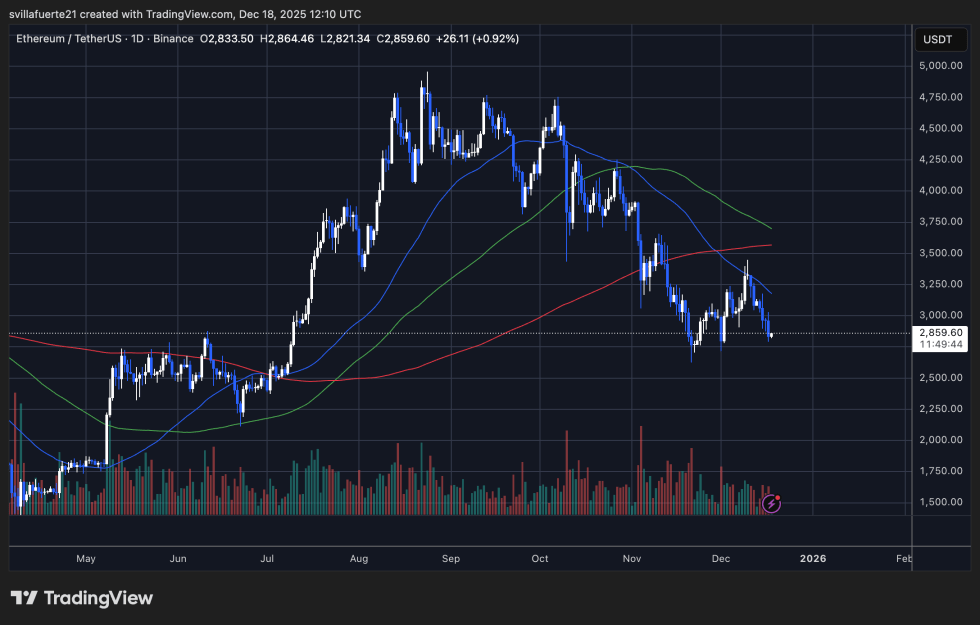
С точки зрения тренда, ETH остается ниже своих краткосрочных и среднесрочных скользящих средних. 50-дневная скользящая средняя развернулась вниз и теперь выступает в качестве динамического сопротивления, в то время как 100-дневная скользящая средняя также снижается.
200-дневная скользящая средняя находится выше, укрепляя идею о том, что Ethereum перешел от трендового рынка к корректирующей или фазе распределения. До тех пор, пока цена остается ограниченной ниже этих уровней, ралли, вероятно, будут продаваться, а не продолжаться.
Динамика объемов укрепляет этот взгляд. Недавние отскоки происходили на относительно слабых объемах по сравнению с активными продажами, наблюдавшимися во время предыдущих прорывов, что suggests реактивное закрытие коротких позиций, а не новый спрос.
Структурно ETH необходимо вернуть и удержать диапазон $3100–$3200, чтобы восстановить бычий сценарий. Неспособность сделать это сохраняет риск, склоняющийся к продолжению консолидации или более глубокой корректирующей волне в сторону более низких уровней поддержки.
Изображение от ChatGPT, график от TradingView.com