Активность в сети Ethereum резко возросла, приблизившись к историческим максимумам: более 788 тысяч ежедневно активных адресов взаимодействуют в сети.

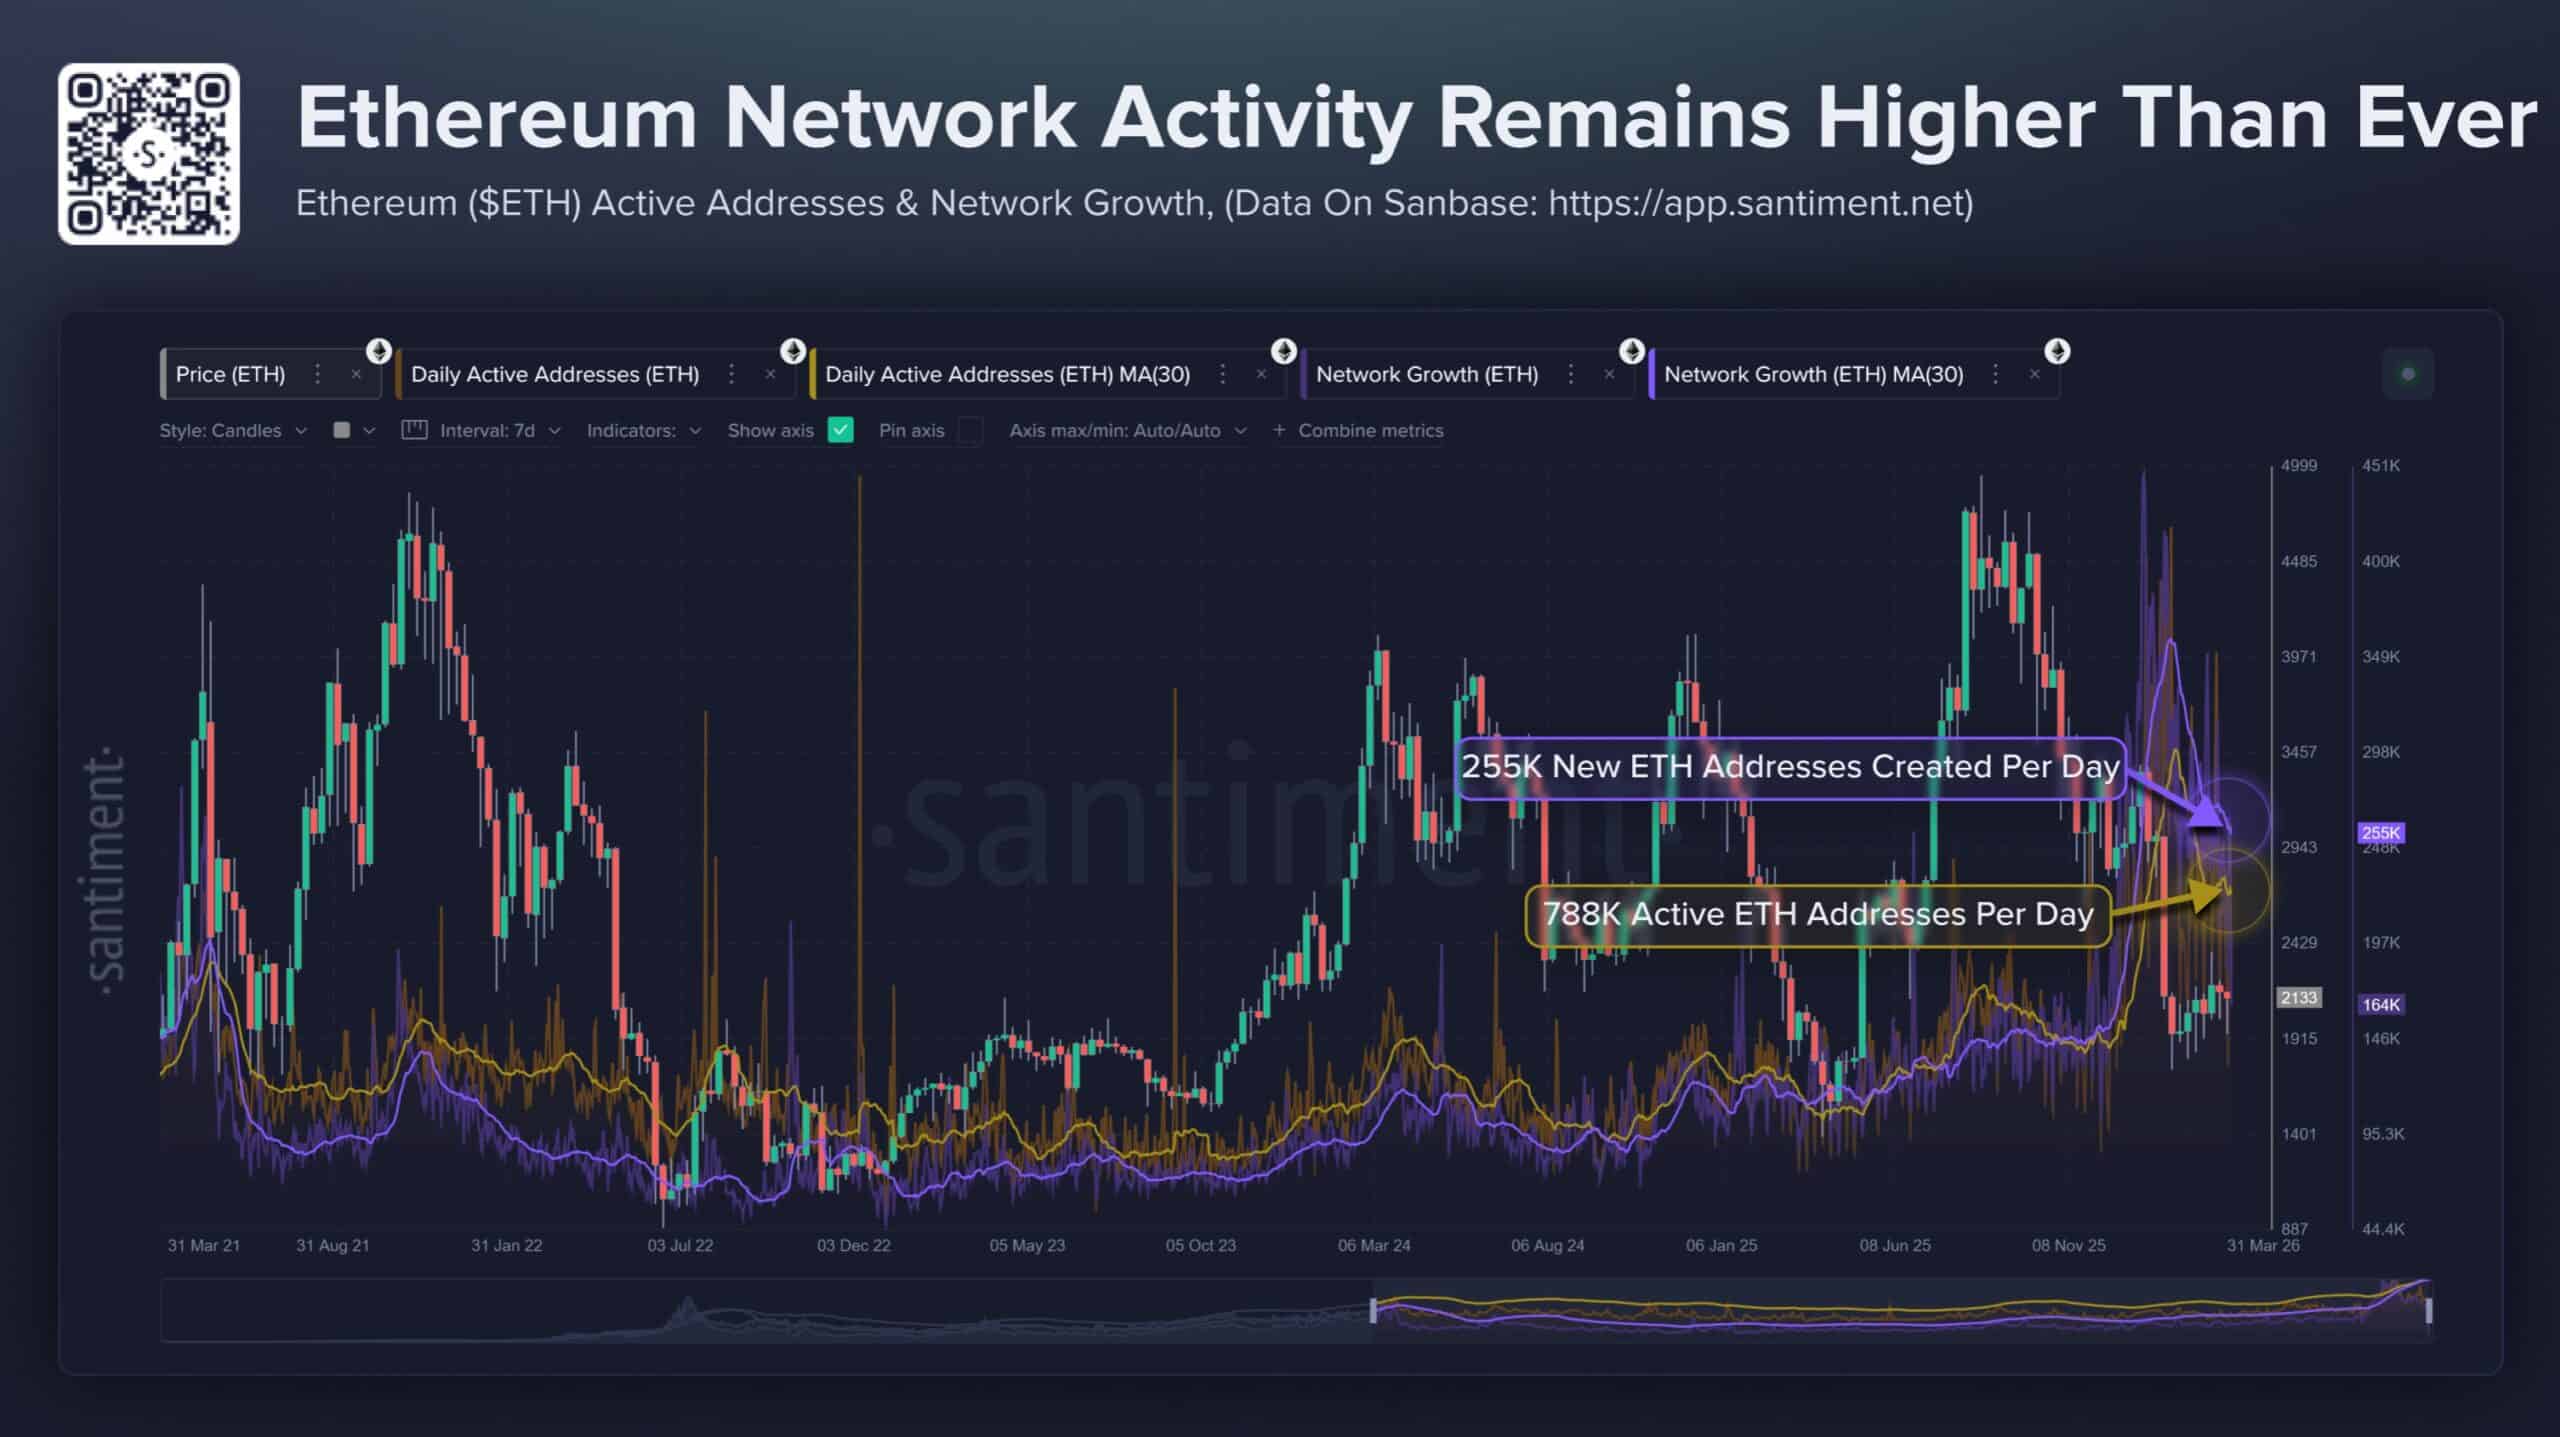
Кроме того, ежедневно создается более 255 тысяч новых адресов, что отражает устойчивый приток пользователей.
Поскольку все больше адресов ежедневно взаимодействуют с сетью, базовый спрос, по-видимому, усиливается.
Тем не менее, поведение цены suggests that this demand has not fully translated into visible buying pressure.
Этот разрыв raises a critical question about how much of this activity reflects organic growth versus structural positioning, оставляя рынок в состоянии, где участие растет, но направление цены остается неопределенным.
Диапазон цены Ethereum удерживается, сопротивление ограничивает рост
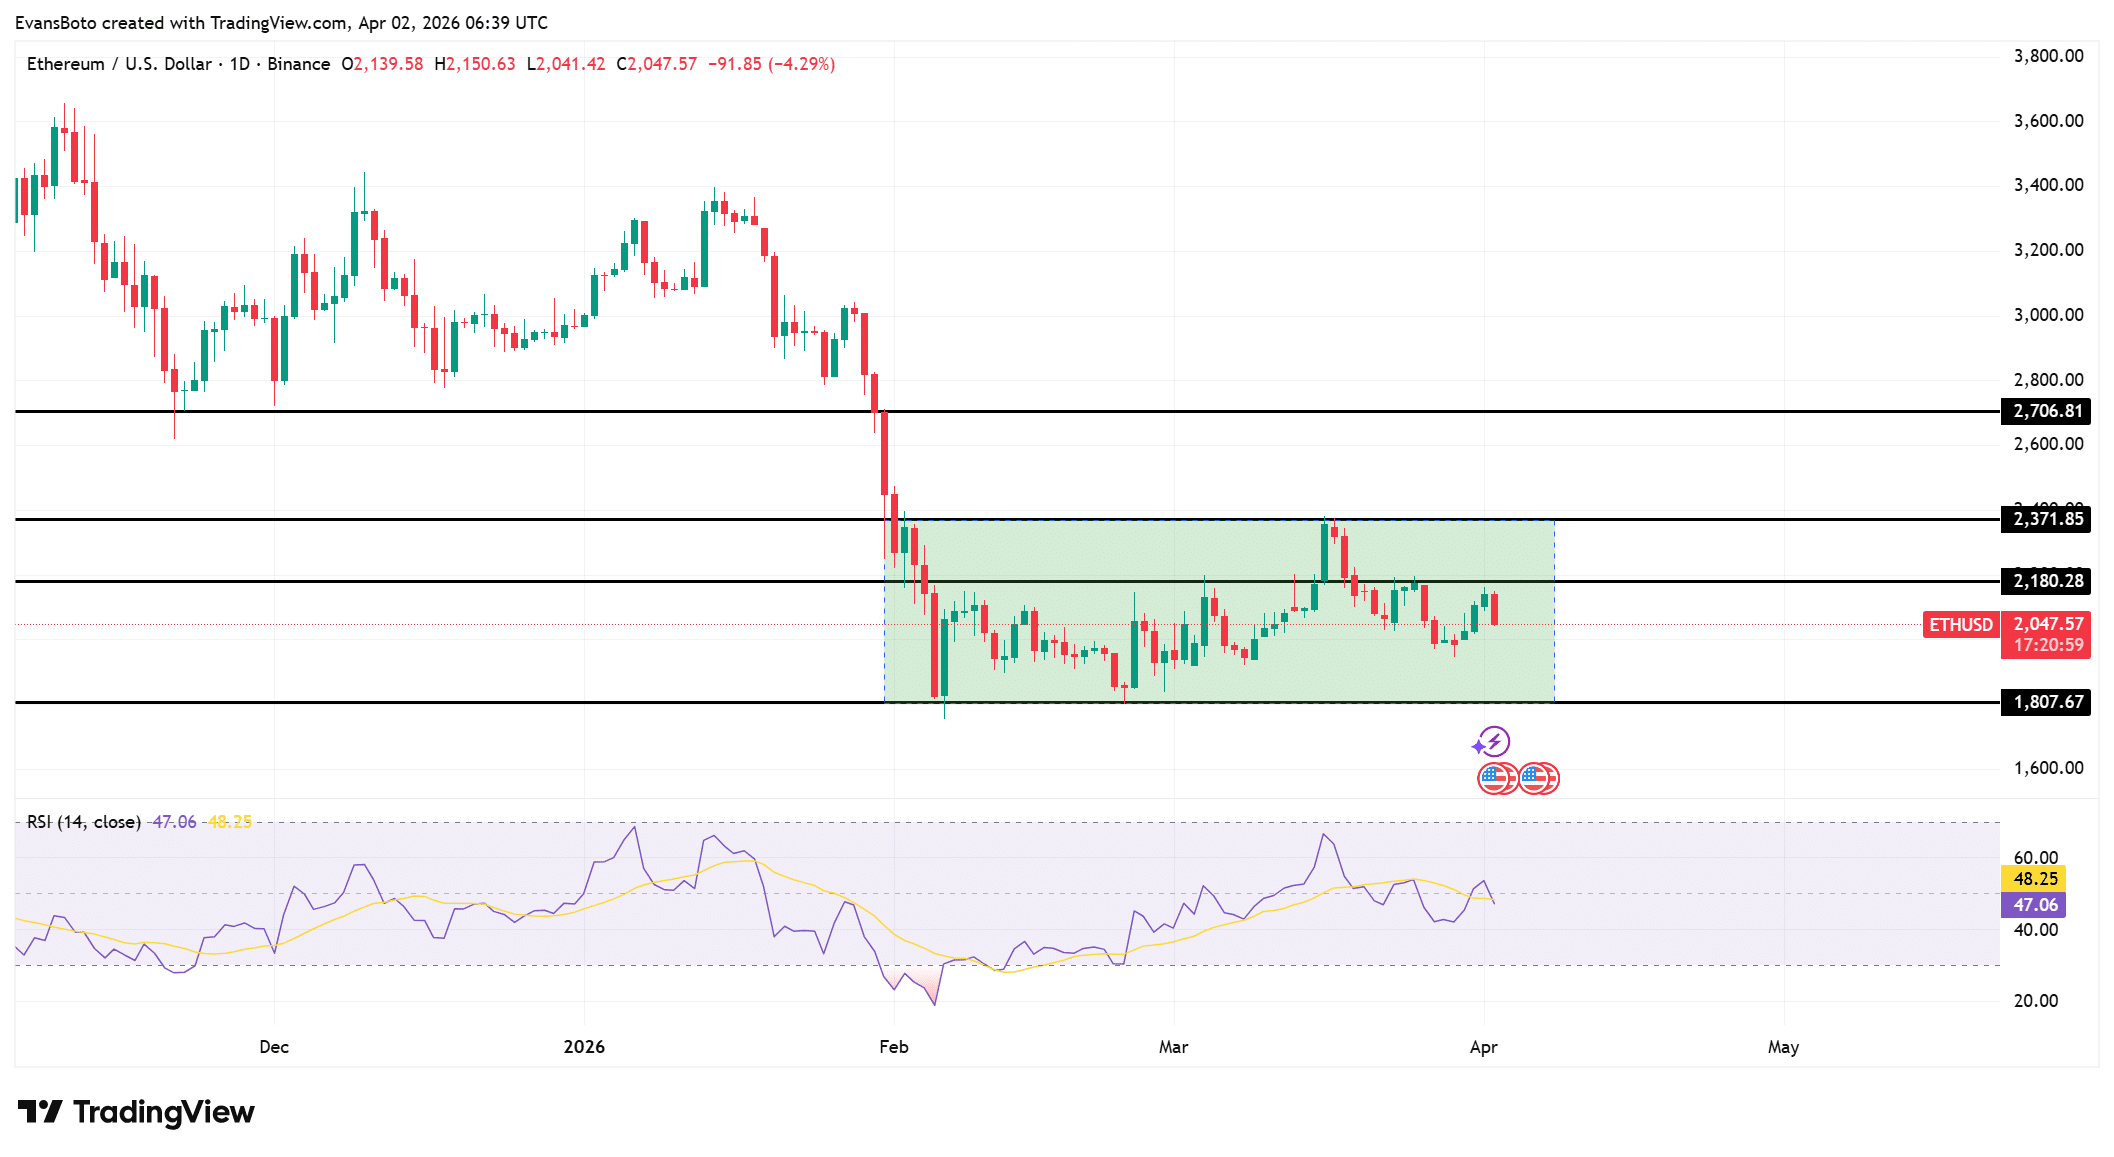
Несмотря на сильный рост в сети, Ethereum [ETH] торговался в определенном диапазоне между поддержкой на уровне $1,807 и сопротивлением на уровне $2,371.
Цена неоднократно тестировала сопротивление на уровне $2,371, но не смогла закрепить прорыв. Это удерживало структуру сжатой и ограничивало восходящее расширение.
RSI стабилизировался near 47.06, отражая нейтральный momentum без явного directional bias.
Хотя RSI recovered from oversold levels, он не смог подняться выше 60. Это indicated, что bullish strength оставалась limited.
Между тем, сопротивление near $2,180 продолжало отвергать upward moves.
Каждое rejection поддерживало паттерн lower highs within the range. Этот паттерн limited bullish continuation.
Однако repeated defenses of $1,807 showed buyers remained active at lower levels. Этот баланс reflected ongoing indecision between accumulation and distribution.

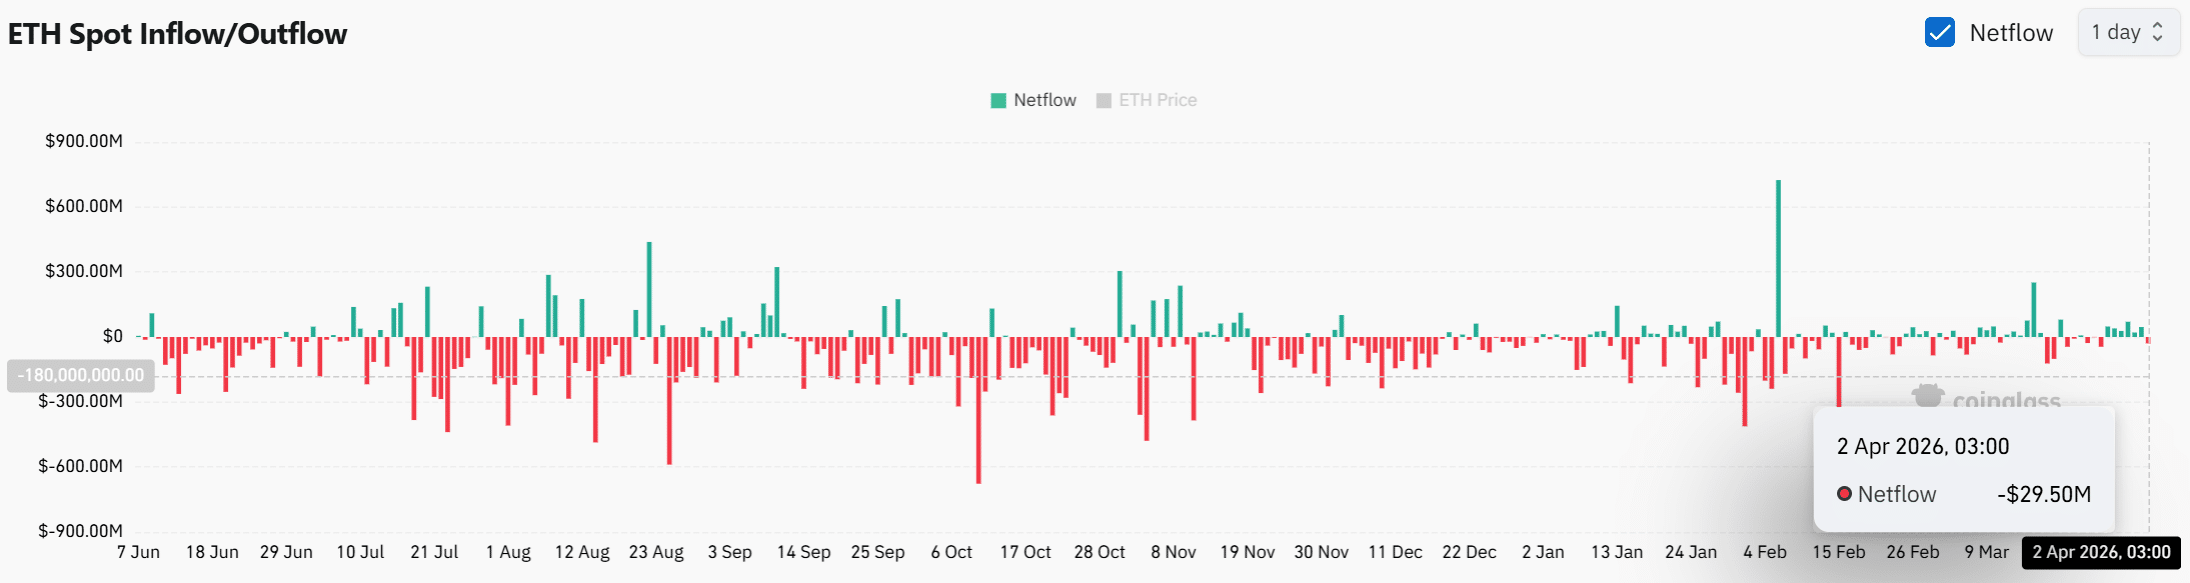
Отток средств сохраняется несмотря на фазу консолидации
Пока цена продолжает сжиматься, Spot Netflows оставались negative, с recent data showing a $29.50M outflow.
Эта тенденция indicates that ETH continues leaving exchanges, что reduces immediately available supply for selling.
Такой persistent outflows typically reflect accumulation behavior, так как инвесторы перемещают активы в private wallets.
Однако, despite this supply tightening, price has not responded with upward expansion.
Это suggests that although selling pressure may be decreasing, demand has not yet intensified enough to absorb resistance levels.
Продолжающаяся тенденция оттока укрепляет базовую структуру, yet price remains locked within the range as the market absorbs this shift gradually.

Кредитное плечо Ethereum снижается, поскольку шорты gain control
Помимо спотовой активности, данные по деривативам revealed a shift in positioning, так как Open Interest [OI] dropped by 8.59% to $28.18B.
Это decline showed that traders have reduced exposure, signaling lower participation in leveraged positions.
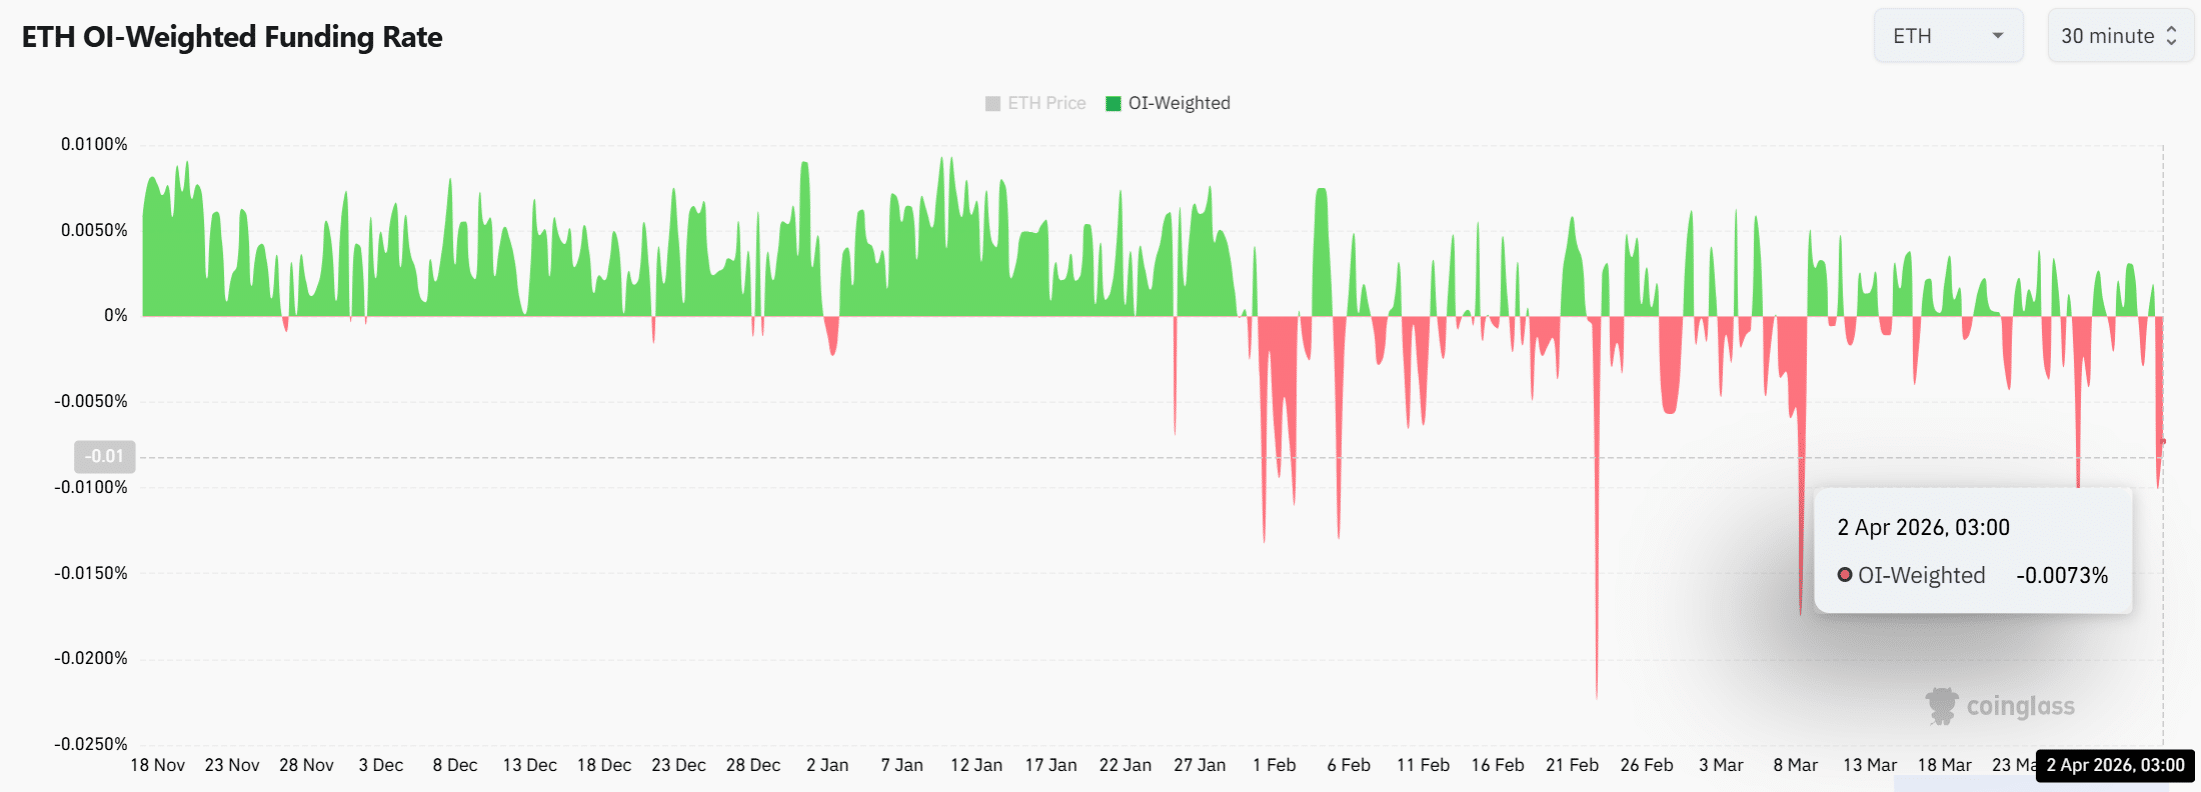
Кроме того, OI-Weighted Funding Rate turned negative to -0.0073%, indicating that short positions now dominate.
Этот shift reflects growing bearish sentiment на рынке деривативов, где трейдеры increasingly position for downside или continued consolidation.
Однако, reduced leverage can also lower volatility, что reinforces the current range-bound behavior.
Таким образом, as traders step back and shorts gain control, цена остается constrained, lacking the aggressive positioning needed to drive a breakout.

Может ли активность привести к прорыву?
Рост сети Ethereum продолжает укреплять его основу, yet цена остается constrained within a defined range.
Reduced leverage и dominant short positioning limit upward expansion, despite ongoing accumulation signals.
Эта структура suggests that while underlying demand continues building, рынок все еще requires stronger conviction to translate adoption into a sustained breakout.
Итоговый обзор
- Активность в сети Ethereum [ETH] резко возросла: более 788 тысяч ежедневно активных адресов и 255 тысяч новых адресов создается ежедневно.
- Растущее участие signaled growing underlying demand, though цена failed to reflect this strength.