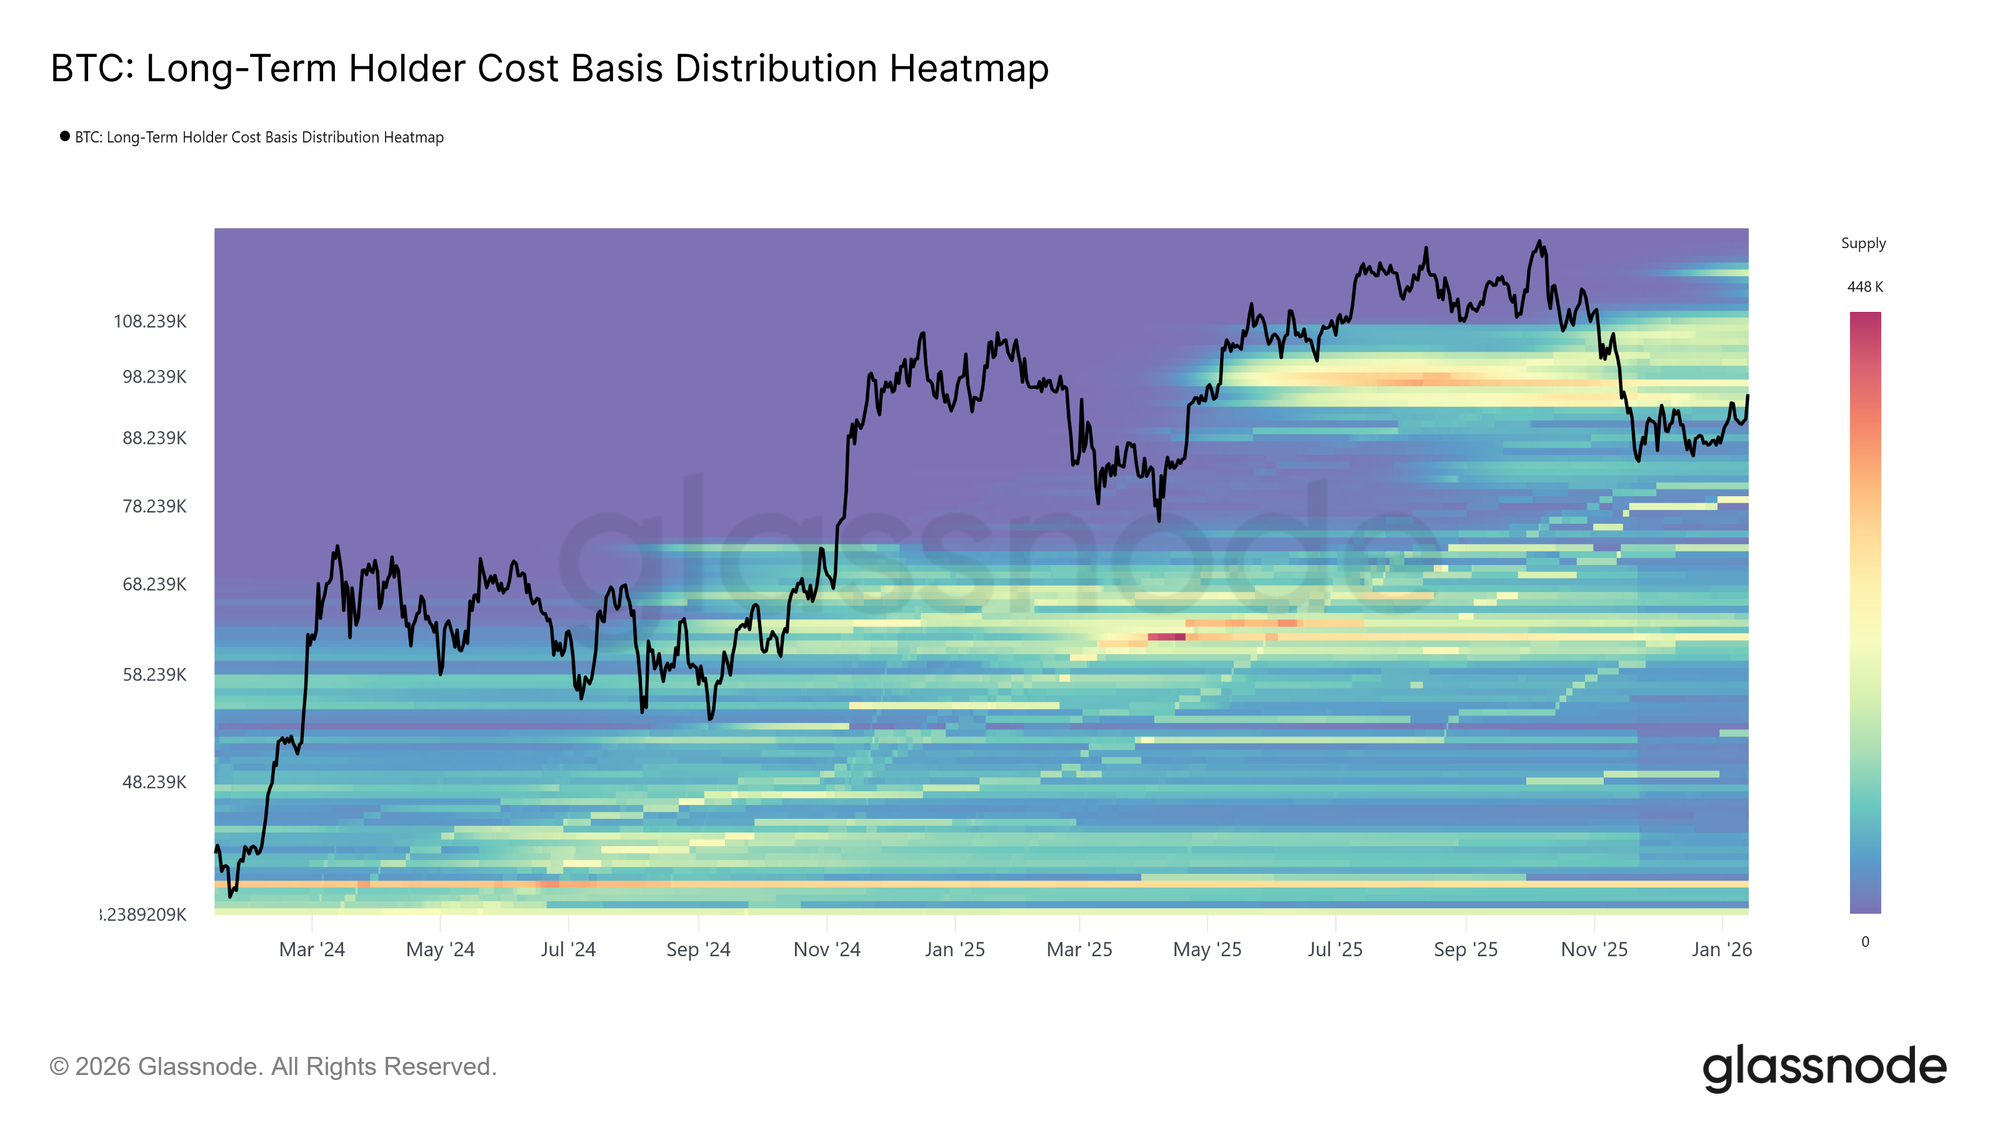
Биткоин вошел в новый год с конструктивным импульсом, показав два последовательных более высоких максимума и подняв цену до $95,6 тыс. Однако это продвижение в начале года привело цену прямо в исторически значимую зону предложения. Текущий рыночный уровень находится внутри плотного кластера предложения долгосрочных держателей, накопленного между апрелем и июлем 2025 года, периода, отмеченного устойчивым распределением около максимумов цикла.
Как показано на тепловой карте распределения себестоимости долгосрочных держателей, отскоки с ноября 2025 года неоднократно останавливались на нижней границе этого кластера, простирающейся приблизительно от $93 тыс. до $110 тыс. Каждая попытка роста сталкивалась с возобновлением давления со стороны продавцов, препятствуя устойчивому структурному восстановлению цены.
Этот регион последовательно действовал как барьер перехода, отделяющий коррекционные фазы от устойчивых бычьих режимов. Поскольку цена снова приближается к этому нависающему предложению, рынок теперь сталкивается с привычным испытанием на устойчивость, где поглощение распределения долгосрочных держателей остается необходимым условием для любого более широкого разворота тренда.
Уверенность на уровне себестоимости
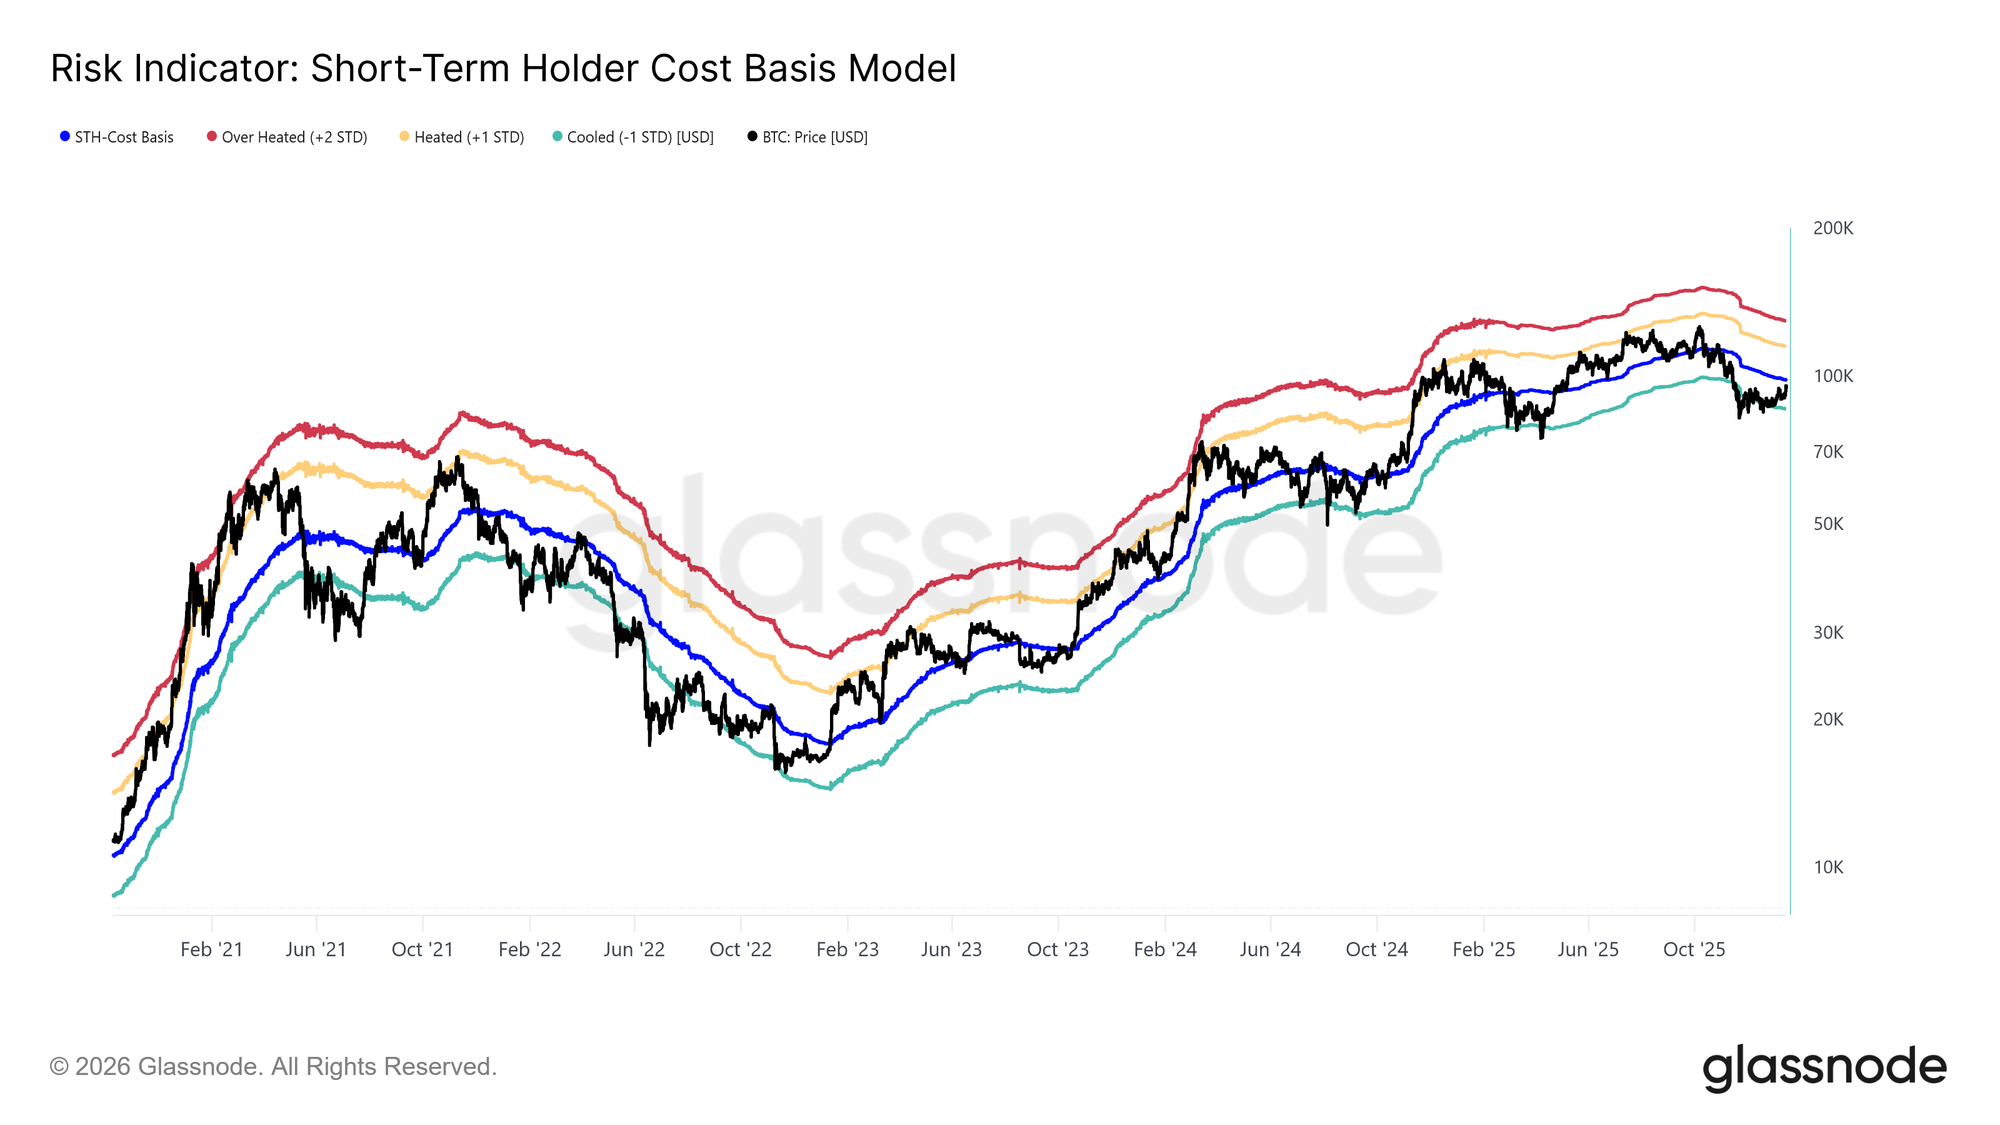
Столкнувшись с возобновленным давлением продавцов со стороны крупных покупателей, внимание смещается в сторону себестоимости краткосрочных держателей, которая в настоящее время находится на уровне $98,3 тыс. Этот уровень представляет собой совокупную цену входа недавних инвесторов и служит критическим индикатором рыночной уверенности. Устойчивая торговля выше этого порога указывала бы на то, что новый спрос поглощает нависающее предложение, позволяя недавним покупателям оставаться в прибыли.
Исторически, возврат и удержание выше себестоимости краткосрочных держателей отмечали переход от коррекционных фаз к более устойчивым восходящим трендам. И наоборот, повторная неспособность стабилизироваться выше этого уровня рискует усилить оборонительное поведение среди новых участников. Таким образом, способность цены консолидироваться выше $98,3 тыс. остается необходимым условием для восстановления уверенности в продолжении тренда и заложения основ для устойчивого ралли.
Распределение LTH замедляется
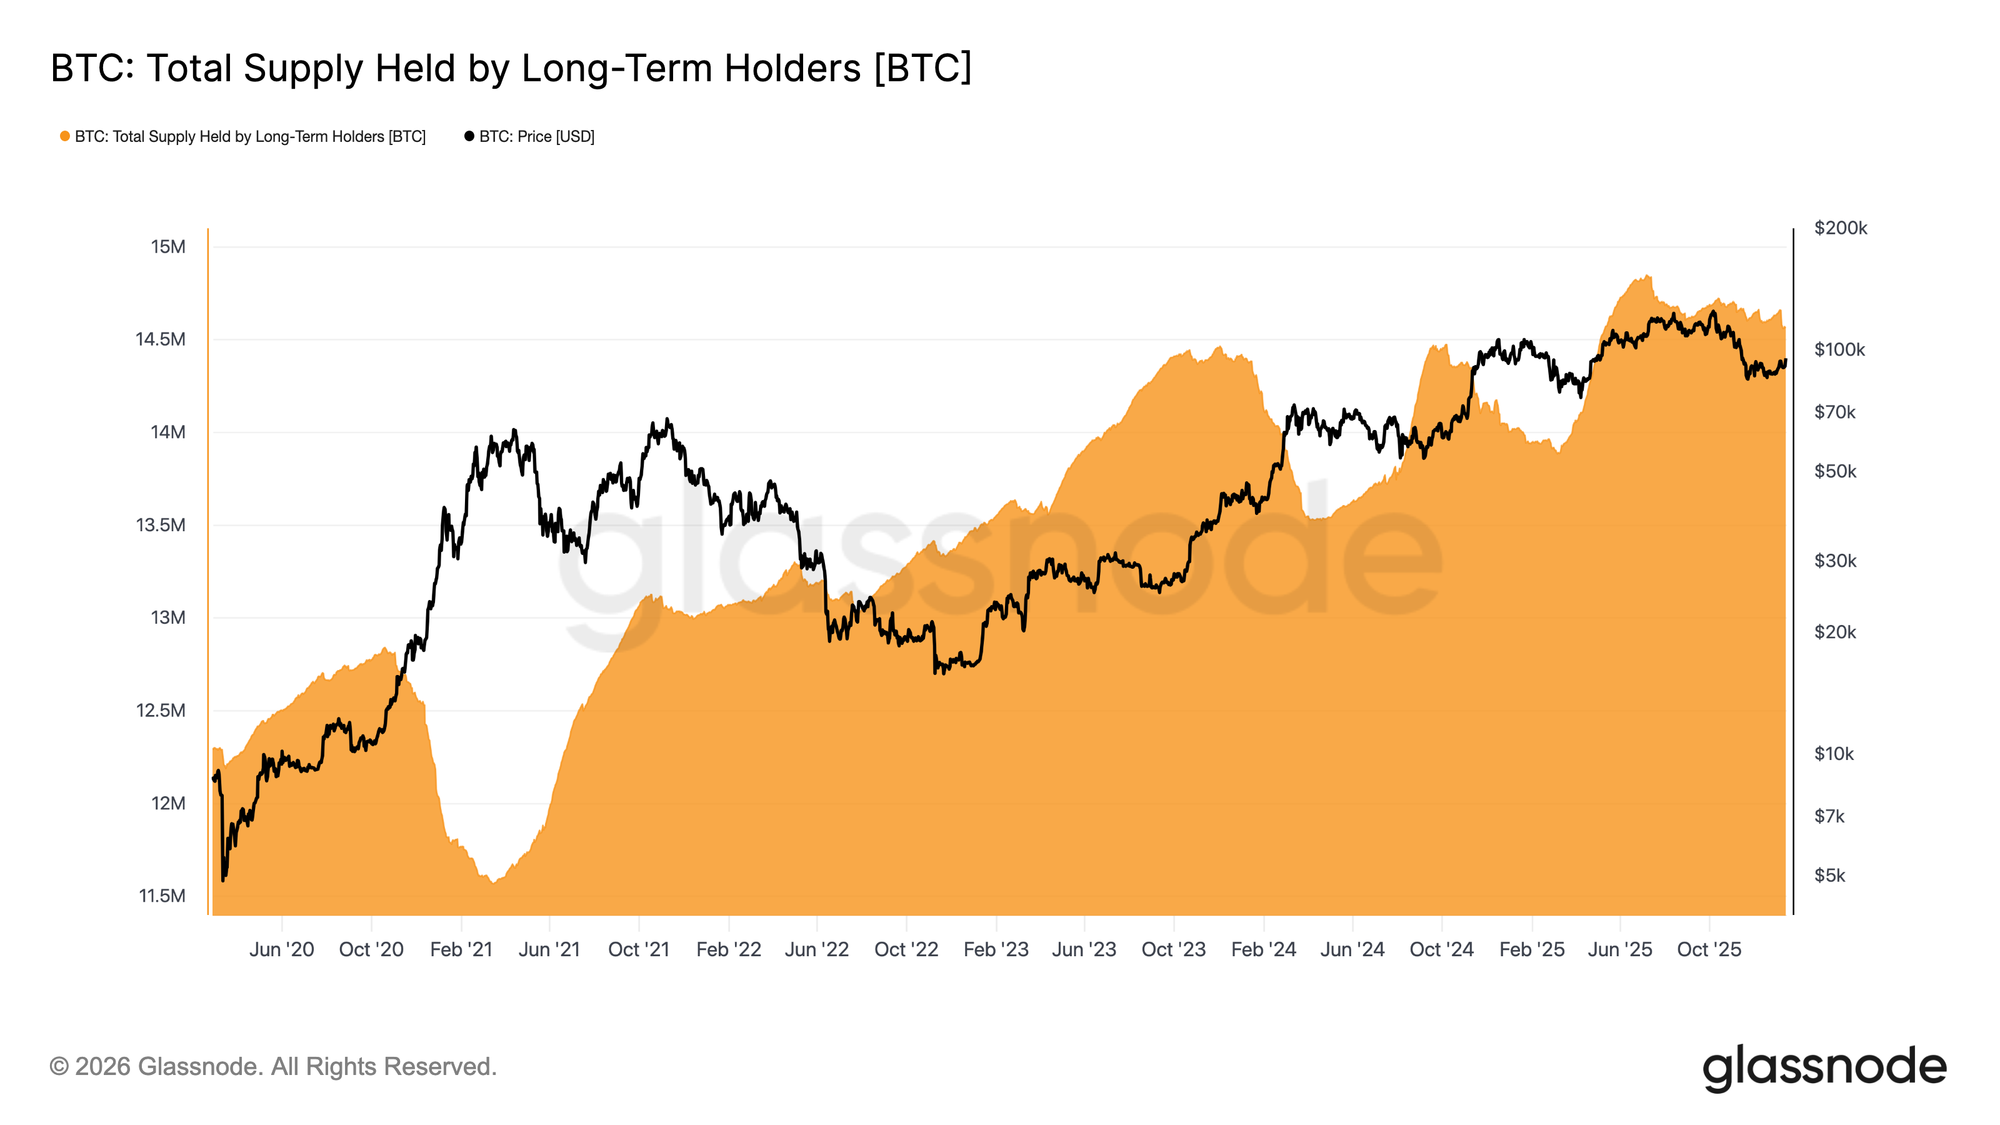
Поскольку цена приближается к предложению долгосрочных держателей, фокус смещается на то, ускоряют ли эти инвесторы распределение или начинают ослаблять давление со стороны продавцов. Одним из полезных индикаторов является Общий объем предложения, удерживаемый долгосрочными держателями, который отражает баланс между монетами, созревающими за порог ~155 дней, и монетами, которые тратятся.
В настоящее время предложение долгосрочных держателей продолжает снижаться, но темп снижения существенно замедлился по сравнению с агрессивным распределением, наблюдавшимся на протяжении всего третьего и четвертого кварталов 2025 года. Это указывает на то, что долгосрочные держатели остаются чистыми продавцами, хотя интенсивность их продаж moderates.
Для возникновения устойчивого ралли рынок должен перейти в режим, где предложение от созревания опережает spending долгосрочных держателей. Такой сдвиг подтолкнул бы предложение LTH выше, структура, последний раз наблюдавшаяся в период с августа 2022 по сентябрь 2023 и с марта 2024 по июль 2025 года, оба периода предшествовали более сильным и устойчивым восстановлениям тренда.
Спрос против распределения
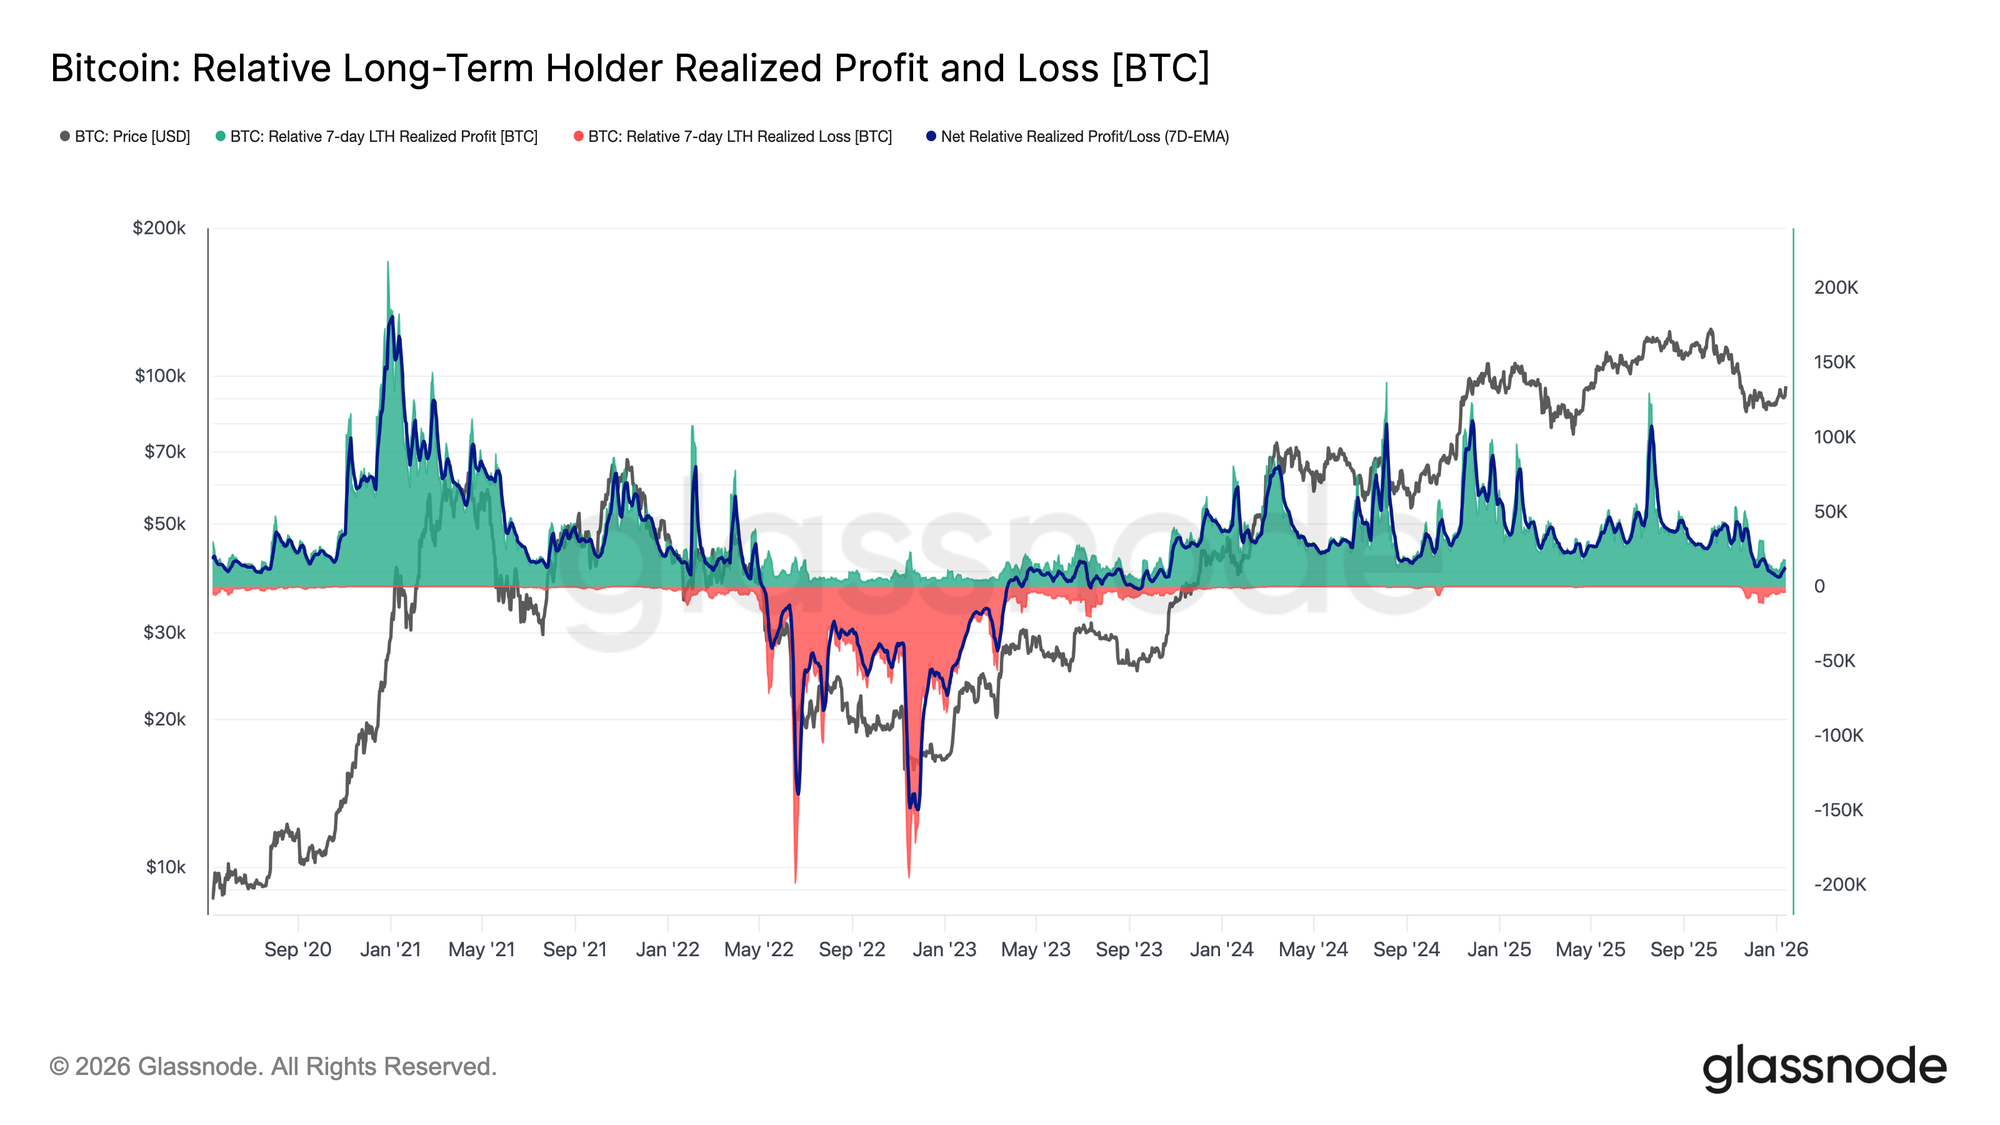
В целом, долгосрочные держатели, которые накапливали во втором квартале 2025 года, остаются наиболее вероятным источником давления продавцов, если цена решительно пройдет через верхний кластер предложения. Их поведение хорошо captured показателем Чистой Реализованной Прибыли и Убытков Долгосрочных Держателей, который в настоящее время отражает markedly более cool режим распределения.
В настоящее время долгосрочные держатели реализуют приблизительно 12,8 тыс. BTC в неделю в виде чистой прибыли, что представляет собой существенное замедление по сравнению с пиками цикла выше 100 тыс. BTC в неделю. Эта moderation предполагает, что фиксация прибыли остается активной, но гораздо менее агрессивной, чем в предыдущие фазы распределения.
То, что последует, будет зависеть primarily от способности стороны спроса поглотить это предложение, particularly от инвесторов, накопивших за второй квартал 2025 года. Неспособность удержаться выше Истинной Рыночной Средней на уровне ~$81 тыс., в долгосрочной перспективе, значительно увеличила бы риск более глубокой фазы капитуляции, напоминающей период с апреля 2022 по апрель 2023 года.
Офф-чейн инсайты
Сброс институциональных потоков
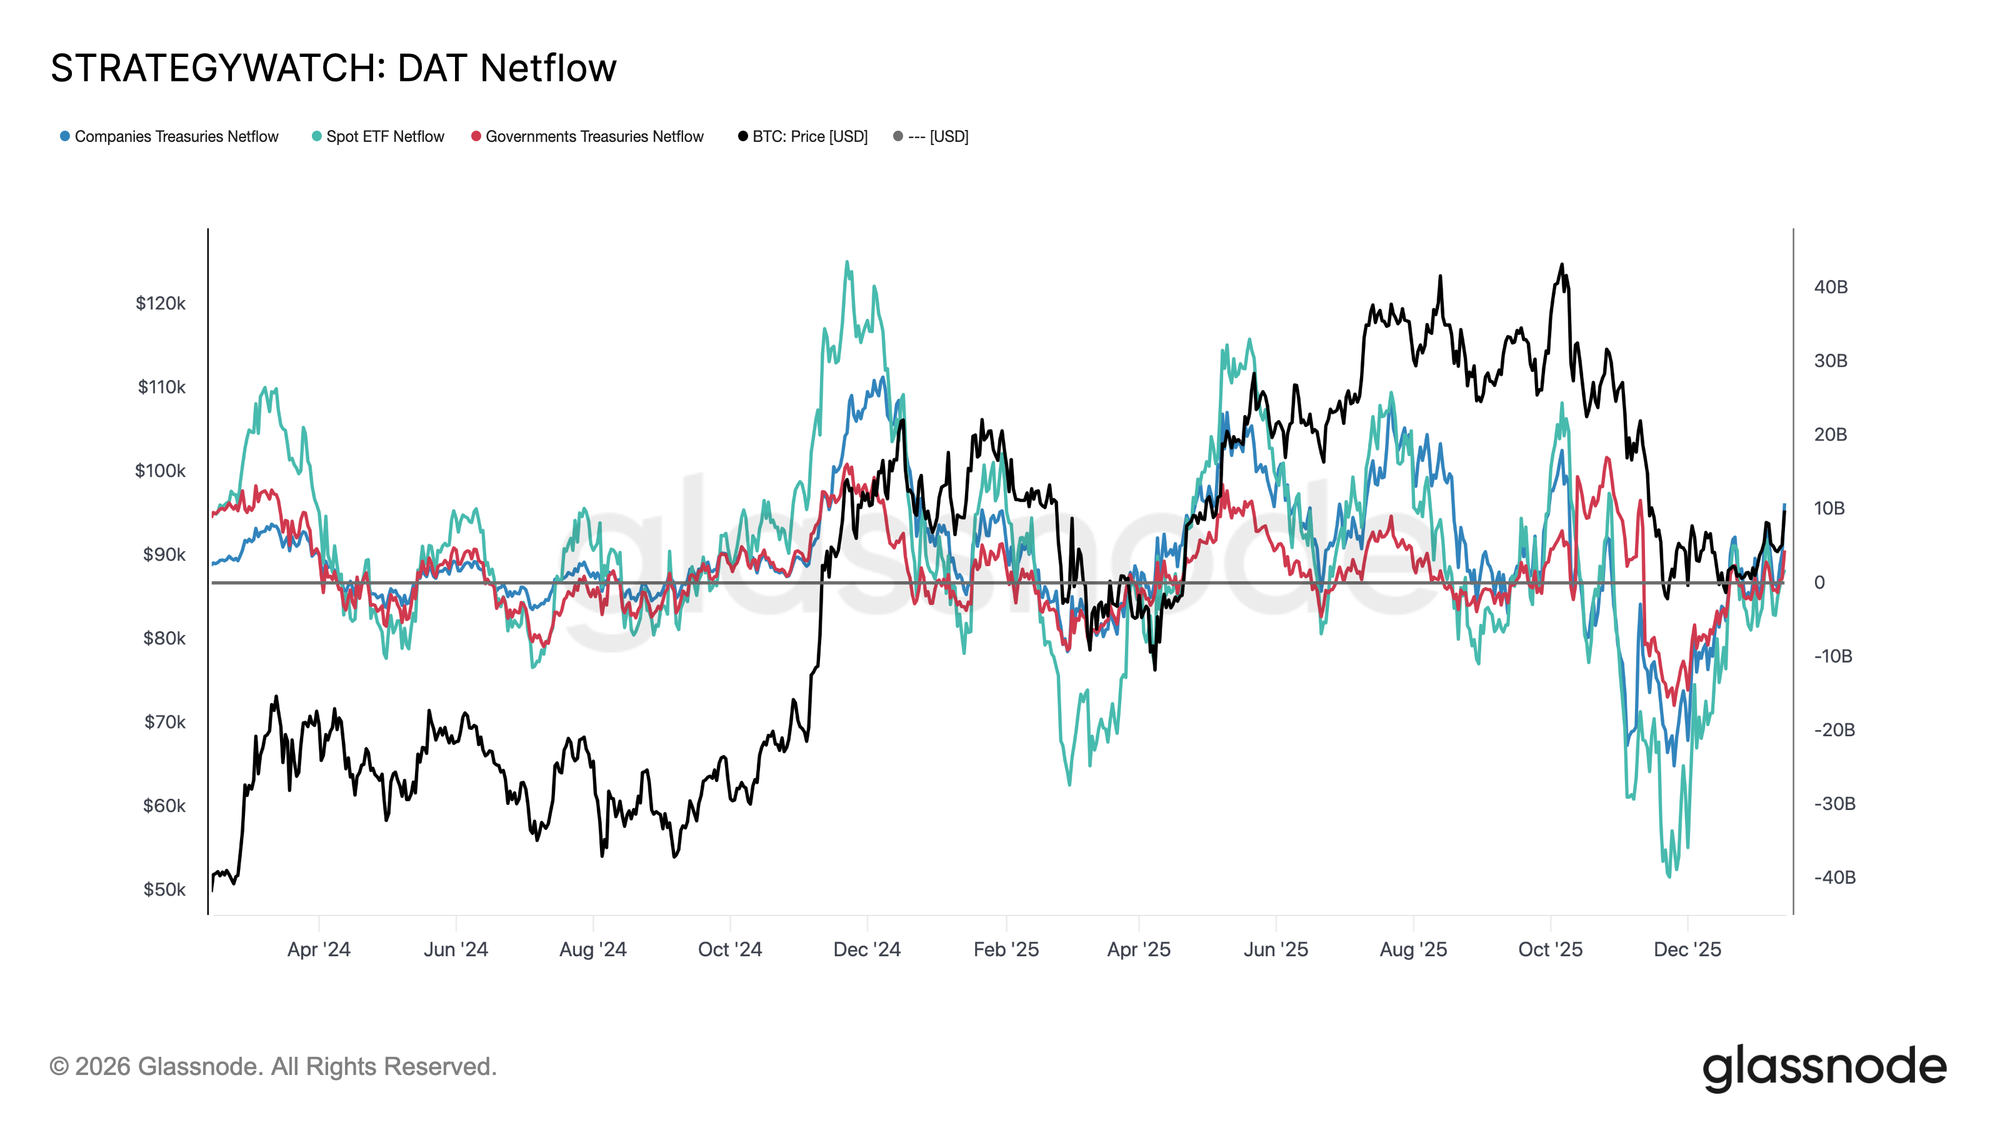
Институциональные балансовые потоки прошли полный сброс за последние несколько месяцев. После prolonged периода сильных оттоков across спотовых ETF, корпораций и суверенных entities, чистые потоки теперь стабилизировались, отмечая clear истощение давления продавцов со стороны долгосрочных структурных держателей.
Спотовые ETF первыми развернулись, вернувшись на положительную территорию и вновь утвердив себя в качестве primary маржинального покупателя. С момента своего создания спотовые ETF играли major роль в каждой фазе expansion, и их renewed притоки предполагают, что allocators реальных денег снова начинают восстанавливать экспозицию, а не просто торговать волатильностью.
Корпоративные и суверенные казначейские потоки также выровнялись, с притоками, появляющимися sporadically вокруг фаз консолидации. Однако накопление остается uneven и event-driven, а не последовательным.
В этой среде балансовый спрос действует больше как стабилизатор цены, чем двигатель роста, оставляя ближайшее направление increasingly чувствительным к derivatives позиционированию и краткосрочным условиям ликвидности.
Спотовые потоки становятся конструктивными
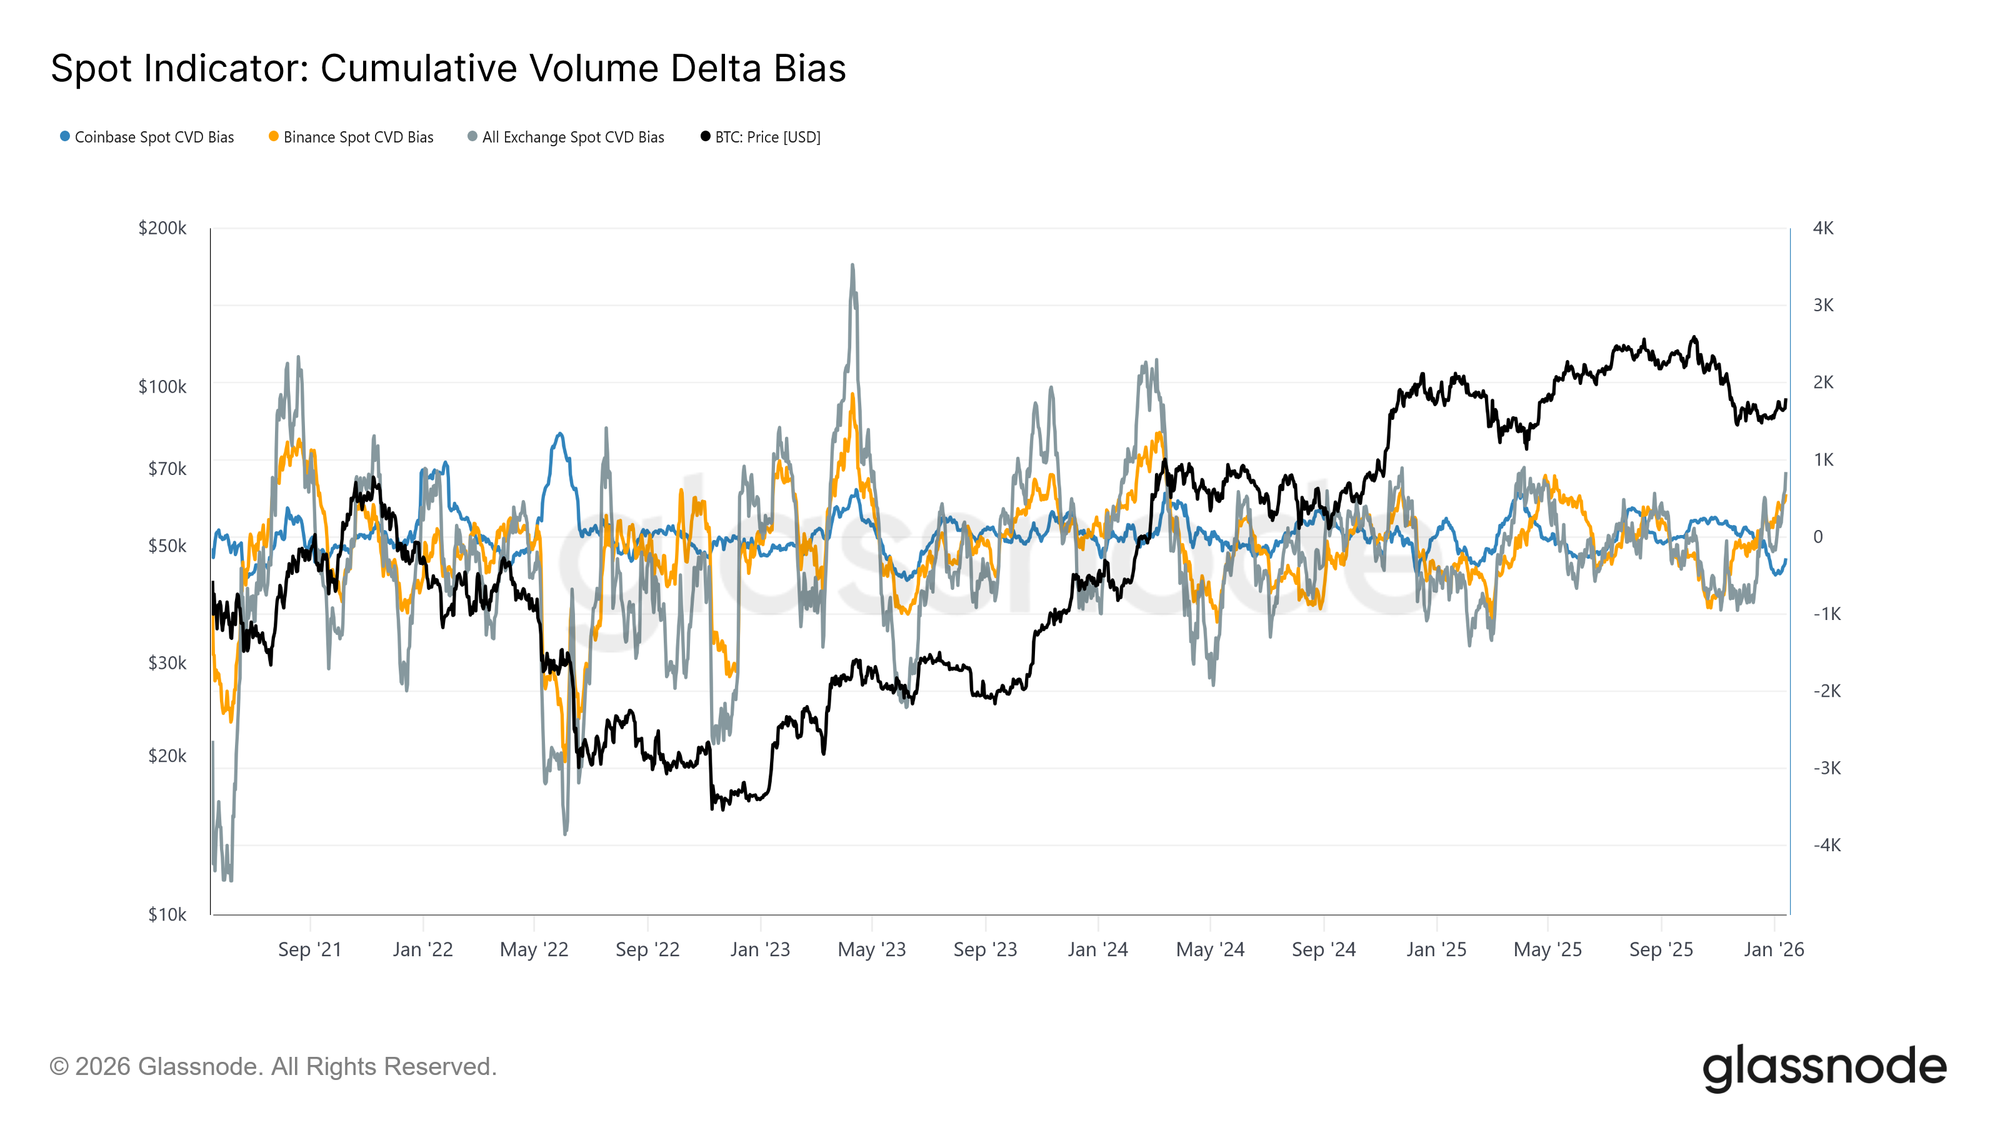
Поведение спотового рынка начало улучшаться после недавнего снижения, с measures CVD бирж Binance и aggregate переходящими обратно в buy-доминантный режим. Это отражает сдвиг от persistent давления продавцов и signals, что участники рынка снова поглощают предложение, а не распределяют в силу.
В то же время, Coinbase, который был самым consistent источником агрессии продавцов на протяжении консолидации, meaningfully замедлил свою продажную активность. Ослабление distribution под руководством Coinbase удалило key источник нависающего предложения, помогая стабилизировать цену и расчищая путь для ongoing ралли.
Хотя спотовое участие еще не демонстрирует persistent, агрессивное накопление, typically наблюдаемое durante полных фаз expansion тренда, переход обратно в net-покупающую posture across major площадкам представляет собой конструктивный структурный сдвиг.
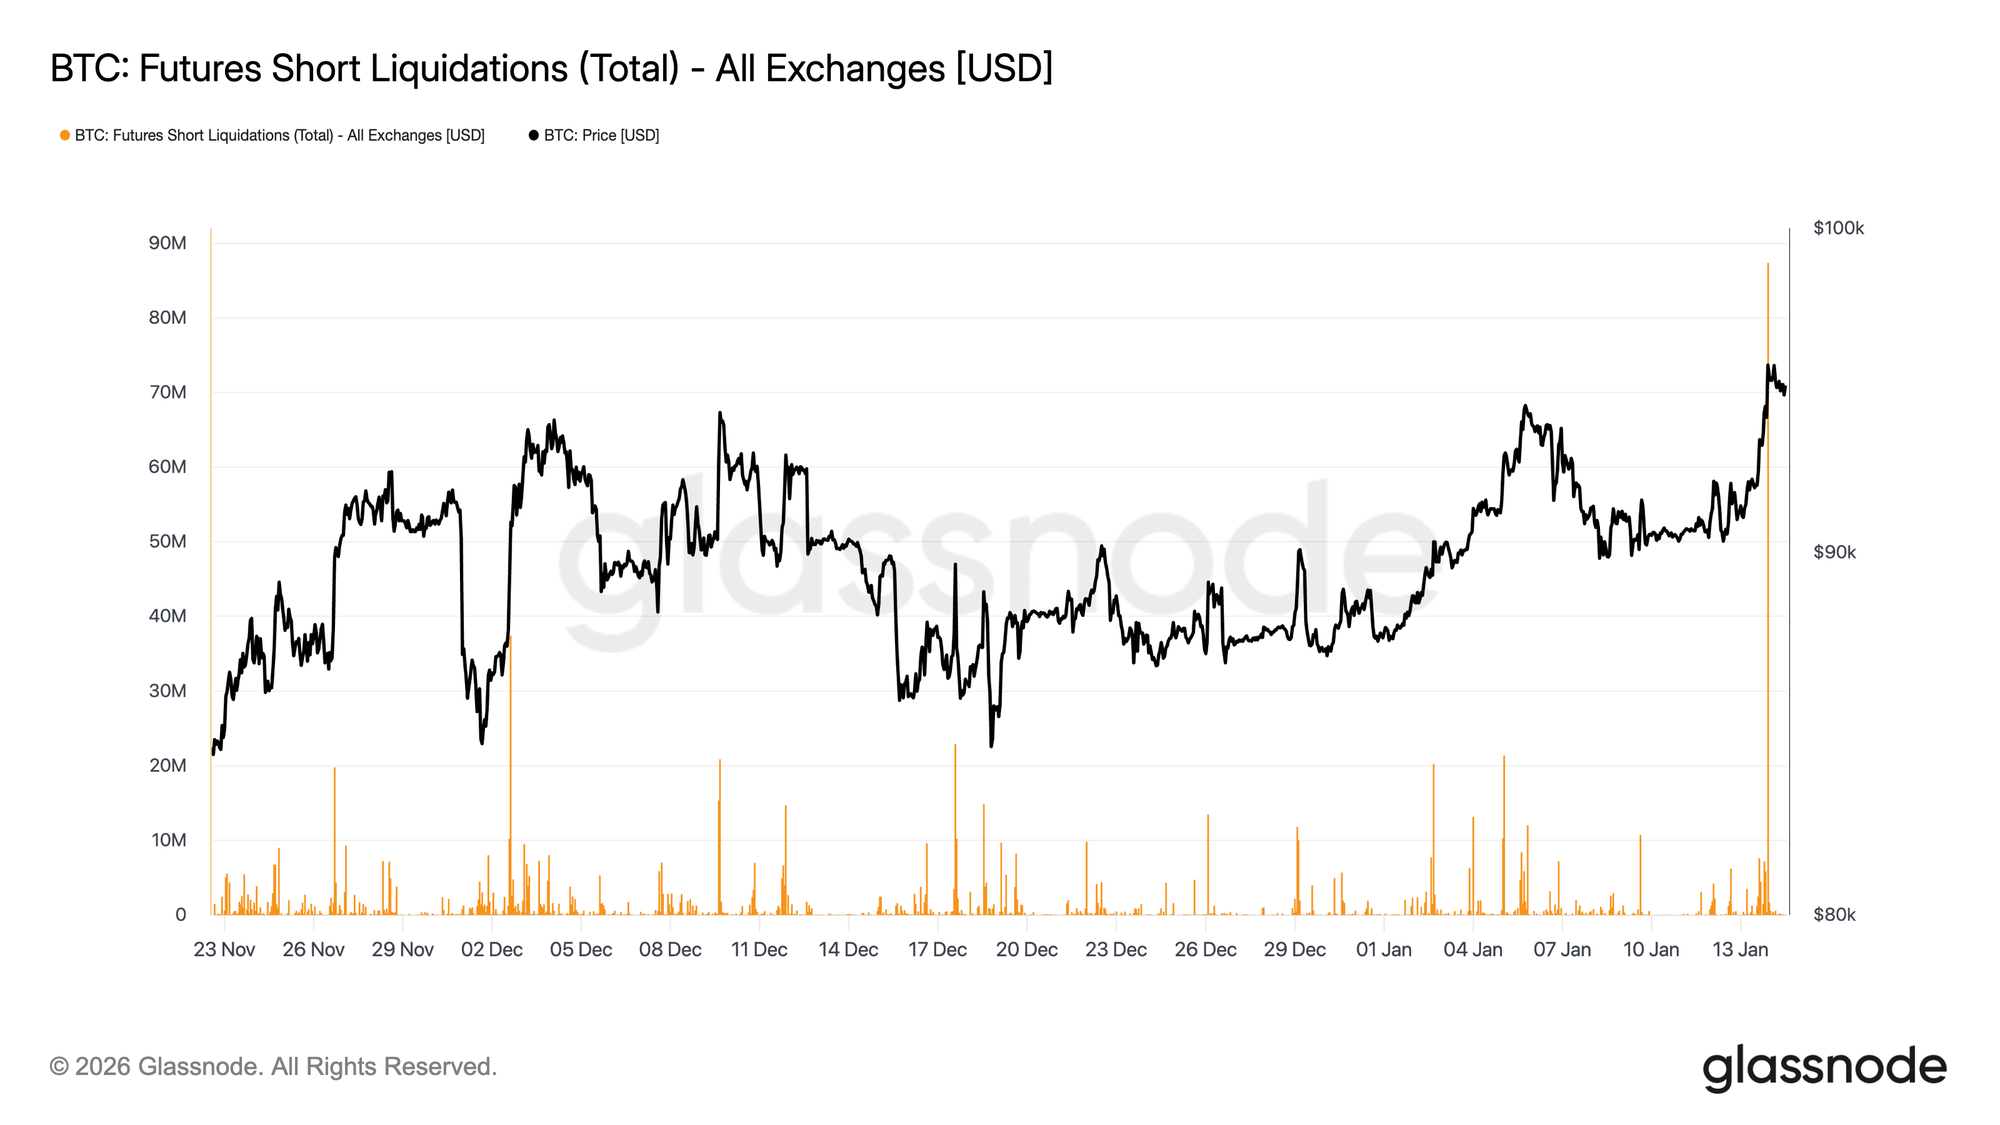
Трейдеры фьючерсов выжимают шорты
В то время как толчок в регион $96K был механически усилен short ликвидациями, он также развернулся на относительно thin объеме derivatives. Оборот фьючерсов оставался значительно ниже повышенной активности, наблюдавшейся на протяжении большей части 2025 года, даже несмотря на то, что цены восстановили более высокие уровни.
Это указывает на то, что пробой произошел в сравнительно light ликвидной среде, где modest сдвиги позиционирования смогли вызвать disproportionately большие ценовые responses. Практически, не потребовалось significant нового капитала, чтобы вытеснить шортов с рынка и поднять цену через сопротивление.
Это оставляет рынок зависимым от того, смогут ли теперь спотовый спрос и устойчивый объем вмешаться, чтобы поддержать продолжение, или же ралли рискует иссякнуть, как только механическое покупательное давление от forced покрытия будет исчерпано.
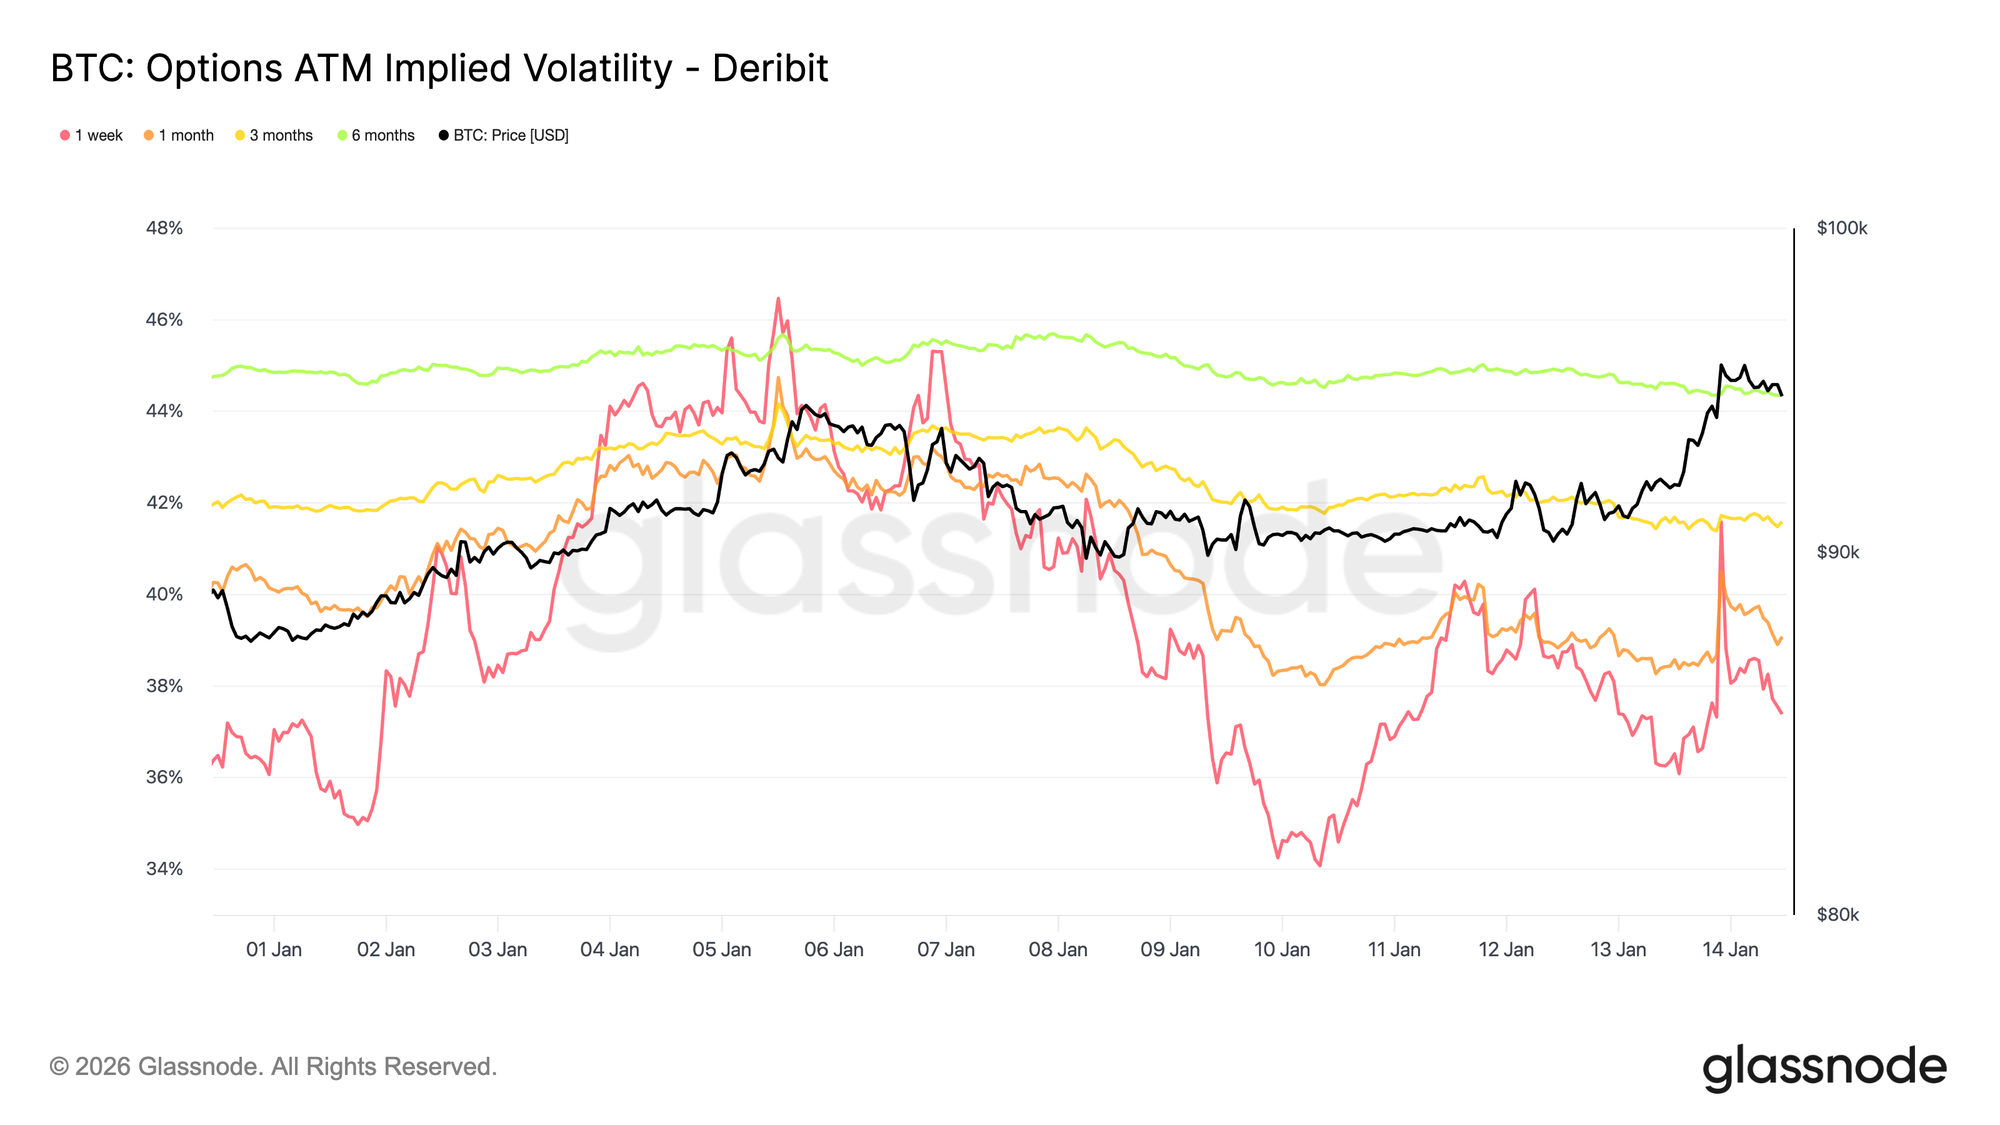
Низкая волатильность, нерешенный риск
Подразумеваемая волатильность остается низкой по всей кривой, усиливая спокойствие, observed в недавних ценовых действиях. Более долгосрочные maturity modestly дрейфовали ниже, в то время как краткосрочная подразумеваемая волатильность реагирует более directly на спотовые moves. Однако эти front-end реакции не распространяются вверх по кривой, указывая на limited спрос на near-term выпуклость.
Это не сигнал о том, что неопределенность исчезла. Скорее, это suggests, что риск откладывается. Рынок опционов не выражает уверенности, а view, что любая meaningful переоценка более вероятно произойдет позже, чем немедленно.
Волатильность постепенно увеличивается с maturity, указывая на то, что неопределенность assigned времени, а не specific near-term катализатору. Терм структура adjusting по уровню, а не по форме, consistent с рынком, который ожидает краткосрочной стабильности, оставаясь exposed к latent риску.
Это важно, потому что волатильность, подавленная позиционированием, а не ясностью, имеет тенденцию к переоценке abruptly, когда условия меняются.
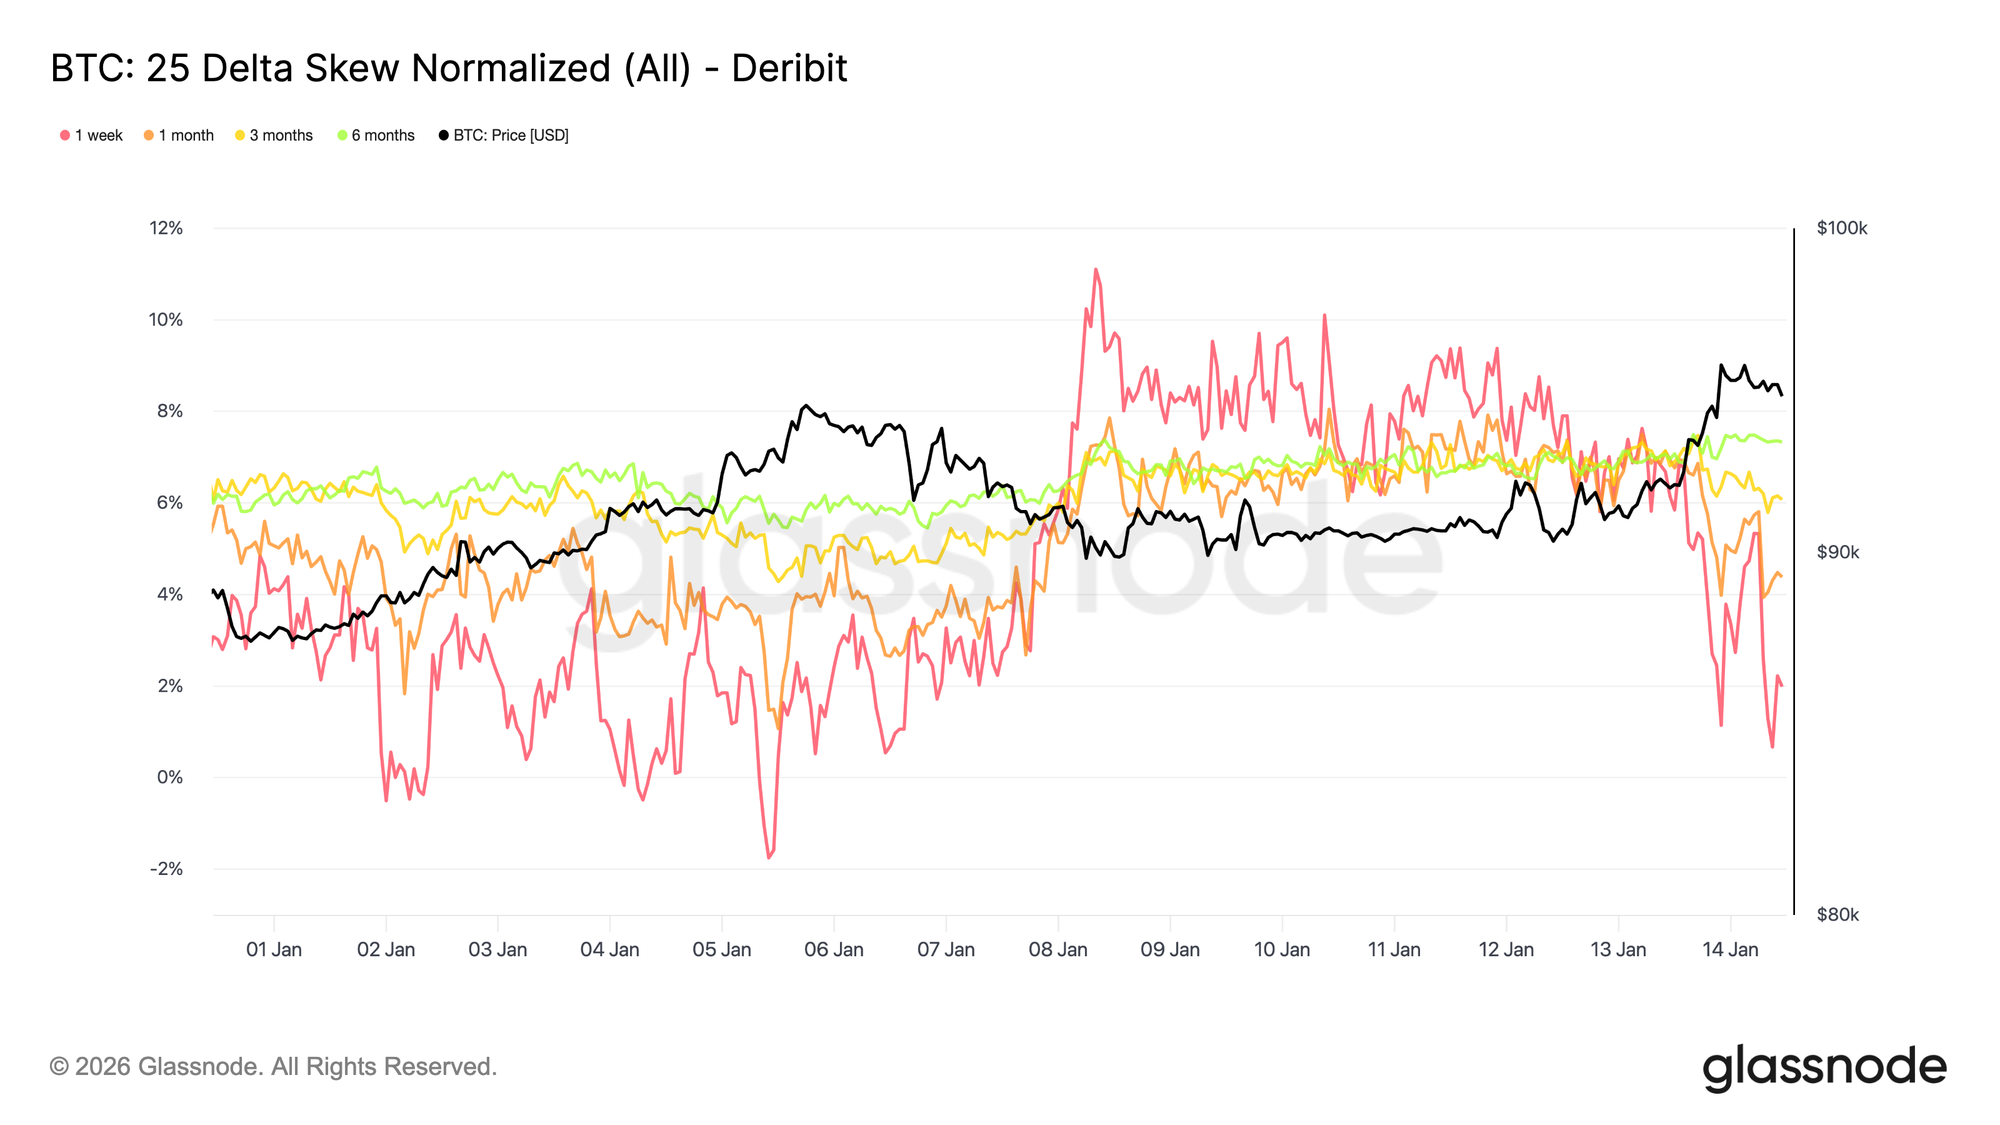
Асимметрия вниз остается твердо оцененной
В то время как общая волатильность остается низкой, skew продолжает оценивать downside риск. 25 delta skew остается смещенным в сторону путов, particularly в средних и более длинных maturity, указывая на persistent спрос на более долгосрочную защиту от падения, даже несмотря на стабилизацию спота и восстановление уровня 95K.
Это отражает рынок, который comfortable несет экспозицию, но не желает делать это без страховки. Защита поддерживается, а не агрессивно добавляется, signaling осторожность, а не stress. Краткосрочный skew briefly двигался к балансу before rotating обратно в пользу путов, в то время как более долгосрочный skew показал little реакцию на движение обратно выше 95K.
Сосуществование низкой волатильности и отрицательного skew highlights key напряжение. Участники не позиционируются на немедленное падение, но они продолжают платить за асимметричную защиту.
Такое combination типично для range-bound рынков, где риски признаются, но не ожидается их немедленная materialization.
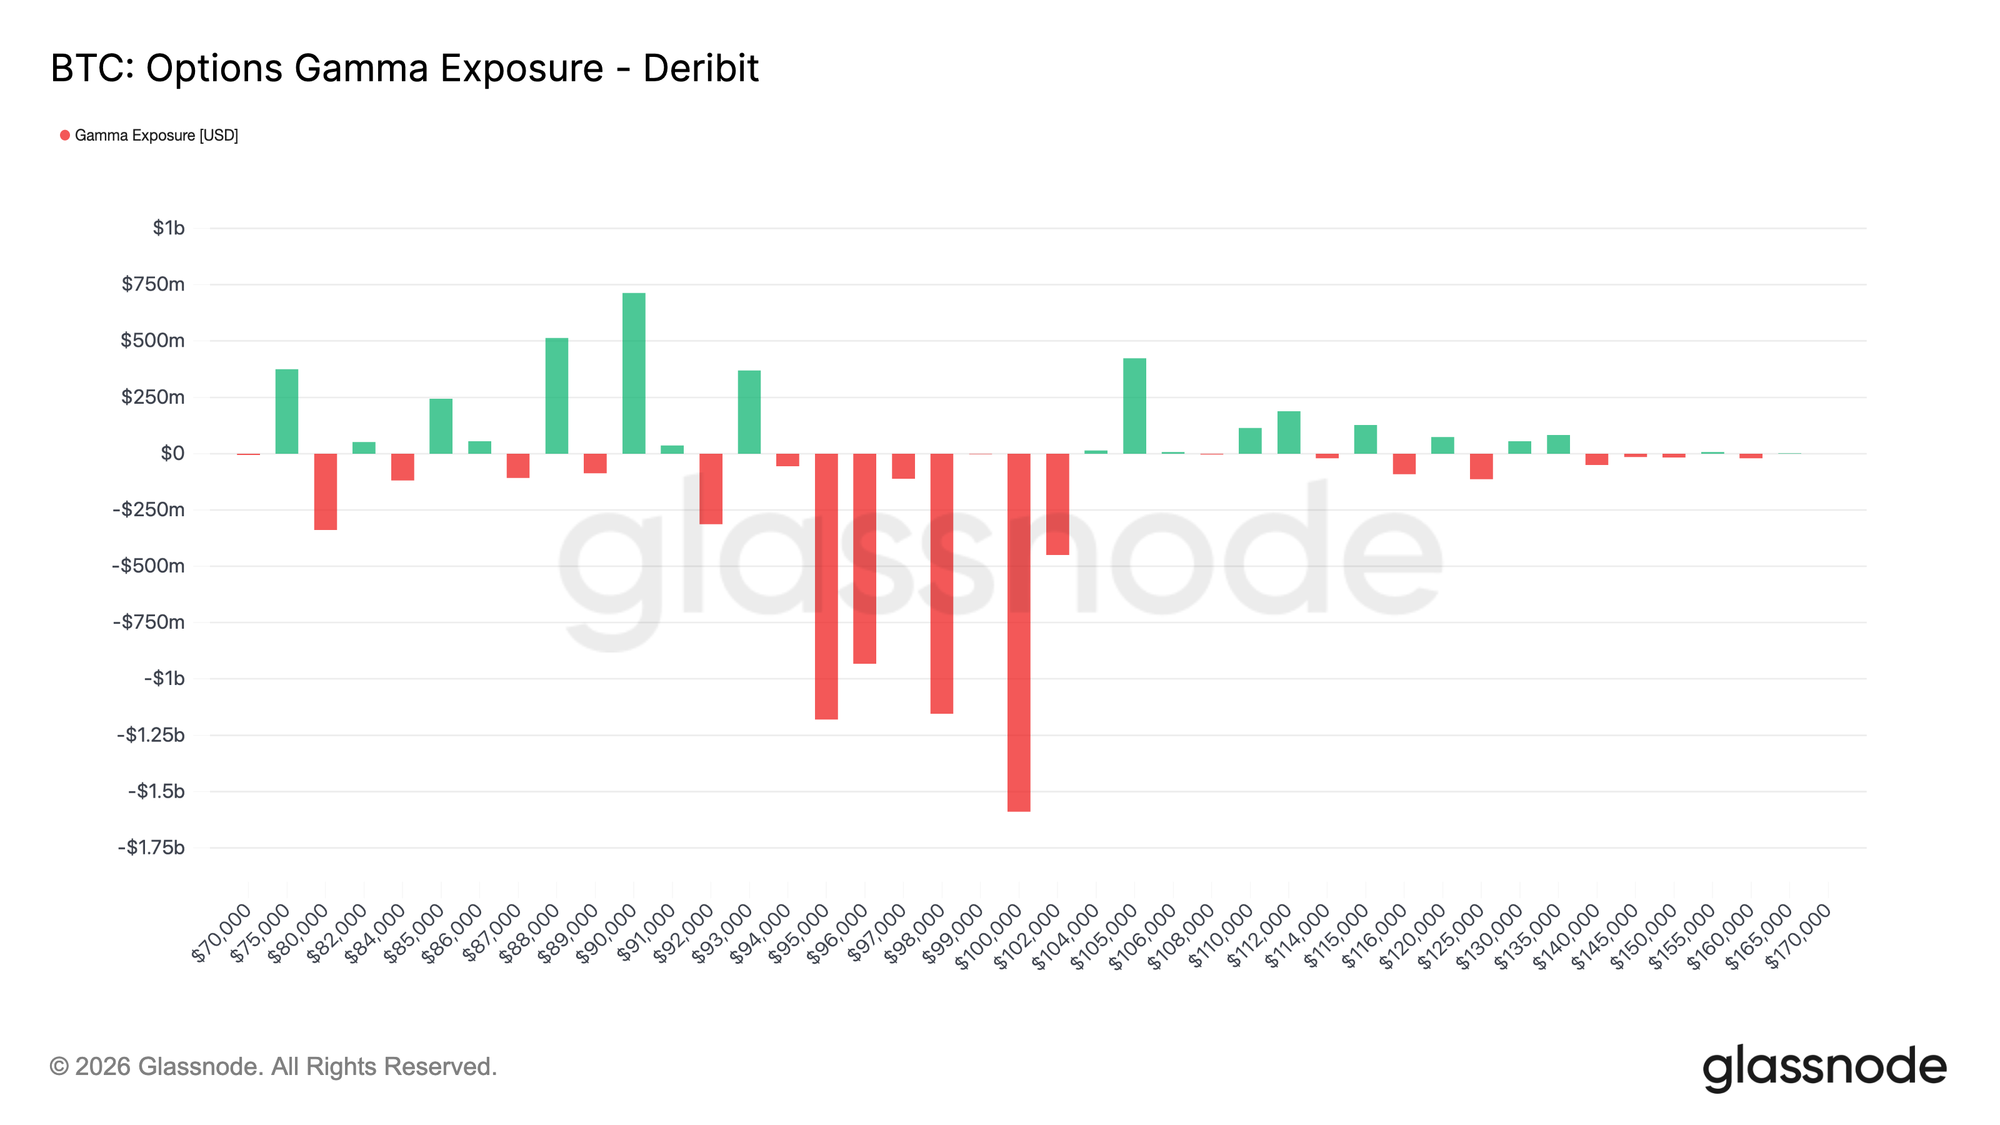
Короткая гамма и хрупкая стабильность
Текущее распределение страйков помещает дилеров в short гамму around спота, изменяя краткосрочную динамику рынка. В среде short гаммы хеджирующие потоки больше не поглощают ценовые движения. Вместо этого они tend усиливать их, с дилерами, покупающими при росте цен и продающими при declines.
При торговле спота around области 95–96K на момент написания, цена переместилась в short гамма зону, которая простирается roughly от 94K до 104K. В пределах этого диапазона, устойчивое ценовое действие, supported объемом, более likely вызовет directional хеджирующие потоки, увеличивая potential для более быстрого движения к nearby высокоинтересным страйкам, including уровень 100K.
Эта структура создает хрупкую форму стабильности. Волатильность может оставаться низкой, пока цена сдерживается, но once momentum развивается, движения более likely ускоряются, чем fade. В этом контексте спокойное ценовое поведение отражает позиционирование, а не баланс, оставляя рынок более exposed к abrupt переоценке, чем к gradual adjustment.
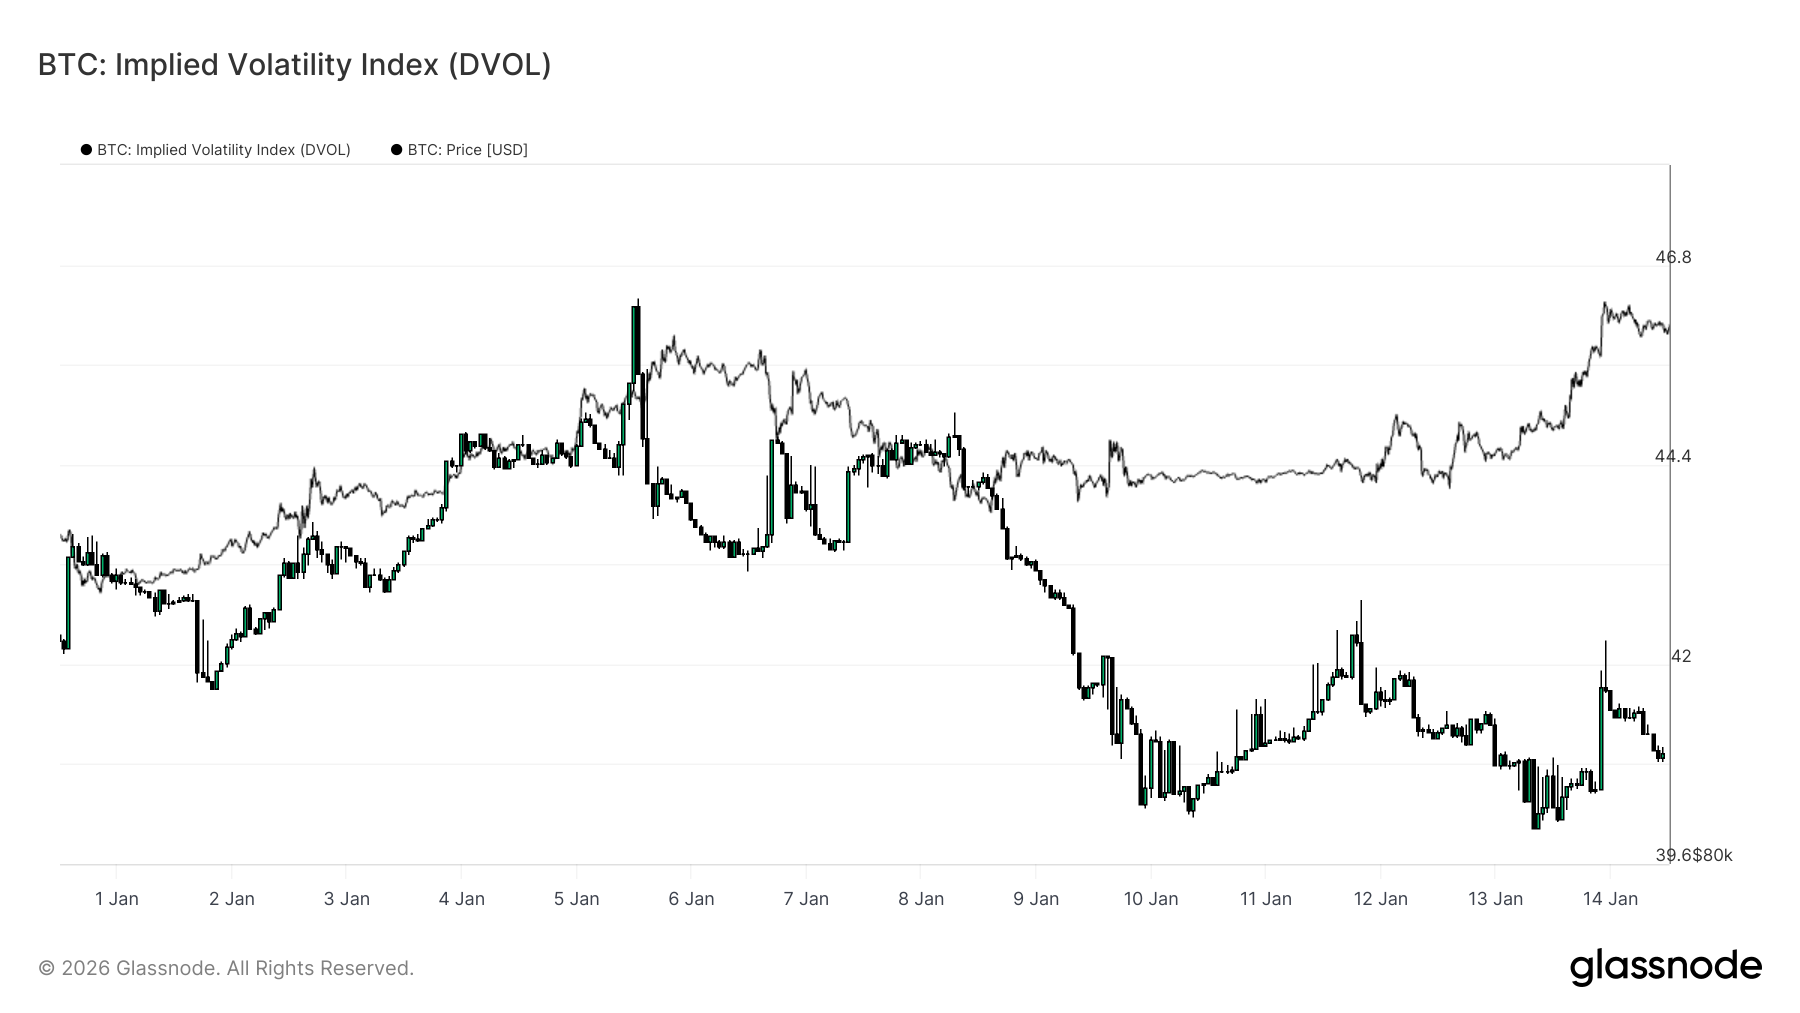
DVOL подтверждает, что волатильность откладывается
Индекс подразумеваемой волатильности (DVOL) provides поверхностный взгляд на uncertainty, подразумеваемую опционами, путем агрегирования волатильности across страйков и maturity. В отличие от подразумеваемой волатильности at-the-money, которая отражает ценообразование в specific точке на кривой, DVOL captures, сколько волатильности рынок закладывает overall.
В настоящее время DVOL остается relatively низким и range-bound, даже несмотря на то, что спот прошел through key уровни. Это подтверждает то, что терм структура и skew уже suggest: рынок опционов не платит за immediate волатильность. Неопределенность признается, но она не выражается через более высокое aggregate ценообразование волатильности.
Важно, что это низкое чтение DVOL совпадает с downside-смещенным skew и short гамма позиционированием near спота. Следовательно, волатильность не сжимается стабилизирующими хеджирующими потоками, а просто откладывается на поверхностном уровне. Это combination создает условия, при которых волатильность может оставаться dormant, yet резко переоцениваться, once катализатор заставляет позиционирование adjust.
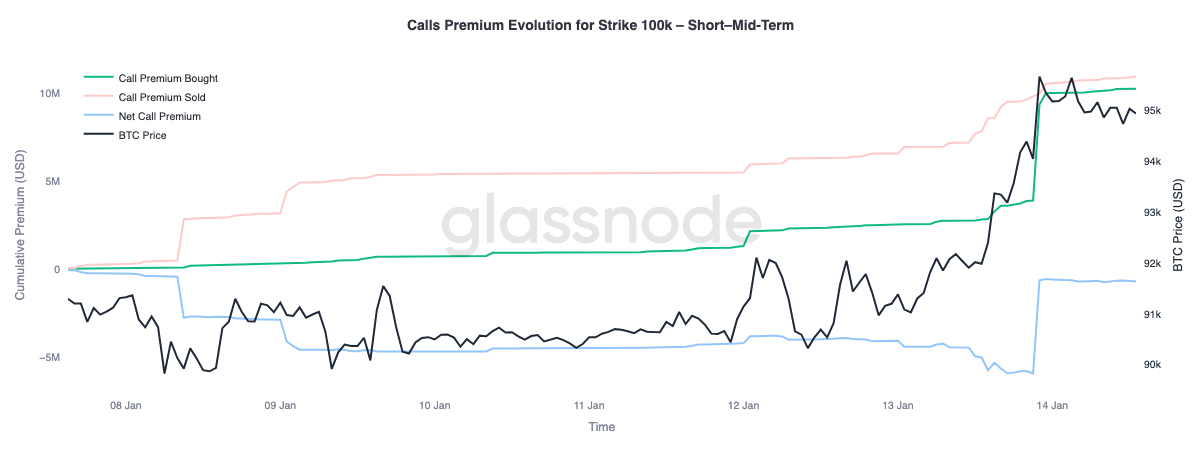
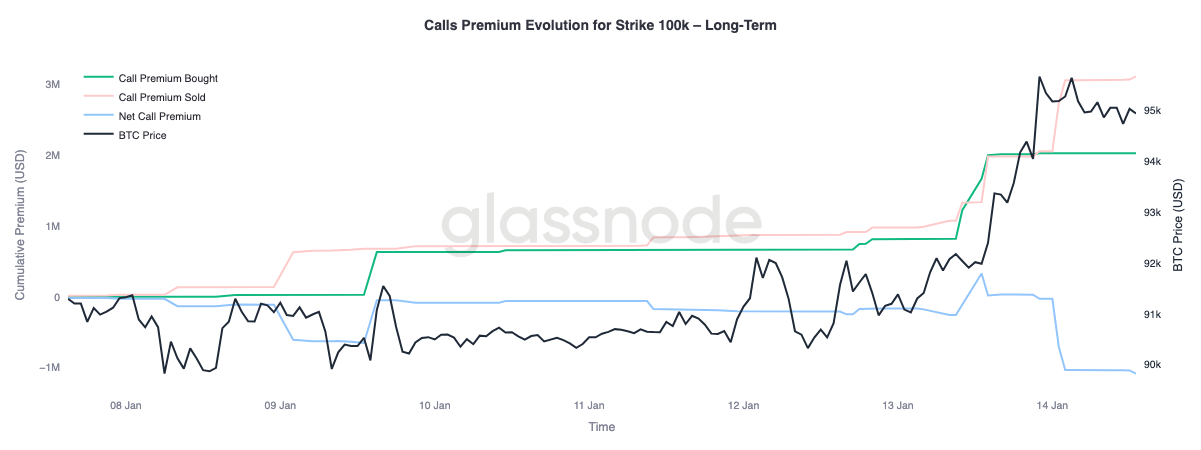
Премия коллов сигнализирует об условном росте
Более пристальный взгляд на поведение премии страйка колл 100K highlights clear расхождение across maturity. Этот уровень остается следующим major психологическим threshold, и опционные потоки показывают, как рынок позиционируется around него.
В краткосрочных и среднесрочных maturity, до roughly трех месяцев, купленная премия коллов significantly перевешивала проданную премию коллов. Этот дисбаланс drove net премию коллов выше, указывая на active спрос на near-dated восходящую экспозицию по мере приближения спота к уровню. В contrast, более долгосрочные maturity показывают противоположное поведение. По мере роста спота, более богатые премии коллов further out по кривой использовались как opportunities для продажи роста.
Это split suggests, что рынок позиционируется на potential retest области 100K, одновременно выражая hesitation относительно устойчивого принятия выше этого уровня over более длинных горизонтов. Рост targeted тактически в near term, но монетизируется на более длинных maturity.
Заключение
Биткоин вошел в переходную фазу, отмеченную стабилизирующимися структурными потоками, улучшающимся спотовым поведением и derivatives комплексом, все еще shaped отложенным риском волатильности. Распределение долгосрочных держателей замедлилось, институциональные балансовые потоки стабилизировались, а спотовые рынки начали переходить обратно в buy-доминантные режимы, suggesting, что большая часть давления продавцов конца 2025 года теперь поглощена.
Однако недавнее движение в регион $96K было driven больше механической динамикой позиционирования, чем широким organic спросом. Ликвидность фьючерсов остается thin, а спотовое участие, хотя и улучшается, еще не показало persistent накопления, typically наблюдаемого durante полных фаз expansion тренда.
Looking вперед на первый квартал, базовая setup appears increasingly конструктивной. С ослабевающим давлением продавцов и отложенным, а не погашенным риском волатильности, relatively modest притоки могут once again генерировать непропорционально большие ценовые responses. Если спотовое накопление и ETF-ведомый институциональный спрос продолжат восстанавливаться, текущая фаза консолидации может служить base для renewed expansion тренда.