На этой неделе рынок ищет направление в условиях волатильности, где возможности сосуществуют с рисками. Дневная структура волны V HYPE приближается к ключевому узлу проверки, где успех или провал поддержки на уровне 40,17 долларов определит последующую динамику; BTC, в свою очередь, балансирует между продолжением отскока волны D и сопротивлением в зоне давления, при этом ядром внимания остается игра быков и медведей в диапазоне 73 500–79 000 долларов.
Следование тренду и строгая дисциплина — вот что позволяет уверенно двигаться вперед в сложных рыночных условиях.
Ключевые тезисы для торговли на неделю:
• Анализ текущей структуры движения HYPE. (Подробности в части 1)
• Прогноз по HYPE на неделю и стратегия для краткосрочных операций. (Подробности в части 2)
• Анализ структуры движения BTC на нескольких таймфреймах. (Подробности в части 3)
• Прогноз по BTC на неделю и стратегия для среднесрочных и краткосрочных операций. (Подробности в части 4)
Проверка рынком торговых стратегий и ключевых тезисов прошлой недели:
• Эффективность краткосрочной торговли HYPE: На прошлой неделе была совершена одна краткосрочная сделка на покупку HYPE (плечо 1x), совокупный доход составил около 6,80%. (Подробности в Таблице 1)
• Проверка рыночного прогноза движения HYPE: В предыдущей статье мы отмечали, что отскок HYPE от минимума 34,44 доллара 2 апреля по волновой структуре является потенциальным дневным восходящим движением волны V. Текущее движение рынка подтвердило нашу точку зрения. На прошлой неделе рынок достиг максимума в 45,75 доллара, не только пробив максимум волны III от 18 марта в 43,78 доллара, но и установив новый максимум текущего восходящего тренда.
• Проверка эффективности среднесрочной торговли BTC: На прошлой неделе Bitcoin следовал установленной стратегии, продолжая удерживать короткую позицию, открытую на уровне 89 000 долларов (плечо 1x). На момент закрытия недели (около 73 800 долларов) прибыль составила около 17,08%, с максимальной прибылью за период около 32,58%.
• Проверка рыночного прогноза движения BTC: На прошлой неделе мы указывали, что рынок сохранит широкий диапазон волатильности. Текущее движение рынка подтвердило наш прогноз.
一、HYPE: Анализ структуры движения
График HYPE_4 часа
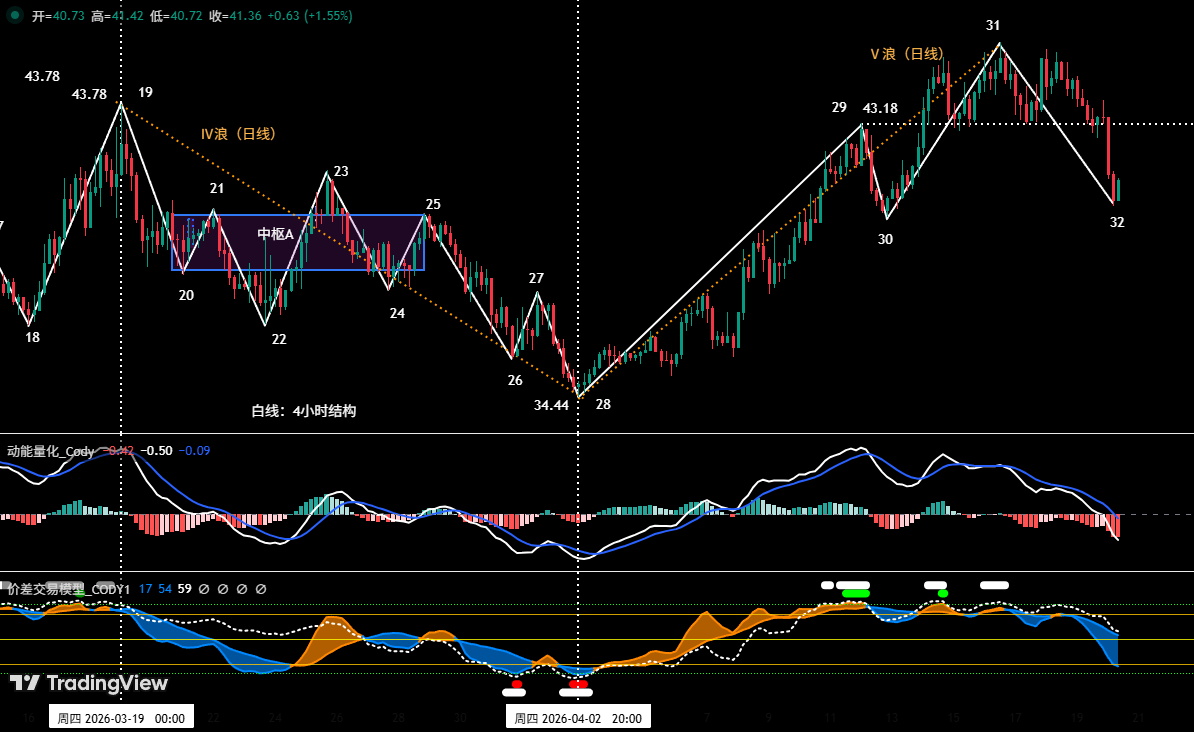
Рисунок 1
1. Как показано на (Рисунке 1), HYPE достиг нового максимума в 45,76 доллара 16 апреля, установив новый максимум отскока с минимума 20,46 доллара 21 января и пробив предыдущий максимум 43,78 доллара от 18 марта (максимум волны III). Таким образом, восходящее движение, начавшееся от минимума 34,44 доллара 2 апреля, можно временно рассматривать как восходящую структуру дневной волны V, которая все еще развивается.
2. Как показано на (Рисунке 1), указанную дневную волну V на 4-часовом таймфрейме можно детализировать далее как: восходящую структуру, состоящую из 4 сегментов: 28-29, 29-30, 30-31, 31-32.
3. В настоящее время行情 работает на корректирующем сегменте 31-32.
• В 4-часовой структуре HYPE наша собственная модель количественной оценки импульса зафиксировала, что две сигнальные линии импульса уже синхронно переместились ниже нулевой оси, что предвещает возможность удлинения времени этой коррекции, если она ослабнет.
• В настоящее время потенциальная конечная точка коррекции (т.е. точка 32) приблизилась к предыдущему уровню поддержки 40,17 доллара (т.е. точка 30).
二、Прогноз по HYPE на неделю и стратегия для краткосрочных операций
1. Прогноз движения HYPE на неделю:
Как показано на (Рисунке 1), следите, пробивает ли точка 32 точку 30 (т.е. 40,17 доллара):
• Если удержатся выше, то сохранится боковое движение в диапазоне 40,17–45,76 долларов;
• Если этот уровень поддержки будет пробит, и последующий максимум отскока не сможет превысить 45,76 доллара (т.е. точка 31), то сформируется классическая техническая модель «коррекция пробивает предыдущий минимум, но последующий отскок не обновляет максимум». Это будет означать, что восходящая структура дневной волны V, запущенная от минимума 2 апреля, с высокой вероятностью завершилась на отметке 45,76 доллара.
2. Стратегия краткосрочных операций с HYPE на неделю:
• Основываясь на прогнозе общего восходящего тренда, следует придерживаться стратегии «Следование тренду, покупка на снижении».
• На основе сигналов самостоятельно построенной количественной модели, используя 30-минутный/60-минутный таймфреймы в качестве операционного периода, использовать 30% капитала для поиска возможностей входа в длинную позицию.
• Стратегия открытия позиции: В начале недели HYPE столкнется с потребностью в коррекции. Если цена откатится к ключевой поддержке около 40,17 доллара и появятся сигналы подтверждения удержания выше поддержки, одновременно с сигналами покупки на дне, triggered двумя моделями, можно рассмотреть вход в длинную позицию, строго соблюдая дисциплину стоп-лосса.
三、Анализ структуры движения Биткоина на нескольких таймфреймах
1. Разметка волн на дневном таймфрейме BTC:(На основе行情 после максимума 6 октября 2025 года)
Биткоин _ Дневной график:
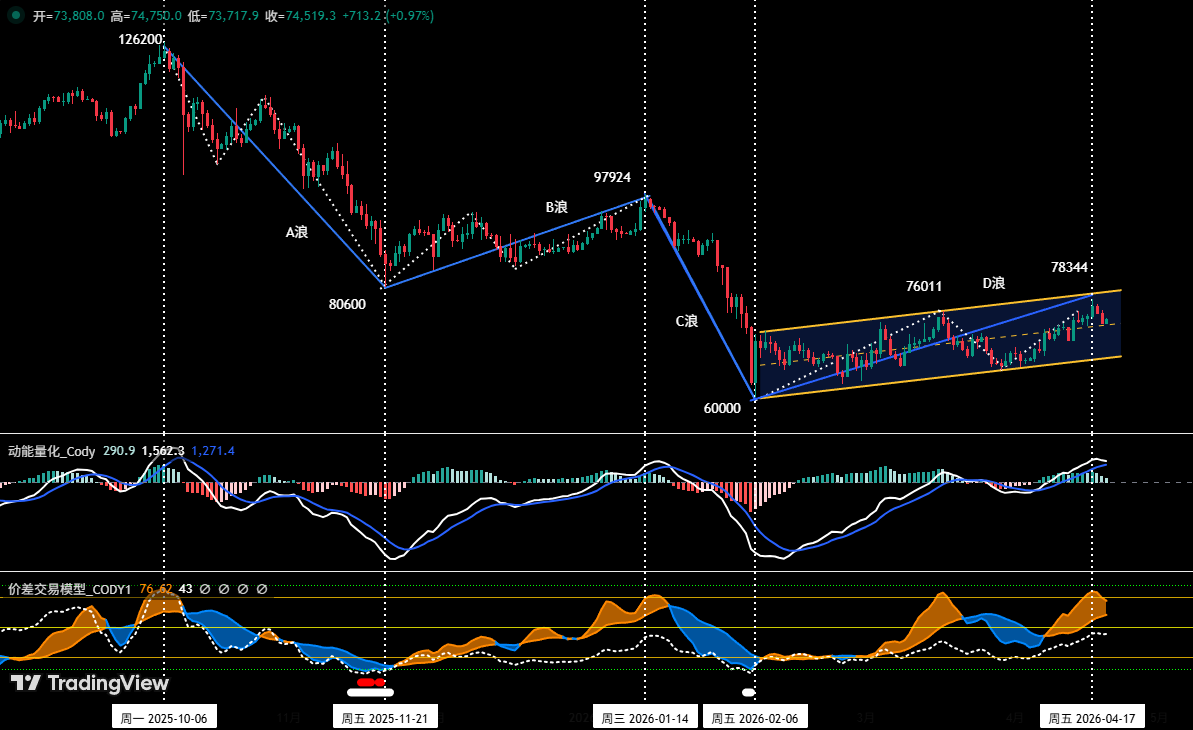
Рисунок 2
Как показано на (Рисунке 2), поскольку отскок Биткоина, начавшийся от минимума 60 000 долларов 6 февраля, не только установил новый максимум отскока на уровне 78 333 доллара 17 апреля, но и по состоянию на 19 апреля длился около 73 торговых дней, его время и пространство значительно превысили ранее прогнозируемые рамки «отскока волны C-2 внутри корректирующей волны C» (например, продолжительность его отскока уже значительно превысила 54-дневный отскок волны B). Следовательно, исходя из принципов анализа волновой теории,原有框架可能需要调整. Мы больше склонны重新 определить этот восходящий行情, начавшийся с 60 000 долларов, как более крупный «отскок волны D», что больше соответствует客观ному факту текущего рынка, где время обменивается на пространство, а цикл отскока延长.
Конкретная разметка волн среднесрочной коррекции может быть оптимизирована следующим образом:
• Коррекция волны A (импульсное падение): Началась с максимума 126 200 долларов 6 октября 2025 года, закончилась на минимуме 80 600 долларов 21 ноября 2025 года, длилась около 46 дней, максимальное падение около 36%. Эта волна установила格局 среднесрочной коррекции.
• Отскок волны B (сложная коррекция): Начался с минимума 80 600 долларов 21 ноября 2025 года, закончился на максимуме 97 924 доллара 14 января 2026 года, длился около 54 дней, максимальный рост около 21,5%. Это была коррекция к падению волны A.
• Коррекция волны C (основная волна падения): Началась с максимума 97 924 доллара 14 января 2026 года, достигла минимума 60 000 долларов 6 февраля 2026 года стремительным падением, длилась около 22 дней, максимальное падение около 38,7%. Эта волна завершила основную пространственную часть коррекции.
• Отскок волны D (текущий / возможно на завершающей стадии): Начался с минимума 60 000 долларов 6 февраля 2026 года, по состоянию на 19 апреля длился около 73 дня, максимальный рост около 30,6% (с 60 000 до 78 333 долларов). Характеристики этого отскока: длительное время, сложная структура, и в настоящее время он сталкивается с испытанием ключевого временного окна и зоны ценового сопротивления (например, 79 000–80 600 долларов). Если волна D состоится, то после завершения отскока цены монеты可能последовать соответствующая ей коррекция «волны E».
2. BTC: Глубокий анализ структуры движения
Биткоин _4-часовой график:
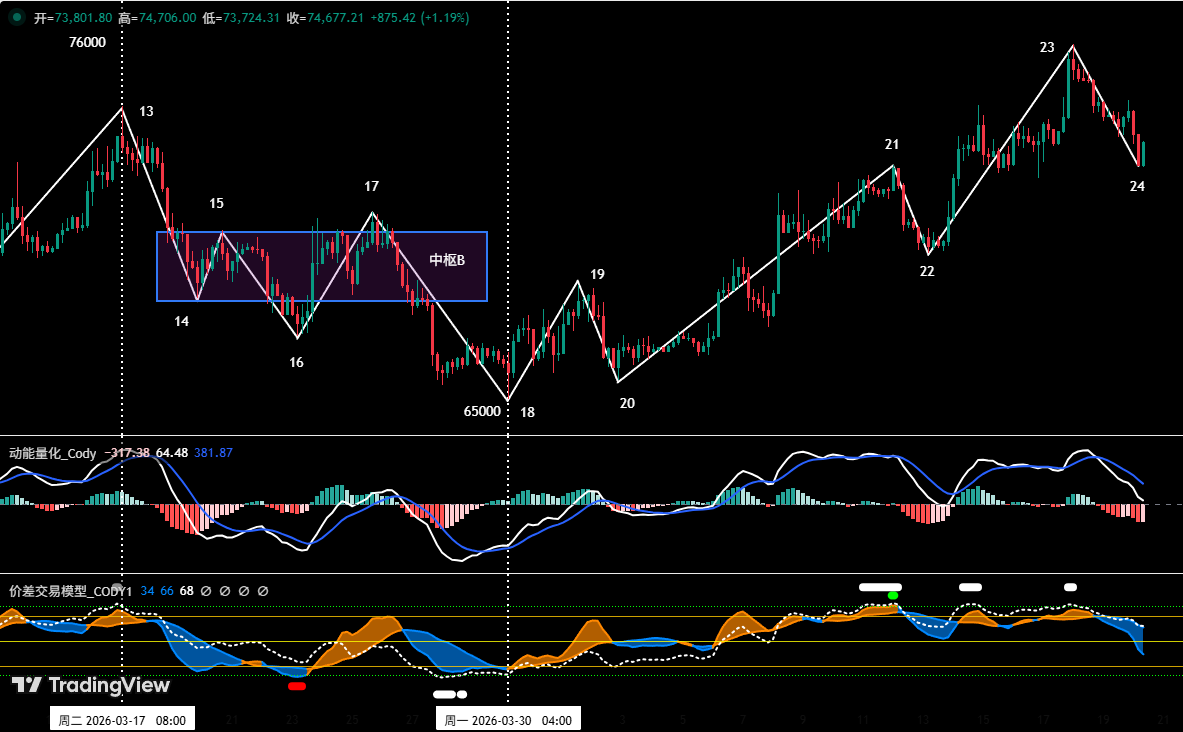
Рисунок 3
• На основе行情 после минимума 65 000 долларов 30 марта.
• Как показано на (Рисунке 3), BTC начал колебательное восходящее движение с минимума 30 марта. От точки 18 до точки 24 состоит из 6-сегментной структуры: 18-19, 19-20, 20-21, 21-22, 22-23, 23-24.
• На графике видно: от точки 18 до точки 23行情 уже отработала достаточно четкую 5-волновую структуру отскока, в настоящее время работает сегмент 23-24. С точки зрения нашей собственной модели торговли по спреду, в последнее время постоянно выдаются сигналы предупреждения о вершине (зеленые и белые точки на графике), что означает, что технические индикаторы находятся в состоянии серьезного перекупленности, и рынок имеет краткосрочную потребность в корректировочной волатильности.
四、Прогноз по Биткоину на неделю и операционная стратегия
1. Прогноз движения BTC на неделю:
• Ключевая точка зрения на неделю:
В настоящее время сохраняется волатильность в диапазоне 73 500 ~ 79 000 долларов, следите за борьбой быков и медведей вблизи верхней и нижней границ этого диапазона. Если отскок пробьет верхнюю границу, рынок будет колебаться в восходящем тренде, но пространство ограничено; если эффективно пробита нижняя граница, цена монеты может further снизиться к ключевой поддержке near 69 500 долларов.
2. Ключевые уровни сопротивления:
• Первая зона сопротивления: регион 79 000 ~ 80 600 долларов (near минимума ноября 2025 года)
• Вторая зона сопротивления: регион 83 500 ~ 84 500 долларов (регион плотных сделок多空筹码)
3. Ключевые уровни поддержки:
• Первая поддержка: near 73 500 долларов (предыдущий важный уровень поддержки)
• Вторая поддержка: near 69 500 долларов (предыдущий важный уровень поддержки)
• Третья поддержка: регион 65 000 ~ 66 000 долларов (near нижней границы диапазона волатильности)
4. Операционная стратегия на неделю (исключая влияние внезапных новостей):(20.04~26.04)
1. Среднесрочная стратегия:
Биткоин _ Дневной график:(Модель мониторинга позиций)
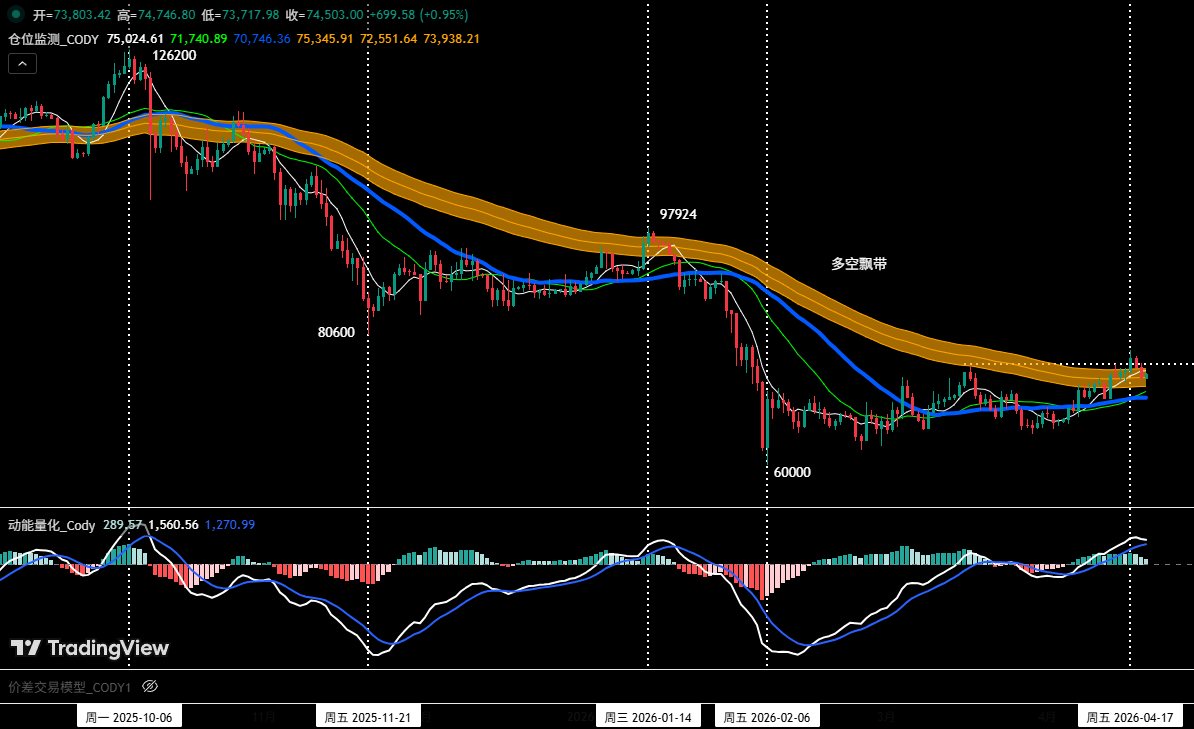
Рисунок 4
Модель мониторинга позиций: Как показано на (Рисунке 4), в настоящее время цена монеты колеблется near多空 ленты. Мы, следуя правилам стратегии, временно удерживаем 60% короткой позиции, открытой на уровне 89 000 долларов (28 января).
• Если на этой неделе отскок цены эффективно закрепится выше多空 ленты, все среднесрочные позиции будут обнулены.
2. Краткосрочная стратегия: Использовать 30% капитала, установить стоп-лосс, искать возможности для совершения «спреда» на основе уровней поддержки и сопротивления. (Использовать 30-минутный/60-минутный таймфреймы в качестве операционного периода).
3. Основываясь на прогнозе среднесрочного медвежьего тренда, в настоящее время следует придерживаться операционного принципа «Следование тренду, продажа на повышении». Для динамичного应对 сложной эволюции рынка и в сочетании с сигналами, выдаваемыми собственной торговой моделью, мы拟定A/B два套краткосрочных操作预案:
• Вариант А:Отскок встречает сопротивление, продажа на повышении.
• Открытие позиции: Когда цена монеты отскакивает до региона 76 500 ~ 79 000 долларов, triggered сигнал встречи сопротивления в сочетании с сигналом вершины модели, можно建立 30% короткой позиции.
• Управление рисками: Начальный стоп-лосс устанавливается выше 80 600 долларов.
• Закрытие позиции: Когда цена монеты падает near важного уровня поддержки в сочетании с сигналами модели, можно постепенно закрывать позицию с прибылью.
• Вариант B: Следование за пробоем, короткая позиция.
• Открытие позиции: Цена монеты продолжает корректироваться, когда цена эффективно пробивает поддержку near 73 500 долларов в сочетании с сигналом вершины модели, можно顺势建立 30% короткой позиции.
• Управление рисками: Начальный стоп-лосс устанавливается выше 74 500 долларов.
• Закрытие позиции: При падении до уровня поддержки в сочетании с сигналами модели, можно постепенно закрывать позицию с прибылью.
五、HYPE: Разбор операций
1. Обзор краткосрочных операций:(см. Таблицу 1)
Мы строго следовали операционному预案, на основе сигналов交易, выдаваемых самостоятельно построенной моделью торговли по спреду и моделью количественной оценки импульса, на прошлой неделе совершили одну краткосрочную (длинную) операцию, совокупная торговая прибыль составила 6,80%.
2. Сводка деталей краткосрочных сделок HYPE:(Плечо*1x)
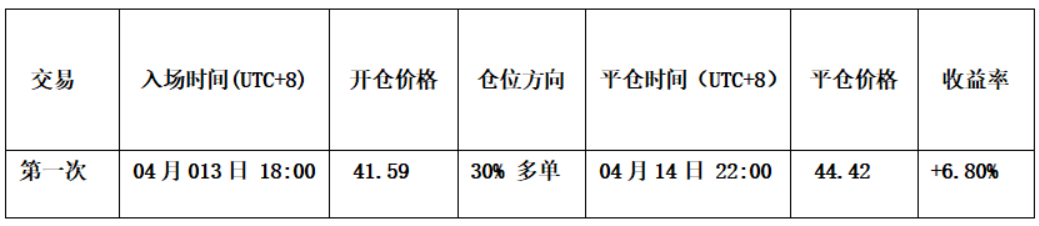
Таблица 1
3. Разбор краткосрочной交易:(см. Рисунок 5)
• Стратегия открытия позиции: Во-первых, на основе суждения о восходящем тренде волны V рынка; во-вторых, модель торговли по спреду уже заранее выдала сигнал предупреждения о дне (хорошие точки на графике); в-третьих, две линии импульса в модели импульса синхронно переместились выше нулевой оси, и две модели issued резонансный восходящий сигнал. Мы建立 30% длинной позиции на уровне 41,59 доллара.
• Стратегия закрытия позиции: Когда цена выросла до около 45 долларов и встретила сопротивление, одновременно модель торговли по спреду triggered сильный сигнал предупреждения о вершине (зеленая точка + белая точка), поэтому мы закрыли всю позицию на уровне около 44,42 доллара.
• Итог: Эта交易 успешна, прибыль составила about 6,80%.
График HYPE_60 минут:(Модель количественной оценки импульса + Модель торговли по спреду)
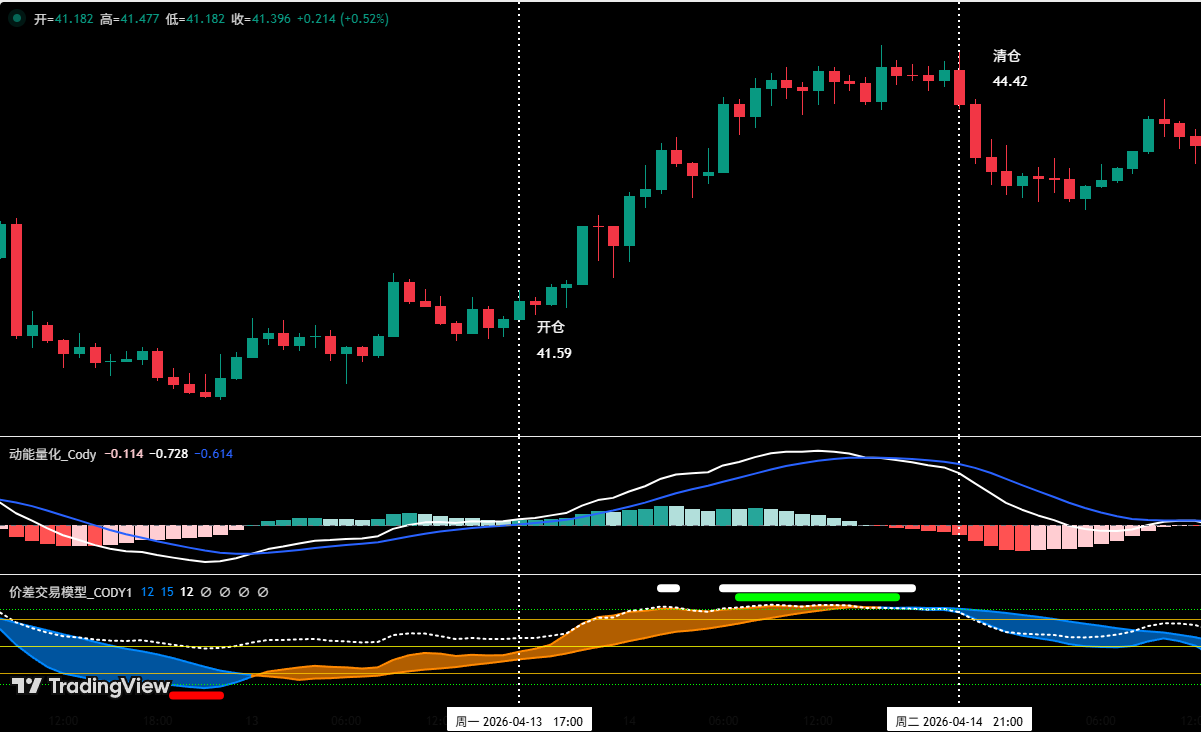
Рисунок 5(图示краткосрочной交易)
六、Особое примечание:
1. При открытии позиции: Немедленно установите начальный стоп-лосс.
2. При достижении прибыли 1%: Переместите стоп-лосс на цену открытия позиции (точка безубыточности), чтобы обеспечить безопасность本金.
3. При достижении прибыли 2%: Переместите стоп-лосс на позицию с прибылью 1%.
4. Постоянное отслеживание: После этого, с каждым дополнительным увеличением прибыли на 1%, стоп-лосс同步移动 на 1%, динамически защищая и фиксируя прибыль.
Финансовые рынки瞬息万变, все分析行情 и торговые стратегии требуют динамической корректировки. Все мнения, аналитические модели и операционные стратегии,涉及 в данной статье, основаны на личном техническом анализе и предназначены только для личного использования в качестве торгового журнала, не构成任何投资建议或操作依据. Рынок有风险, инвестиции需谨慎, пожалуйста, не принимайте решения на основе этого.


