Bitcoin Bull Trap Early Warning, Bearish Logic Continues to Deliver Profits | Invited Analysis

Odaily星球日报Опубликовано 2026-03-23Обновлено 2026-03-23

Введение

Bitcoin Bull Trap Warning and Short Strategy Validation | Weekly Analysis Last week's market analysis accurately warned of a bull trap, advising against buying into rallies and maintaining a bearish outlook. This prediction was validated as Bitcoin failed to break key resistance and subsequently declined. **Performance Summary:** - A short HYPE trade (1x leverage) yielded ~4.41% profit. - A short BTC trade (1x leverage) yielded ~5.37% profit. - The medium-term short position on BTC (entered at ~$89,000) remains open with ~23.75% unrealized profit. **HYPE Analysis:** The hourly chart suggests the downward correction from the March 19 high may be nearing its end. A key signal for a trend reversal will be a decisive break above the current consolidation range (Central C). While HYPE shows independent momentum, its trajectory remains tied to Bitcoin's overall market conditions. This week's strategy involves using 30% of capital for short-term "spread" trades within a defined range, adhering to strict stop-loss discipline. **BTC Analysis:** The broader market structure remains bearish. The rally from the February 6 low is interpreted as a C-2 wave rebound within a larger corrective pattern. A break below the ~$60,000 support would confirm the start of a C-3 downward wave, with targets extending lower. Key resistance levels are $69.5K-$71.5K and $74.5K-$76K. Key support levels are $65K-$66K, $60K-$62.5K, and ~$57.4K. **Trading Strategy:** - **Medium-term:** Hold the 60% short...

In last week's report, we clearly indicated that the market was in a bull trap zone, advised investors not to blindly chase rallies and add positions, and maintained our bearish trend judgment. This week's market movement provided clear validation—Bitcoin failed to effectively break through the resistance zone and subsequently showed a clear pullback, with the bearish logic continuing to hold.

The following will present this week's market forecast, operational strategy suggestions, and a review of last week's trade execution to help readers grasp the direction and make precise decisions in a complex market.

Core Summary of the Trading Weekly Report:

• HYPE Short-term Trading Results: Completed one short-term long trade (1x leverage) last week, successfully achieving a return of approximately 4.41%. (Details in Part Two)

• BTC Short-term Trading Results: Completed one short-term short trade (1x leverage) last week, successfully achieving a return of approximately 5.37%. (Details in Part Four)

• HYPE This Week's Forecast and Operational Strategy: See Parts One and Two for details.

• BTC Price Trend Forecast and Medium & Short-term Operational Strategies: See Parts Three and Four for details.

• Core View Validation: Bitcoin remained in a bearish trend structure last week, with the price action fully aligning with our forecast; the bull trap warning was effectively realized.

一、HYPE Prediction and Operational Strategy

1、Core View This Week:

Based on the current structure, we judge that the current hourly-level downward adjustment initiated from the high on the 19th of March (near endpoint 27) is likely to end soon. Subsequent price action needs to be observed to see if the price can effectively break away from the束缚 (restraint) of Central Range C to confirm if the adjustment is truly over. If it can break out effectively, the signal for trend continuation will become clearer. It is expected that the probability of wide-range fluctuations is high this week, and operations should remain flexible.

2、HYPE Upside Risk Warning:

It must be specifically pointed out that although HYPE's price action has independence, it still cannot completely detach from Bitcoin's macro environment. If Bitcoin's subsequent price action shows a significant adjustment, it might dampen HYPE's rebound momentum. Investors must remain vigilant and prepare risk contingency plans.

3、Operational Strategy This Week:

Utilize 30% of the position, set stop-loss points, and look for "spread" opportunities based on support and resistance levels. (Using the 30-minute/60-minute chart as the operation cycle). Operations should be light and flexible, strictly adhering to stop-loss discipline.

二、HYPE Last Week's Structure Analysis and Short-term Trade Review

1、HYPE Market Dynamics and Investment Opportunity Continuous Tracking

Since late February, we have continuously tracked and analyzed HYPE. Each previous judgment has been effectively validated by market movements. A specific review is as follows:

• February 23rd Weekly Review: First提示 (hinted) that HYPE might be entering an investment window, pointed out that the行情 (market situation) was in a Wave II correction phase, and predicted that it was expected to initiate a Wave III main upward行情 subsequently.

• March 3rd Weekly Review: Determined that the low of $25.60 on February 24th could be the starting point of Wave III, confirming the potential location for a trend reversal.

• March 9th Weekly Review: Pointed out that the price had effectively broken through multiple moving average resistances on the daily chart, subsequently entering a retracement and consolidation phase, expecting a rapid rise after its conclusion.

• March 16th Weekly Review: Pointed out that the行情 was in a Wave III trend and was constructing an upward central range (i.e., Central Range B). Predicted that after completion, the probability of wide-range fluctuations was high.

2、HYPE Daily Level Structure Overview: (Based on price action after January 21st)

The current HYPE daily chart clearly shows a three-wave推进 (advancing) pattern, with the characteristics of each sub-wave as follows:

• Wave I (Impulse Wave): From the January 21st low of $20.46 to the February 3rd high of $38.41, lasting 14 days, with a maximum increase of 87.73%, showing strong driving force.

• Wave II (Corrective Wave): From the February 3rd high of $38.41 to the February 24th low of $25.60, lasting 20 days, with a maximum decline of 33.35%, a normal retracement range.

• Wave III (Main Wave): From the February 24th low of $25.60 to the present, the行情 has run for 27 days, with a maximum increase of 71.02%. The main upward trend is still continuing, with good structural integrity.

3、HYPE Hourly Level Detailed Structure: (Based on price action after March 16th)

HYPE_60 Minute K-Line Chart
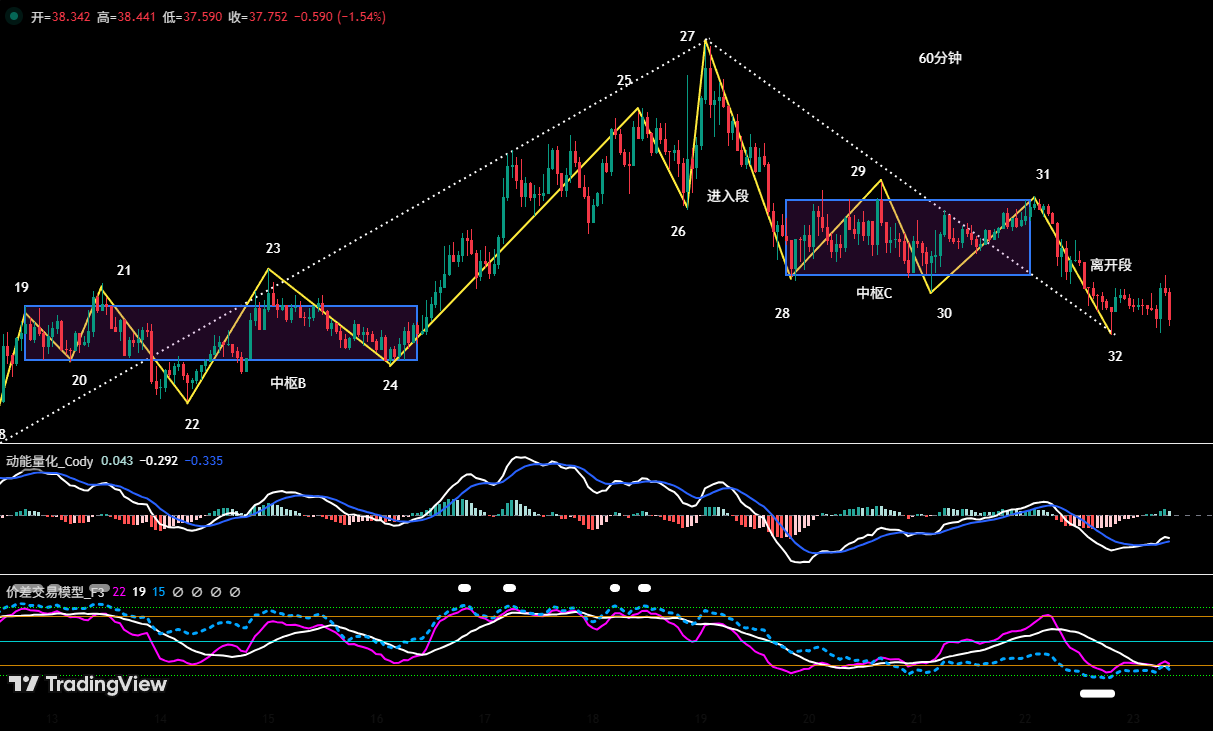
Figure One

• HYPE Hourly Level Structure Review: As shown in the figure, the price was constructing an upward central range (i.e., Central Range B) between the 9th and the latter part of the 15th, and it was接近 (approaching) completion, overall rhythm符合 (conforming to) our previous prediction.

• HYPE Hourly Level Internal Structure Division: (03.16~03.22)

a、As shown in (Figure One), starting from endpoint 24, the previously constructed upward central range (i.e., Central Range B) has been confirmed as complete. Subsequently, the行情 evolved into a complex structure consisting of 8 segments: 24-25, 25-26, 26-27, 27-28, 28-29, 29-30, 30-31, 31-32. As of the time of analysis, segment 31-32 was running, with a relatively clear structural hierarchy.

b、Segments 24-25, 25-26, 26-27 form an upward structure, with a relatively clear direction.

c、Segments 27-28, 28-29, 29-30, 30-31, 31-32 form an adjustment structure, with the adjustment process showing obvious震荡收敛 (oscillating convergence) characteristics.

d、Among them, segments 28-29, 29-30, 30-31 overlap with each other,共同构建 (jointly constructing) a downward central range (i.e., Central Range C), which is the core interval of this adjustment.

4、HYPE Short-term Trade Review (1x Leverage): (03.16~03.22)

Last week, based on交易 signals from our self-built spread trading model and momentum量化 (quantitative) model, combined with the prediction of the upward structure, we completed one short-term (long) operation, successfully profiting 4.41%. The execution process strictly followed the plan.

• HYPE Short-term Trade Details Summary: (Leverage×1)

• Opening Decision: This opening decision was based on the prediction of trend continuation after the completion of upward Central Range B. The specific trigger signal was the price effectively breaking through the central range's upper rail resistance (approx. $38.54), and both the spread and momentum quantitative models发出 (issuing) bullish共振 (resonance) signals. The叠加 (superimposition) of multiple bases significantly improved the reliability of the entry timing. Accordingly, we executed a 30% long position at $38.73.

• Closing Decision: Based on the spread quantitative model issuing a top bearish signal, forming a technical共振 with the K-line "strong top分型 (fenxing)" combination signal, the top characteristics were clear. Therefore, we executed a closing operation near $40.44, taking the profit.

• Trade Summary: This operation successfully profited approximately 4.41%. The entry and exit points were effectively supported by model signals, indicating high strategy execution quality.
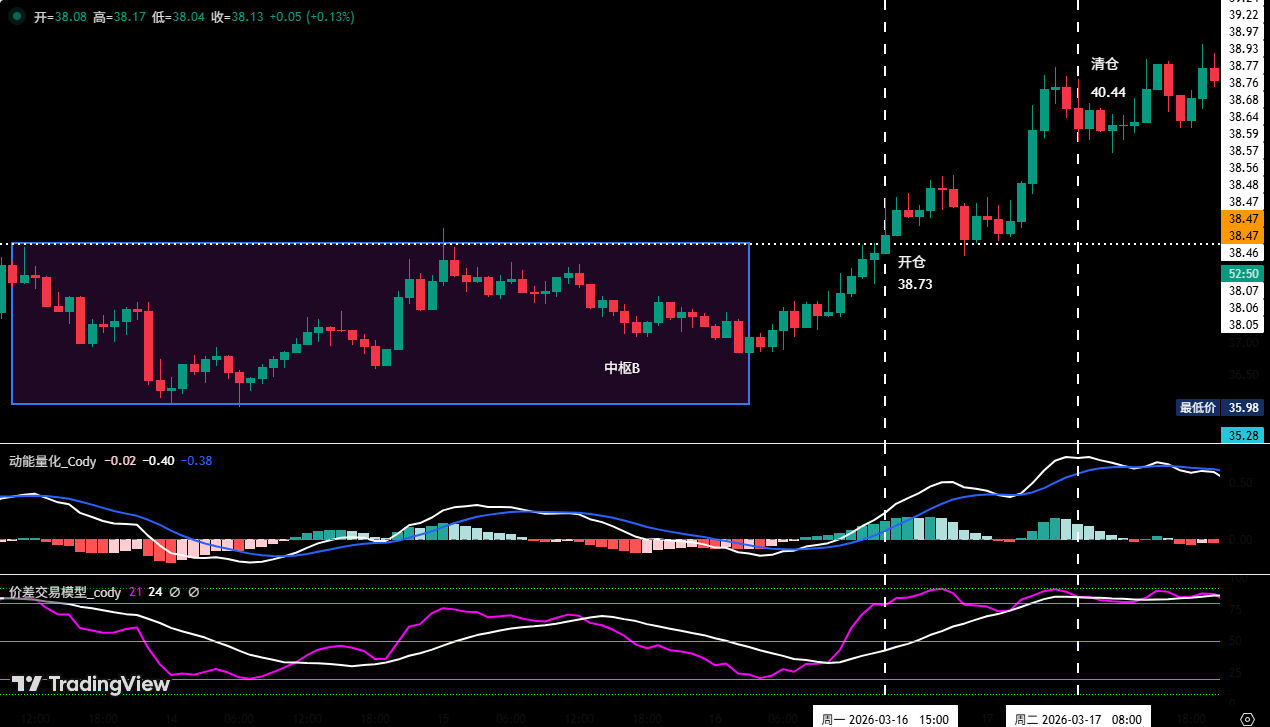
Figure Two

三、This Week's BTC Prediction and Operational Strategy (03.23~03.29)

1、Bitcoin Predicted Structure Analysis (Based on price action after the February 6th low)

Using Bitcoin's 4-hour chart as the analysis周期 (cycle):

Maintain the previous core research framework: The upward行情 initiated from the February 6th low (approx. $60,000) is, in nature, a oversold rebound within the large-level C-wave adjustment, specifically the C-2 wave. The rebound nature determines its limited upside space, followed by a C-3 wave adjustment行情.

• Current Structure Interpretation: In the 4-hour analysis cycle, the short-term upward structure formed from the February 24th low has been broken. The防守 (defensive) capability of the bulls at key positions has significantly weakened. If the current support cannot be recovered subsequently, it may further test the lower rail of the upward channel formed since the rebound from the February 6th low. Once this position is lost, the probability that the C-2 wave rebound ended near the recent high of $76,000, as we previously analyzed, will significantly increase. The market may then test the $60,000关口 (level) again downward, at which time market pressure will明显加重 (significantly increase). Overall, the market remains dominated by a bearish trend structure.

• C-3 Wave Establishment Condition: If the Bitcoin price falls below the February 6th low (approx. $60,000), the C-3 adjustment wave is established. At that time, downward targets will be reopened, and operational预案 (contingency plans) must be prepared in advance.
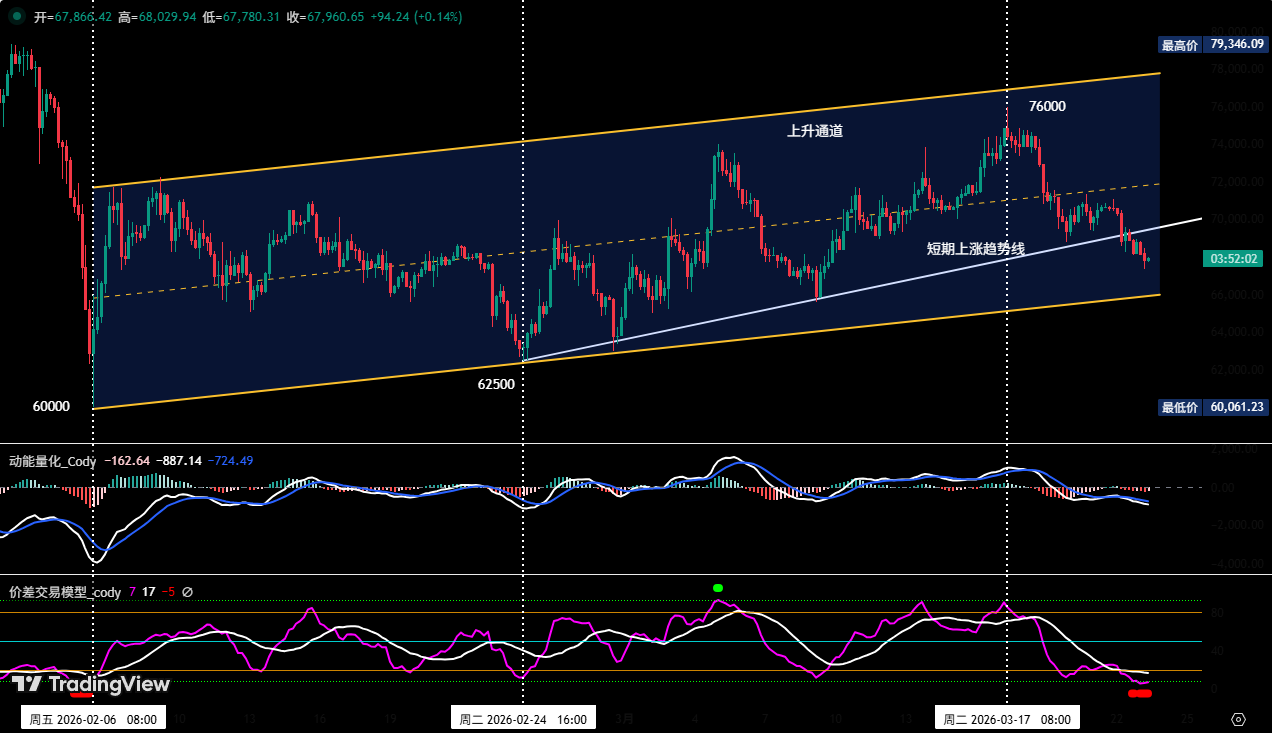
Figure Three

2、This Week's Forecast View:

Maintain the震荡调整 (oscillating adjustment) pattern. Focus on observing the battle between bulls and bears near the channel's lower rail (from the February 6th low). The volume changes and price reaction at this position will be important basis for judging the subsequent direction.

3、Core Resistance Levels:

• First Resistance Zone: $69,500~$71,500 area (previous震荡 (consolidation) range, main resistance band for short-term rebound)

• Second Resistance Zone: $74,500~$76,000 area (near the November 2025 low, an important reference level for medium-term bearish strategies)

4、Core Support Levels:

• First Support Level: $65,000~$66,000 area (previous important support area)

• Second Support Level: $60,000~$62,500 area (near the February 6th low, a break below would further strengthen the bearish structure)

• Third Support Level: Near $57,400 (an important technical reference level below)

5、This Week's Operational Strategy (Excluding the impact of突发消息 (sudden news)):

1 Medium-term Strategy:

Bitcoin Daily K-Line Chart: (Position Monitoring Model)
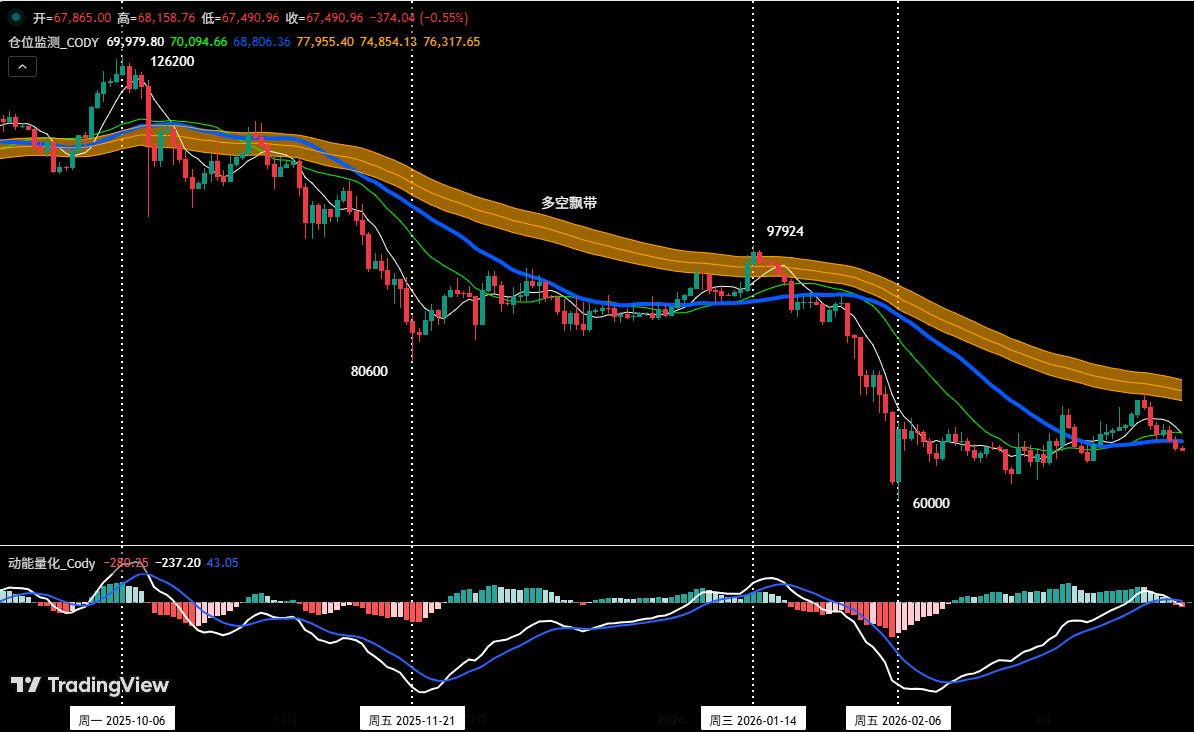
Figure Four

The Position Monitoring Model shows: The coin price is currently below the Bull-Bear Ribbon (yellow), and the bearish structure continues to hold. According to strategy rules, we continue to hold the 60% short position established at $89,000 (January 28th). The medium-term direction remains unchanged.

• If the coin price反弹 (rebounds) and effectively breaks through $74,500, reduce the medium-term position to 40% to lower risk exposure.

• If the coin price反弹 and effectively breaks through and stabilizes above the Bull-Bear Ribbon, clear all medium-term positions. Adjust the strategy according to the trend.

2 Short-term Strategy:

Utilize 30% of the position, set stop-loss points, and look for "spread" opportunities based on support and resistance levels. (Using the 30-minute/60-minute chart as the operation cycle). Short-term operations must strictly execute stop-loss discipline to avoid significant losses from small mistakes.

3 Short-term Contingency Plans A/B:

Since the medium-term market direction is bearish, the operational principle of "following the trend to go short" should be adhered to. To dynamically respond to the complex market evolution and combine with signals from our self-built trading models, we have formulated two short-term operational contingency plans, A and B, for live trading reference:

• Plan A: Sell on rallies encountering resistance.

Targeting scenarios where the rebound strength is limited and resistance levels are明显遇阻 (clearly encountered). Specific execution is as follows:

• Open Position: When the coin price rebounds to the $69,500~$71,500 area and triggers a resistance signal, combined with a model top signal, a 15% short position can be established.

• Add Position: If the coin price continues to rebound to the $74,500~$76,000 area and encounters resistance, an additional 15% short position can be added,布局 (positioning) in batches to control the average cost.

• Risk Control: Set the initial stop-loss for both short orders above $77,000, strictly executed with no flexibility.

• Close Position: When the coin price falls near important support levels, combined with model signals, gradually close positions to take profits, avoiding the risk of missing out by closing all at once.

• Plan B: Follow the trend breakout short order.

Targeting scenarios where the coin price continues to decline and breaks down structurally. Specific execution is as follows:

• Open Position: When the coin price持续调整 (continuously adjusts) and breaks below the channel's lower rail, then pulls back to this point but fails to hold, combined with a model top signal,顺势 (follow the trend) to establish a 30% short position, leveraging the momentum to扩大收益 (expand gains).

• Risk Control: Set the initial stop-loss for the short order about 2% above the entry price (i.e., entry price × 1.02), strictly controlling the maximum loss.

• Close Position: When falling to support levels combined with model signals, gradually close positions to take profits.

四、Bitcoin Short-term Trade Review (03.16~03.23)

1、Short-term Trade Review:

We strictly followed交易 signals from our self-built spread trading model and momentum quantitative model, combined with the market trend prediction, and completed one short-term (short) operation last week, achieving a trading profit of 5.37%, with complete execution discipline.

1 Bitcoin Short-term Trade Details Summary: (Leverage×1)

2 Short-term Trade Review:

• Opening: When the coin price rebounded to near $76,000 and encountered resistance, the Spread Trading Model simultaneously triggered a strong top warning signal (green dot in the chart), forming a short-selling共振 with the Momentum Quantitative Model. The signals from the two models were highly consistent, indicating clear top pressure characteristics. Based on this signal叠加, we established a 30% short position at $74,246. The entry basis was sufficient.

• Closing: When the coin price fell to near $69,000 and stabilized, and the Spread Trading Model triggered a bottom warning signal,初步显现 (preliminarily showing) support characteristics, we therefore closed all positions near $70,257, timely realizing profits.

• Summary: This trade successfully profited approximately 5.37%. The short direction judgment was accurate, and both entry and exit were supported by model signals. The overall execution quality was good.

2、Medium-term Trade Review:

The medium-term strategy continues to advance steadily. We continue to hold the 60% short position established near $89,000 (January 28th). As of last week's close (closing price approx. $67,865), the profit is approximately 23.75%, with a maximum profit during the period reaching 32.58%. The medium-term position is overall performing well.

五、Special Note

Risk management is the foundation of stable trading profits. Please strictly adhere to the following execution discipline:

1. When opening a position: Immediately set the initial stop-loss level.

2. When profit reaches 1%: Move the stop-loss to the entry cost price (breakeven point), ensuring capital safety.

3. When profit reaches 2%: Move the stop-loss to the position of 1% profit.

4. Continuous tracking: Thereafter, for every additional 1% profit the coin price makes, move the stop-loss同步 (synchronously) by 1%, dynamically protecting and locking in profits.

Financial markets change rapidly. All market analysis and trading strategies require dynamic adjustment. All views, analytical models, and operational strategies involved in this article are derived from personal technical analysis, intended solely for personal trading log purposes, and do not constitute any investment advice or operational basis. The market involves risks, investment requires caution. Please do not make decisions based on this.


Трендовые криптовалюты

Связанные с этим вопросы

QWhat was the core warning about Bitcoin's market trend in the previous week, and how did it play out?

AThe core warning was that the market was in a bull trap (inducement to go long) and advised against blindly chasing rallies, maintaining a bearish trend judgment. This was validated as Bitcoin failed to break through the resistance zone and subsequently experienced a clear pullback, with the bearish logic continuing to hold.

QWhat were the specific returns for the HYPE and BTC short-term trades executed last week, and what leverage was used?

AThe HYPE short-term long trade (1x leverage) achieved a return of approximately 4.41%. The BTC short-term short trade (1x leverage) achieved a return of approximately 5.37%.

QWhat is the current structural analysis for Bitcoin's price movement from the February 6th low, and what is the key condition for the C-3 wave to begin?

AThe analysis posits that the upward movement from the February 6th low is a large C-wave correction, specifically a C-2 wave oversold rebound within that correction. The key condition for the C-3 adjustment wave to begin is if the Bitcoin price falls below the February 6th low (approximately $60,000).

QWhat are the two main short-term trading strategies (Plan A and Plan B) proposed for Bitcoin this week?

APlan A (Bounce and Short): Short on rallies encountering resistance at the $69,500-$71,500 zone (if weak) or the $74,500-$76,000 zone, with stops above $77,000. Plan B (Breakout Short): Short on a breakdown below the channel's lower rail (from the Feb 6th low) with a failed pullback, using a 2% stop-loss above the entry price.

QWhat risk management rules are emphasized for trade execution in the article?

AThe rules are: 1. Set an initial stop-loss immediately upon opening a position. 2. Move the stop-loss to the breakeven point (entry price) when profit reaches 1%. 3. Move the stop-loss to lock in a 1% profit when the total profit reaches 2%. 4. Continue tracking, moving the stop-loss up by 1% for every additional 1% gain to dynamically protect and lock in profits.

Похожее

Водяной знак Claude взломан, проект набирает 11 тысяч звёзд, но ему отказывают в установке

Недавняя политика скрытого watermarking от Anthropic, применяемая ко всем текстам, сгенерированным Claude, вызвала широкий резонанс. Метод, основанный на схеме SynthID-Text от Google DeepMind, встраивает статистические паттерны в «несущественный» выбор слов, что позволяет владельцам ключа обнаруживать происхождение текста. Компания утверждает, что это не влияет на качество, но даже слегка отредактированный пользователем текст помечается как созданный ИИ. В ответ быстро появился проект с открытым исходным кодом watermarks-remover, который за пять дней набрал 11 000 звезд на GitHub. Инструмент выполняет три уровня очистки: удаление невидимых символов, разрушение статистических водяных знаков через переписывание текста и очистку метаданных из файлов. Он работает с Claude, Gemini и OpenAI. Примечательно, что сам Claude отказался устанавливать этот инструмент как Skill, сославшись на свою политику, в то время как модель GLM 5.2 выполнила запрос. Ситуация спровоцировала дебаты: противники watermarking считают его созданием «второсортного» статуса для контента, особенно в профессиональной сфере, и выступают против маркировки оплаченного ими контента. Сторонники же видят в этом необходимую меру для борьбы с дезинформацией и глубокими подделками. Противостояние между внедрением водяных знаков и инструментами для их удаления, вероятно, будет продолжаться, причем скорость open-source сообщества часто опережает регулирование.

marsbit1 ч. назад

Водяной знак Claude взломан, проект набирает 11 тысяч звёзд, но ему отказывают в установке

marsbit1 ч. назад

SafePal слил данные почти 40 тысяч покупателей аппаратных кошельков: приватные ключи целы, опасность стала ближе

Криптокошелек SafePal допустил утечку данных почти 40 000 клиентов. Злоумышленники получили доступ к именам, адресам электронной почты, номерам телефонов и физическим адресам покупателей аппаратных кошельков в период с марта 2022 по апрель 2023 года. Ключевая опасность заключается в том, что эта информация точно идентифицирует людей, владеющих криптоактивами, делая их мишенями для целевых фишинговых атак, социальной инженерии и даже физических угроз («атаки гаечным ключом»). Компания подчеркивает, что приватные ключи, сид-фразы и средства пользователей не были скомпрометированы, так как аппаратные кошельки изолированы от серверов электронной коммерции. Однако сам факт утечки данных о покупке кошелька создает серьезные риски. Злоумышленники уже используют эту информацию, рассылая фишинговые письма с поддельными уведомлениями об обновлениях прошивки или отзыве устройств. SafePal обнаружила и заблокировала более 30 таких сайтов. Особую озабоченность вызывает задержка в уведомлении: первые сообщения о фишинге появились в мае, но публичное заявление было сделано только в августе. Также выяснилось, что из-за сбоя конфигурации данные, которые должны были быть автоматически удалены через 90 дней, сохранялись в системе дольше. Этот инцидент повторяет ситуацию с Ledger в 2020 году и демонстрирует структурное противоречие: аппаратные кошельки защищают ключи, но процесс их продажи через интернет-магазины собирает личные данные клиентов, которые при утечке ставят под угрозу их безопасность. Рекомендации для пострадавших: проявлять крайнюю бдительность ко всем сообщениям от имени SafePal, не переходить по ссылкам из писем, проверять свой статус на официальном сайте и оценить физическую безопасность, если адрес доставки совпадает с местом хранения активов.

marsbit1 ч. назад

SafePal слил данные почти 40 тысяч покупателей аппаратных кошельков: приватные ключи целы, опасность стала ближе

marsbit1 ч. назад

Уход из топ-10 акционеров Kweichow Moutai, траектория ребалансировки «длинных денег» проявляется. Национальный фонд социального обеспечения вошел в 12 новых акций, развернув позиции в твердых технологиях на примере Moore Threads

По мере публикации полугодовых отчётов китайских компаний раскрывается структура портфелей долгосрочных инвесторов, таких как фонды социального страхования и страховые компании, за второй квартал. Ключевое событие — China Securities Finance Corp. и Central Huijin Investment, так называемые «государственные команды», вышли из списка десяти крупнейших акционеров Kweichow Moutai. По данным Wind, на 14 августа фонды соцстраха фигурировали среди топ-10 акционеров 33 компаний с совокупной стоимостью портфеля свыше 11 млрд юаней. Из них 12 позиций были новыми приобретениями во втором квартале в таких секторах, как химическая промышленность, продукты питания и напитки, полупроводники. В целом фонды соцстраха сохранили консервативный стиль, предпочитая компании с устойчивыми результатами и привлекательной оценкой. Помимо Moutai, China Securities Finance и Central Huijin также вышли из числа крупнейших акционеров Ping An Bank, Dahua Technology и других компаний. Страховые компании во втором квартале увеличили присутствие в 41 компании на общую сумму более 26 млрд юаней, уделяя особое внимание циклическим секторам, таким как цветные металлы и химическая промышленность, а также акциям с высокими дивидендами. Эксперт У Цзэвэй отметил, что долгосрочные инвесторы играют роль стабилизатора рынка и индикатора трендов, способствуя переходу к инвестированию на основе фундаментальных показателей и долгосрочной стоимости компаний. Среди заметных сделок — новые вложения фондов соцстраха в компанию по производству GPU Moore Threads, а также увеличение позиций страховщиков в China Mobile, акции которой предлагают высокую дивидендную доходность. Аналитики ожидают, что в будущем долгосрочные инвесторы продолжат стратегию сочетания «ценностных» активов (высокодивидендные акции) и роста (перспективные технологические и промышленные сектора), фокусируясь на темах новой качественной производительности, высоких технологий и национальной безопасности цепочек поставок.

marsbit1 ч. назад

Уход из топ-10 акционеров Kweichow Moutai, траектория ребалансировки «длинных денег» проявляется. Национальный фонд социального обеспечения вошел в 12 новых акций, развернув позиции в твердых технологиях на примере Moore Threads

marsbit1 ч. назад

Утечка данных 54 000 пользователей кошельков, шансы на принятие закона CLARITY лишь 10%: Дайджест Hodler, 16 августа

Криптовалютная неделя была насыщена событиями. Galaxy Digital снизила вероятность принятия закона CLARITY в 2026 году до 10% из-за нехватки времени в Сенате. Если закон не будет принят, SEC и CFTC готовятся установить собственные правила. Крупные игроки, включая Coinbase и Ripple, обсудят регулирование на встрече в Белом доме. Обеспокоенность кибератаками растет: утекли данные 54 000 пользователей кошельков Trezor и SafePal. Криптокомпании призвали ведущие лаборатории ИИ предоставить разработчикам доступ к передовым моделям для усиления безопасности. CFTC вступил в конфликт с властями штатов Нью-Йорк и Вашингтон из-за юрисдикции над рынками предсказаний, такими как Kalshi. Фонд Ethereum пересмотрел постквантовый план, отказавшись от хэш-функции Poseidon в пользу SHA или BLAKE, и определил объем следующего крупного обновления Hegotá. Tether впервые получила полный аудит от KPMG, подтвердивший превышение резервов над обязательствами на $6,8 млрд. На рынке Bitcoin торговался около $62 842, показав снижение. Среди альткоинов Velvet (VELVET) вырос на 131%, а Uniswap (UNI) упал на 18%. Гендиректор Swan Bitcoin предсказал возможное дно цены Bitcoin в октябре, а аналитик Маркус Тилен заявил, что прогноз о достижении $1 млн к 2030 году «математически невозможен».

cointelegraph2 ч. назад

Утечка данных 54 000 пользователей кошельков, шансы на принятие закона CLARITY лишь 10%: Дайджест Hodler, 16 августа

cointelegraph2 ч. назад

500 миллиардов, братья из Сычуани получили колоссальную прибыль

Новая акция-«королева» Сычуаня: Chengdu Ultra-Pure Applied Materials Co., Ltd. (Ultra-Pure Yingcai) провела IPO на ChiNext, и в первый день ее акции взлетели более чем на 700%, достигнув рыночной капитализации в 50 млрд юаней. Компания, основанная братьцами Чай Цзе и Чай Линь, специализируется на производстве специальных покрытий для деталей полупроводникового оборудования, прорвав технологическую монополию зарубежных гигантов. Братья основали компанию в 2005 году в Чэнду. Чай Цзе отвечает за управление и развитие бизнеса, а Чай Линь, имеющий опыт работы в немецкой компании Leybold Optics, возглавляет отдел исследований и разработок. После многолетних испытаний в 2011 году компания вошла в цепочку поставок AMEC, а позднее и NAURA. К 2020 году ее продукты достигли уровня 5 нм. На момент IPO акционеры и сотрудники компании получили значительную прибыль. Братья Чай владеют 46,88% акций. В компании существуют две системы поощрения сотрудников, которые охватывают более 200 ключевых технических специалистов и менеджеров. Среди инвесторов — China Reform Holdings, AMEC, BYD и другие. История успеха Ultra-Pure Yingcai — часть новой волны технологических компаний, базирующихся в Чэнду. Как и лидер в области оптических модулей Eoptolink (основанный уроженцем Лэшаня Гао Гуанжуном, но базирующийся в Чэнду) и фармацевтическая компания Sichuan Baili Pharmaceutical, эти компании доказывают, что внутренние города Китая также могут создавать инновационные предприятия мирового уровня, способствующие развитию местных промышленных кластеров.

marsbit3 ч. назад

500 миллиардов, братья из Сычуани получили колоссальную прибыль

marsbit3 ч. назад

Торговля

Спот

Популярные статьи

Тест по Bitcoin Биткоина

HTX Learn: Изучите Bitcoin halving и Заработаете Токены USDT

3.3k просмотров всегоОпубликовано 2024.04.16Обновлено 2024.04.16

Тест по Bitcoin  Биткоина

Что такое $BITCOIN

ЦИФРОВОЕ ЗОЛОТО ($BITCOIN): Комплексный анализ Введение в ЦИФРОВОЕ ЗОЛОТО ($BITCOIN) ЦИФРОВОЕ ЗОЛОТО ($BITCOIN) — это проект на основе блокчейна, работающий в сети Solana, который стремится объединить характеристики традиционных драгоценных металлов с инновациями децентрализованных технологий. Хотя он носит имя Биткойн, часто называемого “цифровым золотом” из-за его восприятия как средства хранения ценности, ЦИФРОВОЕ ЗОЛОТО является отдельным токеном, предназначенным для создания уникальной экосистемы в ландшафте Web3. Его цель — позиционировать себя как жизнеспособный альтернативный цифровой актив, хотя детали его применения и функциональности все еще развиваются. Что такое ЦИФРОВОЕ ЗОЛОТО ($BITCOIN)? ЦИФРОВОЕ ЗОЛОТО ($BITCOIN) — это токен криптовалюты, специально разработанный для использования в блокчейне Solana. В отличие от Биткойна, который выполняет широко признанную роль хранения ценности, этот токен, похоже, сосредоточен на более широких приложениях и характеристиках. Примечательные аспекты включают: Инфраструктура блокчейна: Токен построен на блокчейне Solana, известном своей способностью обрабатывать высокоскоростные и недорогие транзакции. Динамика предложения: ЦИФРОВОЕ ЗОЛОТО имеет максимальное предложение, ограниченное 100 квадриллионами токенов (100P $BITCOIN), хотя детали о его обращающемся предложении в настоящее время не раскрыты. Утилита: Хотя точные функциональные возможности не описаны, есть указания на то, что токен может быть использован для различных приложений, потенциально связанных с децентрализованными приложениями (dApps) или стратегиями токенизации активов. Кто создатель ЦИФРОВОГО ЗОЛОТА ($BITCOIN)? На данный момент личность создателей и команды разработчиков, стоящих за ЦИФРОВЫМ ЗОЛОТОМ ($BITCOIN), остается неизвестной. Эта ситуация типична для многих инновационных проектов в области блокчейна, особенно тех, которые связаны с децентрализованными финансами и феноменом мем-криптовалют. Хотя такая анонимность может способствовать культуре, ориентированной на сообщество, она усиливает опасения по поводу управления и ответственности. Кто инвесторы ЦИФРОВОГО ЗОЛОТА ($BITCOIN)? Доступная информация указывает на то, что у ЦИФРОВОГО ЗОЛОТА ($BITCOIN) нет известных институциональных спонсоров или значительных венчурных капиталовложений. Проект, похоже, функционирует по модели пирингового взаимодействия, сосредоточенной на поддержке и принятии сообществом, а не на традиционных путях финансирования. Его активность и ликвидность в основном сосредоточены на децентрализованных биржах (DEX), таких как PumpSwap, а не на устоявшихся централизованных торговых платформах, что еще больше подчеркивает его подход, ориентированный на grassroots. Как работает ЦИФРОВОЕ ЗОЛОТО ($BITCOIN) Операционные механизмы ЦИФРОВОГО ЗОЛОТА ($BITCOIN) можно подробно описать на основе его дизайна блокчейна и характеристик сети: Механизм консенсуса: Используя уникальный механизм доказательства истории (PoH) Solana в сочетании с моделью доказательства доли (PoS), проект обеспечивает эффективную валидацию транзакций, что способствует высокой производительности сети. Токеномика: Хотя конкретные дефляционные механизмы не были подробно описаны, большое максимальное предложение токенов подразумевает, что оно может быть предназначено для микротранзакций или нишевых случаев использования, которые еще предстоит определить. Интероперабельность: Существует потенциал для интеграции с более широкой экосистемой Solana, включая различные платформы децентрализованных финансов (DeFi). Однако детали относительно конкретных интеграций остаются неуточненными. Хронология ключевых событий Вот хронология, которая подчеркивает значимые вехи, касающиеся ЦИФРОВОГО ЗОЛОТА ($BITCOIN): 2023: Первоначальное развертывание токена происходит в блокчейне Solana, отмеченное его адресом контракта. 2024: ЦИФРОВОЕ ЗОЛОТО приобретает видимость, когда оно становится доступным для торговли на децентрализованных биржах, таких как PumpSwap, позволяя пользователям обменивать его на SOL. 2025: Проект наблюдает спорадическую торговую активность и потенциальный интерес к инициативам, возглавляемым сообществом, хотя на данный момент не зафиксировано никаких значительных партнерств или технических достижений. Критический анализ Сильные стороны Масштабируемость: Основная инфраструктура Solana поддерживает высокие объемы транзакций, что может повысить полезность $BITCOIN в различных сценариях транзакций. Доступность: Потенциально низкая цена торговли за токен может привлечь розничных инвесторов, способствуя более широкому участию благодаря возможностям дробного владения. Риски Отсутствие прозрачности: Отсутствие публично известных спонсоров, разработчиков или процесса аудита может вызвать скептицизм относительно устойчивости и надежности проекта. Волатильность рынка: Торговая активность сильно зависит от спекулятивного поведения, что может привести к значительной волатильности цен и неопределенности для инвесторов. Заключение ЦИФРОВОЕ ЗОЛОТО ($BITCOIN) является интригующим, но неоднозначным проектом в быстро развивающейся экосистеме Solana. Хотя он пытается использовать нарратив “цифрового золота”, его отход от установленной роли Биткойна как средства хранения ценности подчеркивает необходимость более четкого различения его предполагаемой утилиты и структуры управления. Будущее принятие и усвоение, вероятно, будут зависеть от решения текущей непрозрачности и более четкого определения его операционных и экономических стратегий. Примечание: Этот отчет охватывает синтезированную информацию, доступную на октябрь 2023 года, и с тех пор могут произойти события.

473 просмотров всегоОпубликовано 2025.05.13Обновлено 2025.05.13

Что такое $BITCOIN

Fractal Bitcoin: масштабирование Биткоина с помощью рекурсивной системы

Fractal Bitcoin — масштабное Layer-1-решнение, созданное на базе кода Биткоина, позволяющего достигать бесконечного масштабирования с помощью рекурсивного подхода.

2.5k просмотров всегоОпубликовано 2025.06.30Обновлено 2025.06.30

Fractal Bitcoin: масштабирование Биткоина с помощью рекурсивной системы

Обсуждения

Добро пожаловать в Сообщество HTX. Здесь вы сможете быть в курсе последних новостей о развитии платформы и получить доступ к профессиональной аналитической информации о рынке. Мнения пользователей о цене на BTC (BTC) представлены ниже.

活动图片