Оригинальный автор: Glassnode
Оригинальный перевод: AididiaoJP, Foresight News
Биткоин вернулся выше отметки 80 000 долларов, приток средств в ETF, спрос на спотовом рынке и позиции улучшились. Однако слабость притока капитала и значительное давление предложения в районе 86 000 долларов по-прежнему сохраняют веру рынка на более низком уровне по сравнению с предыдущими бычьими фазами.
Резюме
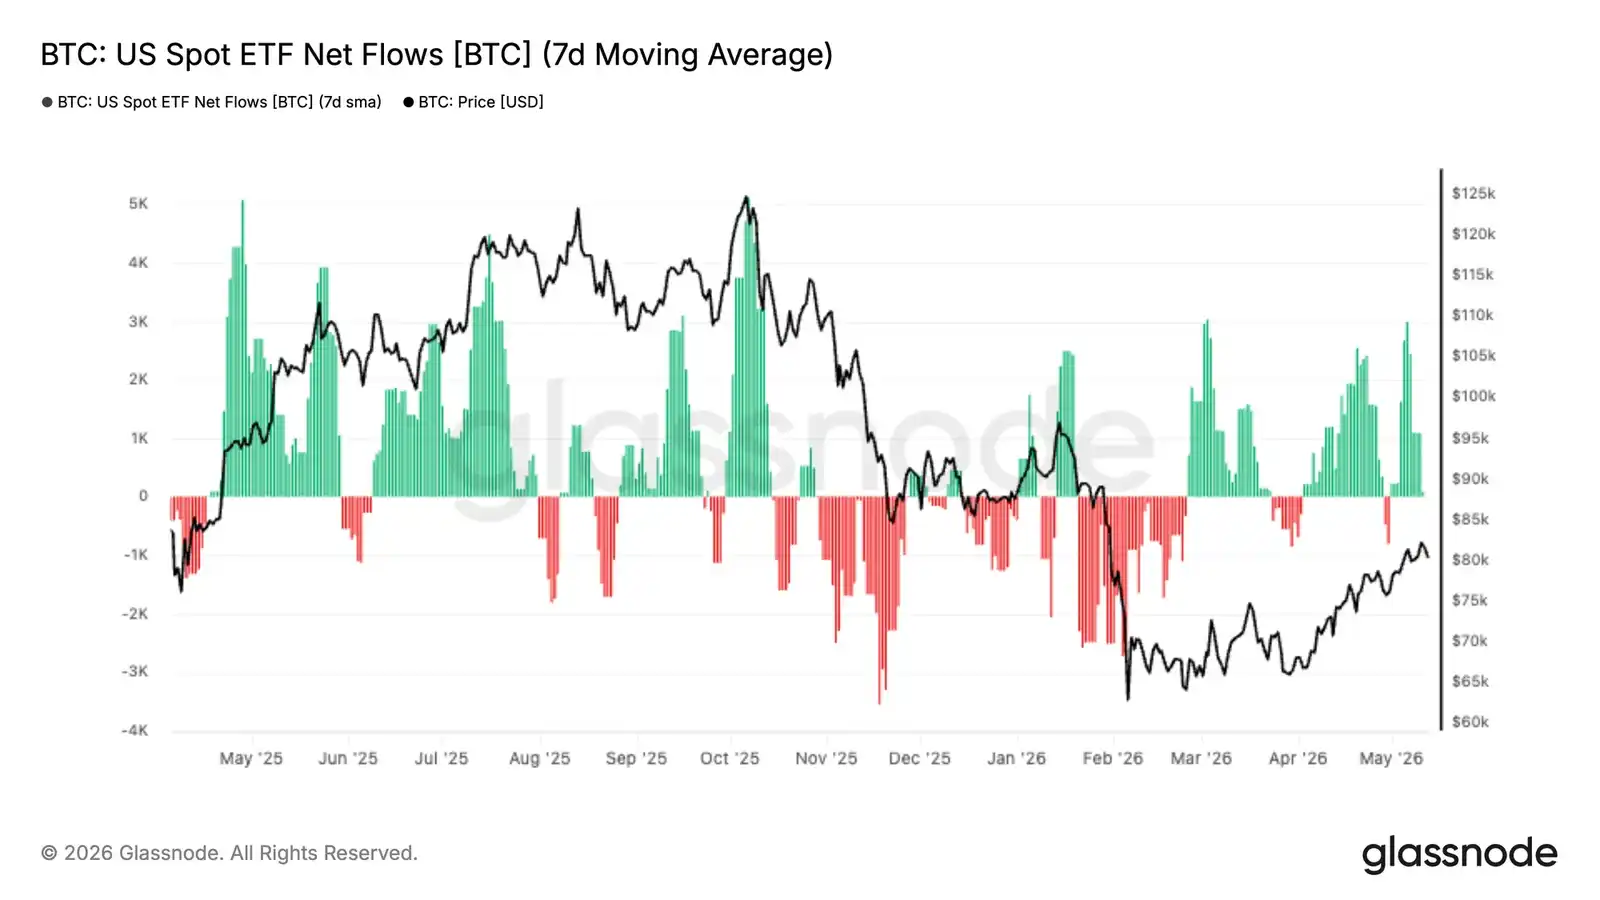
- Приток средств в американские спотовые биткоин-ETF вновь стал явно положительным, и по мере того, как биткоин восстановился с уровня в 60 000 долларов до нижней границы диапазона в 80 000 долларов, институциональный спрос возрождается.
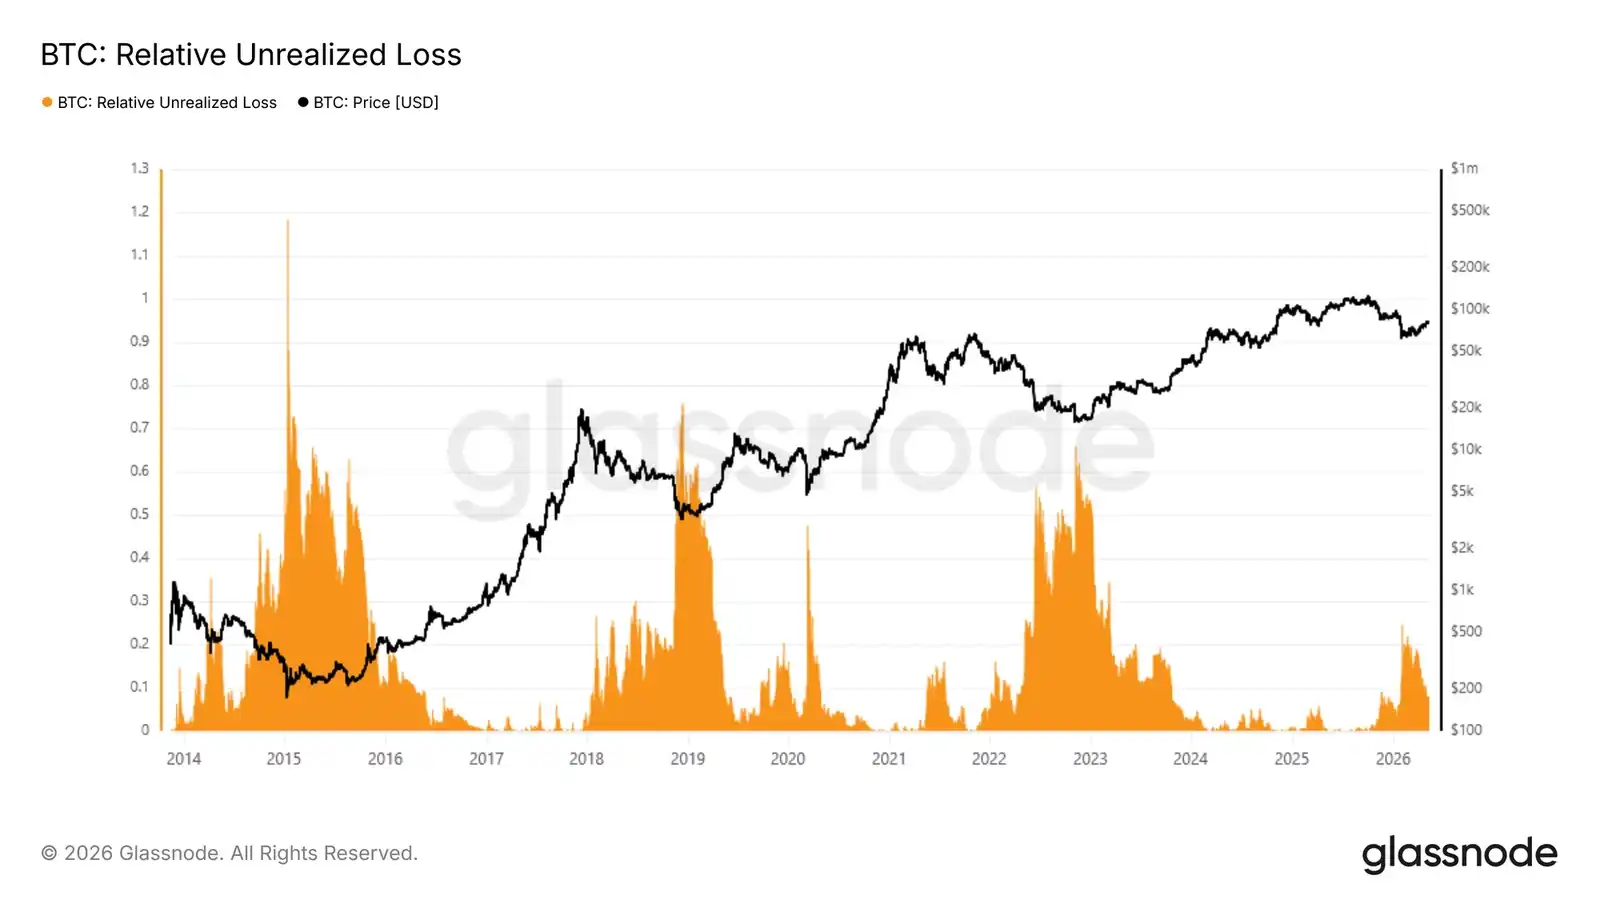
- Относительные нереализованные убытки биткоина достигли пика в 25% рыночной капитализации во время распродажи в феврале, а затем сжались до 8% после возвращения к 80 000 долларам, что подтверждает точку зрения о том, что если уровень в 60 000 долларов удержится, то это останется неглубоким медвежьим сценарием.
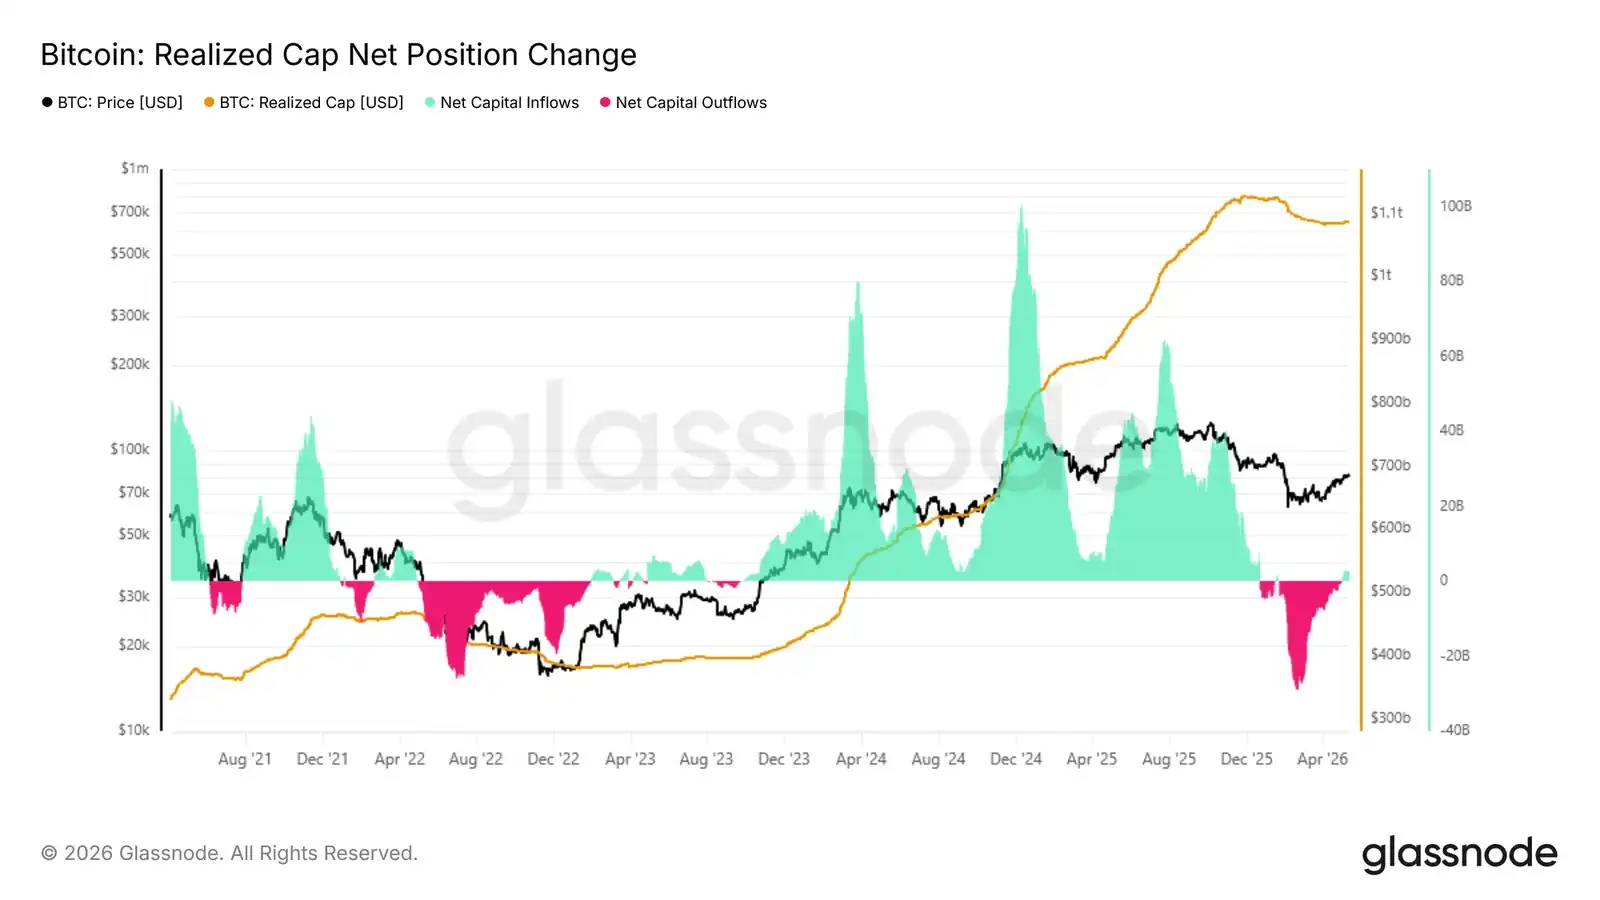
- Чистое изменение 30-дневной позиции в реализованной капитализации восстановилось до 2,8 млрд долларов в месяц, что указывает на улучшение притока капитала, но оно по-прежнему значительно ниже уровня свыше 10 млрд долларов в месяц в периоды расширения предыдущих бычьих рынков.
- 30-дневная себестоимость находится на уровне 76 900 долларов и обеспечивает краткосрочную непосредственную поддержку, в то время как уровень 86 900 долларов (зона накопления с ноября по февраль) остаётся ключевым уровнем сопротивления для текущего восстановления.
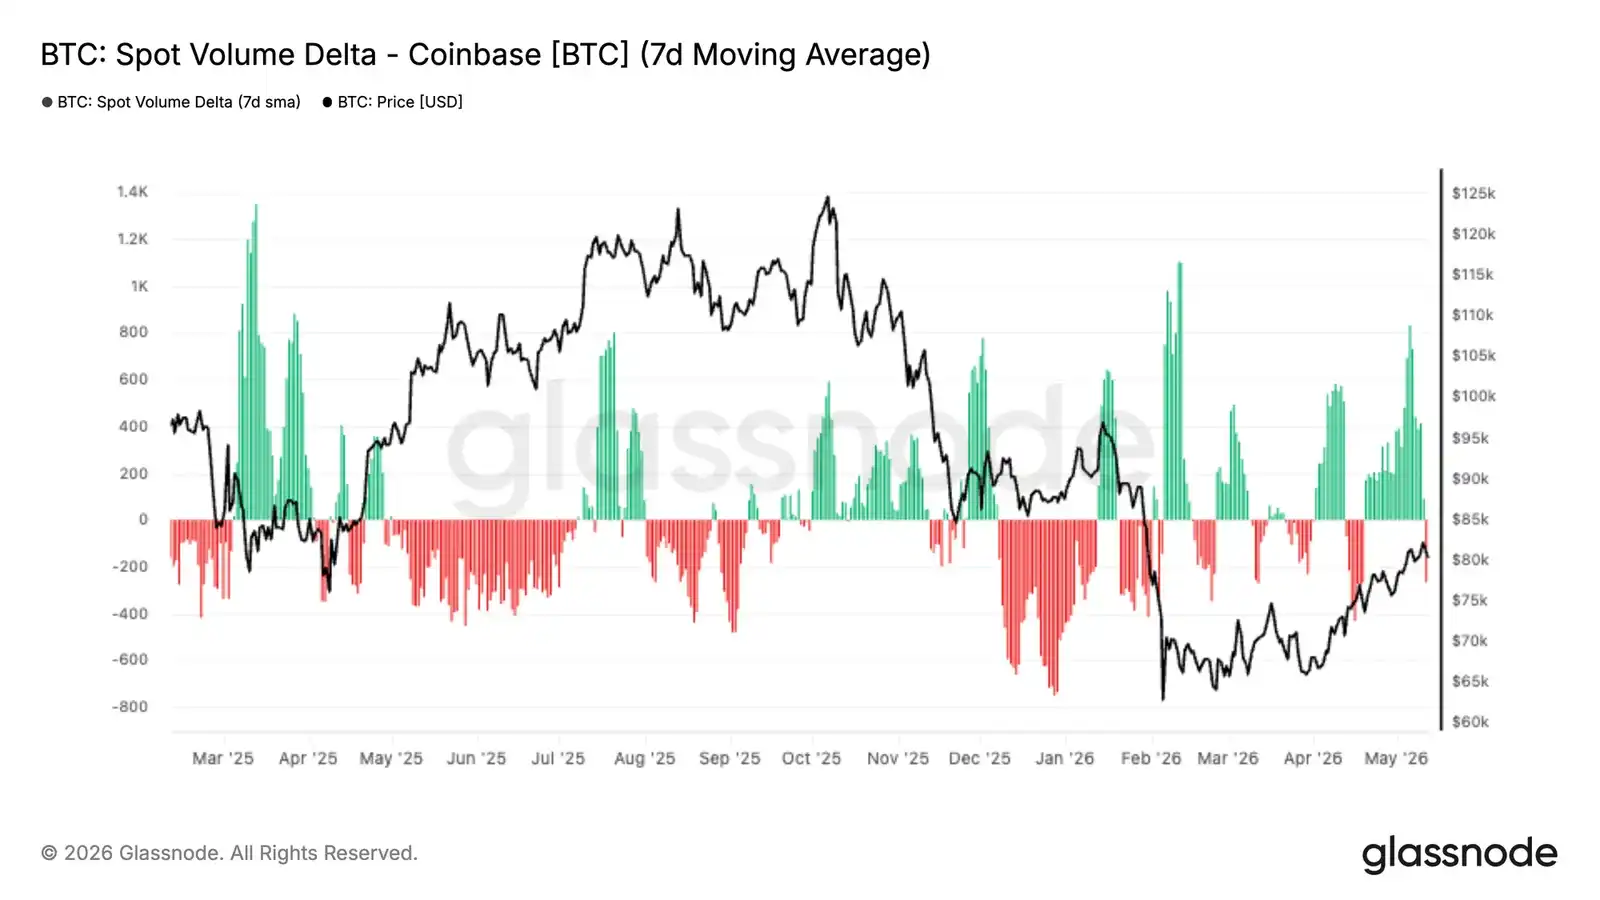
- Дельта объёмов спотовых торгов на Coinbase за последние две недели резко стала положительной, что свидетельствует о более агрессивной активности покупателей и усилении спроса на спотовом рынке.
- Трейдеры на Hyperliquid по мере роста цены стабильно наращивают длинные позиции, что отражает улучшение спекулятивных настроений и рост уверенности в продолжении роста.
- Подразумеваемая волатильность продолжает снижаться по всем срокам экспирации, возглавляемая короткими сроками, в то время как реализованная волатильность также имеет нисходящий тренд — рынок закладывает более спокойную краткосрочную перспективу.
- Сжатие перекоса (скив) указывает на ослабление спроса на хеджирование от падений, а структура опционов вокруг 80 000 долларов стала более сбалансированной.
- Позиции маркет-мейкеров остаются ключевым драйвером краткосрочной динамики: значительное скопление отрицательного гамма-экспоура вокруг 82 000 долларов по-прежнему может усиливать ценовые движения, если спот снова войдёт в эту зону.
Макроэкономический обзор
Макроэкономический контекст по-прежнему представляет собой противостояние между замедлением экономического роста и устойчивой инфляцией. Последние данные по инфляции в США оказались выше ожиданий, а рынок труда также оказался более устойчивым, чем многие предполагали. В результате рынки отодвинули ожидания по снижению процентных ставок ещё дальше, доходность гособлигаций остаётся высокой, финансовые условия относительно жёсткими.
Ликвидность остаётся ключевым драйвером для рисковых активов. Фондовые рынки продолжают медленно расти, но под поверхностью обстановка остаётся хрупкой, рынки адаптируются к реальности «более высоких ставок на более долгий срок». В то же время сила нефти и сырьевых товаров продолжает подпитывать инфляционные ожидания, особенно на фоне сохраняющейся геополитической напряжённости.
Для цифровых активов картина остаётся конструктивной, но избирательной. Несмотря на ужесточение условий ликвидности и силу доллара, биткоин демонстрирует устойчивость, что указывает на сохранение базового спроса. Однако слабый приток средств в ETF и высокие реальные доходности позволяют предположить, что для более устойчивого роста, возможно, потребуется смягчение финансовых условий или новые катализаторы, чтобы вновь разжечь более широкий аппетит к риску.
Обзор On-Chain данных
От страха к неопределённости
На фоне макросреды с устойчивой инфляцией, высокой доходностью гособлигаций и более жёсткими финансовыми условиями биткоин продолжает демонстрировать относительную устойчивость, что указывает на сохранение базового спроса даже при неспокойной общей обстановке на рынках рисковых активов. Для структурной оценки текущей фазы цикла показатель относительных нереализованных убытков (измеряющий общую долларовую стоимость нереализованных убытков всех инвесторов в процентах от рыночной капитализации) предоставляет точный барометр цикла. Во время февральского обвала этот показатель достиг пика в 25% от капитализации — значение, указывающее на значительное давление, но всё же далёкое от экстремальных уровней, зафиксированных в предыдущих медвежьих циклах. После возвращения к 80 000 долларам показатель сжался примерно до 8%. Этот сдвиг перевёл преобладающие настроения от страха к неопределённости, а не к полному краху.
Если уровень в 60 000 долларов окажется минимумом этого цикла, то этот медвежий рынок станет самым неглубоким за всю историю наблюдений — он зафиксировал страх, но был далёк от масштабной «капитальной чистки», которая исторически отмечала длительные донья циклов.
Масштаб притока капитала
По мере того как настроения сдвигаются от страха к неопределённости, ключевой вопрос заключается в том, является ли текущий отскок типичным для медвежьего рынка или это ранняя стадия настоящего бычьего разворота. Самый прямой способ измерить это — посмотреть на чистый приток капитала, то есть на 30-дневное чистое изменение реализованной капитализации, которое отслеживает ежемесячное изменение общего капитала, хранящегося в блокчейне. После недавнего роста до 82 000 долларов этот показатель достиг 2,8 млрд долларов в месяц. Это положительное значение объясняет конструктивный импульс последних недель.
Однако важен контекст: на ранних стадиях каждого крупного роста в бычьем рынке 2023-2025 годов этот показатель быстро ускорялся примерно с 2 млрд долларов в месяц до более чем 10 млрд долларов. Текущее значение, хотя и обнадёживает, всё ещё значительно ниже этого порога, что указывает на отсутствие той уверенности в притоке капитала, которая поддерживает текущее восстановление, по сравнению с аналогичными переломными моментами в предыдущих циклах.
Поддержка и сопротивление через призму себестоимости
Несмотря на рост на 37% с 60 000 до 82 000 долларов, приток капитала остаётся умеренным, а неопределённость сохраняется. Показатели реализованной цены, разделённые по срокам владения, предоставляют детальную основу для выявления наиболее непосредственных уровней поддержки и сопротивления. Эта модель отслеживает среднюю цену покупки монет в зависимости от срока их владения, проецируя точки привязки поведения различных групп инвесторов на ценовой график.
Импульс текущего роста в основном обусловлен волной накопления за последние 30 дней. Себестоимость этой группы в настоящее время находится на уровне примерно 76 900 долларов, формируя краткосрочный, наиболее непосредственный уровень поддержки. Выше, себестоимость инвесторов, накапливавших активы в период консолидации рынка с ноября по февраль, сконцентрирована вокруг 86 900 долларов. По мере того как эти держатели приближаются к точке безубыточности и сталкиваются с растущими стимулами для фиксации прибыли, эта зона представляет собой наиболее вероятный уровень сопротивления в ближайшей перспективе.
Обзор Off-Chain данных
Восстановление спроса на ETF
Приток средств в американские спотовые биткоин-ETF в последние недели вновь стал явно положительным, и с возвращением биткоина выше 80 000 долларов возобновился устойчивый приток. После месяцев нестабильного спроса и значительного оттока в первом квартале этот последний сдвиг указывает на то, что институциональный спрос начинает возрождаться более значимым образом.
Важно, что восстановление спроса на ETF носит устойчивый характер и не обусловлено единичным всплеском размещения средств, что указывает на стабильное накопление институциональными игроками по мере улучшения рыночных условий. Интенсивность притока также усиливается вместе с ростом цены, укрепляя точку зрения о том, что традиционный капитал снова поддерживает импульс, а не уходит на коррекции.
Текущая структура демонстрирует значительное улучшение рыночной структуры по сравнению с началом этого года. Приток средств в ETF теперь стал попутным ветром, а не источником постоянного давления продавцов, устранив одно из ключевых сопротивлений, которое ранее ограничивало попытки восстановления. При сохранении тенденции устойчивое институциональное накопление может обеспечить необходимую базу спроса, чтобы позволить биткоину в ближайшие недели бросить вызов более высоким зонам предложения.
Ускорение спотовых покупок на Coinbase
Дельта объёмов спотовых торгов на Coinbase за последние две недели резко стала положительной, и с возвращением биткоина к нижней границе диапазона в 80 000 долларов возобновилась агрессивная активность покупателей. Этот последний сдвиг резко контрастирует с постоянным давлением продавцов, которое доминировало большую часть первого квартала, когда отрицательная дельта объёмов постоянно усиливала нисходящий импульс.
Важно, что последний рост сопровождается повторяющимся увеличением положительного спотового объёма покупок, а не изолированными всплесками, что указывает на то, что устойчивый спрос начинает поглощать предложение сверху. Усиление активности на Coinbase также хорошо согласуется с восстановлением притока в ETF, что говорит о том, что американские розничные и институциональные покупатели вновь участвуют в рынке.
Текущая структура предполагает, что спотовый спрос снова становится поддерживающей силой для цены, а не источником распределения. Устойчивая сила потока покупателей на Coinbase, особенно в тандеме с ростом притока в ETF, указывает на улучшение рыночных убеждений и более здоровую основу спроса для последнего отскока.
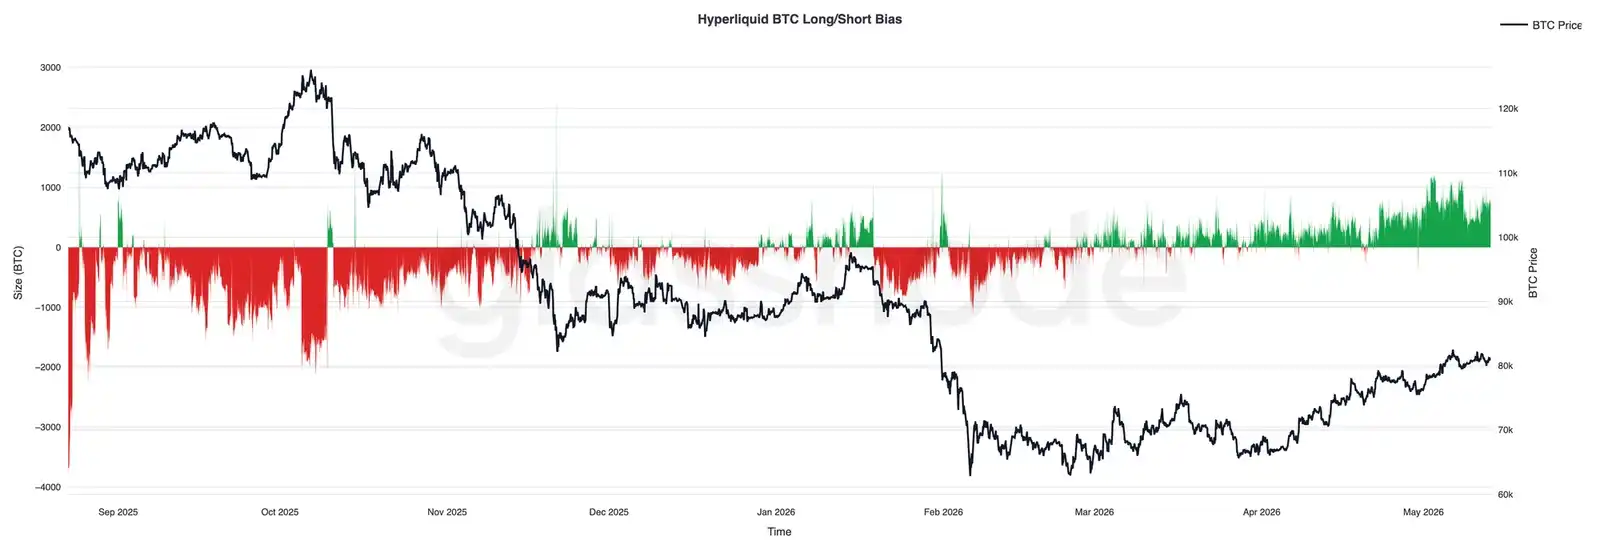
Трейдеры на Hyperliquid становятся всё более бычьими
За последние несколько недели позиции на Hyperliquid всё больше смещались в сторону покупок, а чистые позиции по BTC стабильно росли по мере восстановления биткоина до нижней границы диапазона в 80 000 долларов. Этот сдвиг знаменует собой заметный разворот по сравнению с устойчивым медвежьим уклоном, который доминировал на рынке большую часть первого квартала, когда рынок откатывался к нижней границе диапазона в 60 000 долларов.
Важно, что недавнее увеличение длинных позиций развивалось постепенно, а не за счёт единичного всплеска перекупленности, что указывает на то, что трейдеры стабильно восстанавливают направленный бычий экспоур по мере улучшения рыночных условий. Чистые позиции в настоящее время приближаются к самому бычьему уклону с конца 2025 года, что отражает рост уверенности в продолжении восходящего движения.
Устойчивое наращивание длинных позиций по мере роста цены указывает на улучшение настроений трейдеров и более конструктивный спекулятивный фон, хотя растущий длинный экспоур может сделать рынок более чувствительным к краткосрочной волатильности и откатам, вызванным ликвидациями.
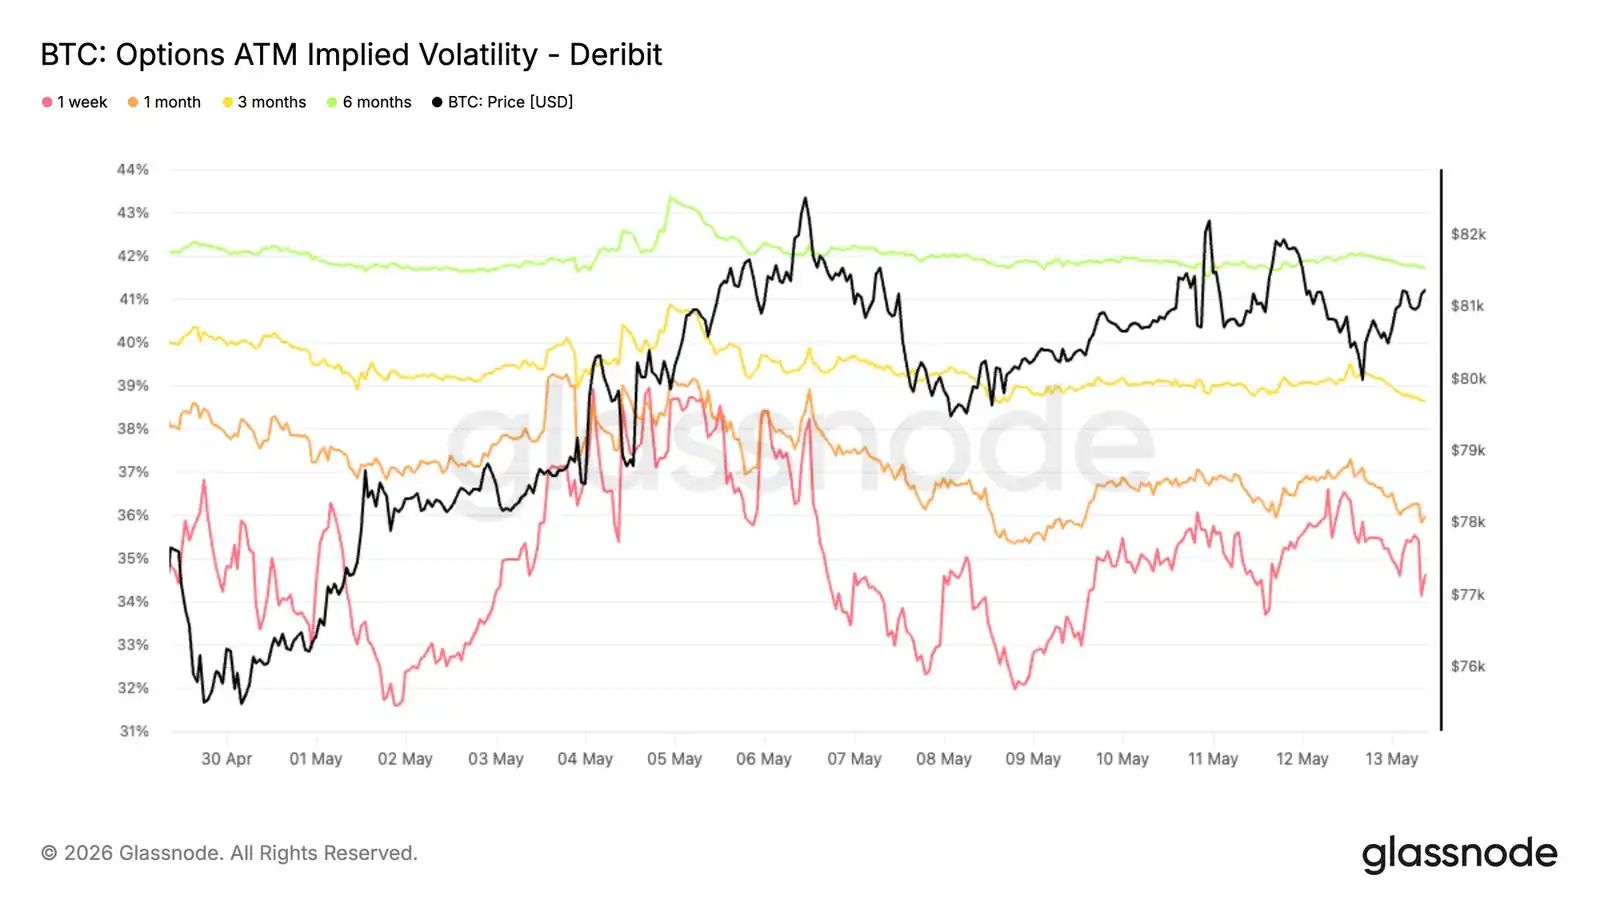
Снижение подразумеваемой волатильности
За последнюю неделю подразумеваемая волатильность биткоина развернулась вниз: ближайший месяц снизился с 39% до 34,6%. Более долгосрочные сроки экспирации также синхронно снизились, по всем срокам кривой падение составило примерно 1-2 пункта волатильности.
Это движение отражает общее переназначение всей кривой сроков в сторону понижения по мере того, как трейдеры снижают ожидания относительно краткосрочной реализованной волатильности. Снижение последовало за недавним отскоком волатильности и сопровождалось более контролируемым движением спота, укрепляя мнение о том, что рынок возвращается к более спокойной модели.
По мере сжатия подразумеваемой волатильности стоимость опционов снижается по всем срокам, особенно на коротком конце кривой, наиболее чувствительном к изменениям в краткосрочных позициях и спросе.
Текущая структура отражает меньшее ожидание рынком крупных движений впереди, предложение волатильности продолжает превышать спрос по всем срокам кривой.
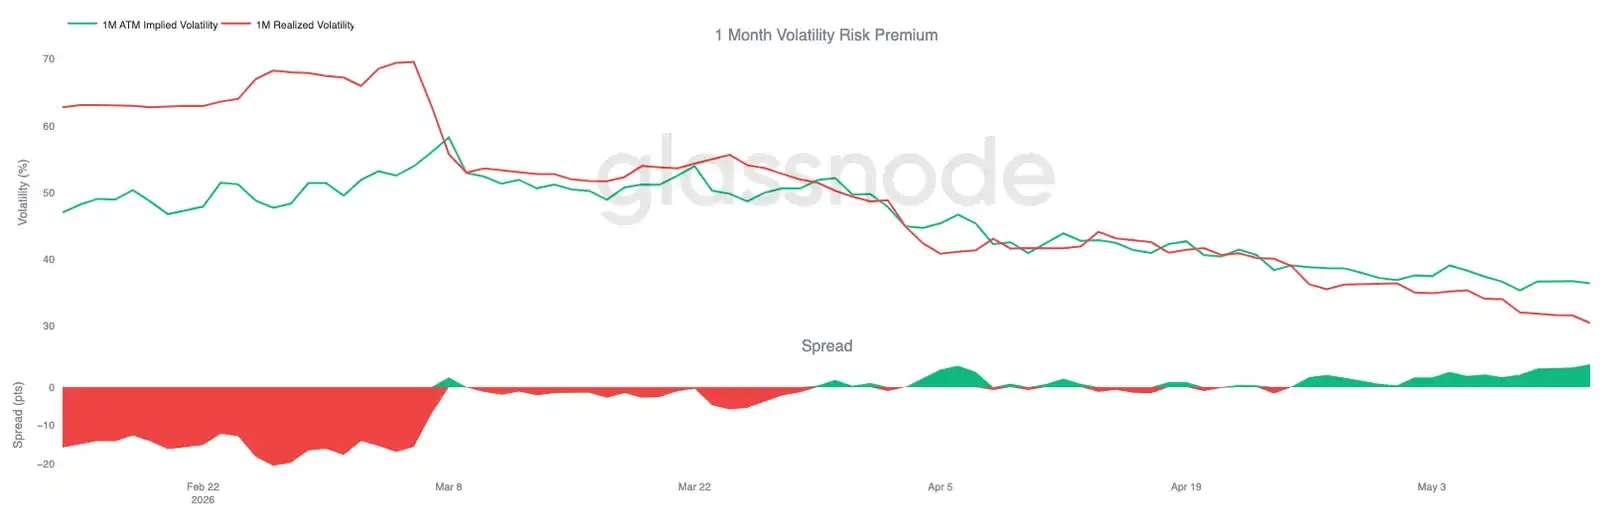
Премия за риск волатильности остаётся положительной
Хотя подразумеваемая волатильность продолжает сжиматься по всем срокам кривой, реализованная волатильность снижается быстрее. 30-дневная реализованная волатильность биткоина в настоящее время составляет 30,48% и в последние недели стабильно снижалась по мере относительно контролируемого движения спота.
В то же время подразумеваемая волатильность ближайшего месяца всё ещё составляет около 36,4%, то есть подразумевается больше волатильности, чем демонстрирует недавнее движение спота биткоина, сохраняя положительную премию за риск волатильности. Другими словами, опционы по-прежнему закладывают больше волатильности впереди, чем та, которую демонстрирует биткоин в последнее время.
Разрыв между подразумеваемой и реализованной волатильностью также восстанавливался в течение последних двух-трёх недель, увеличившись примерно до 6 пунктов волатильности после кратковременного сжатия до паритета в апреле. Это говорит о том, что, несмотря на общее снижение волатильности, спрос на опционы относительно реализованной волатильности остаётся высоким.
Таким образом, хотя общая волатильность продолжает смягчаться как в подразумеваемом, так и в реализованном измерении, условия для хеджирования по-прежнему благоприятны для продавцов волатильности.
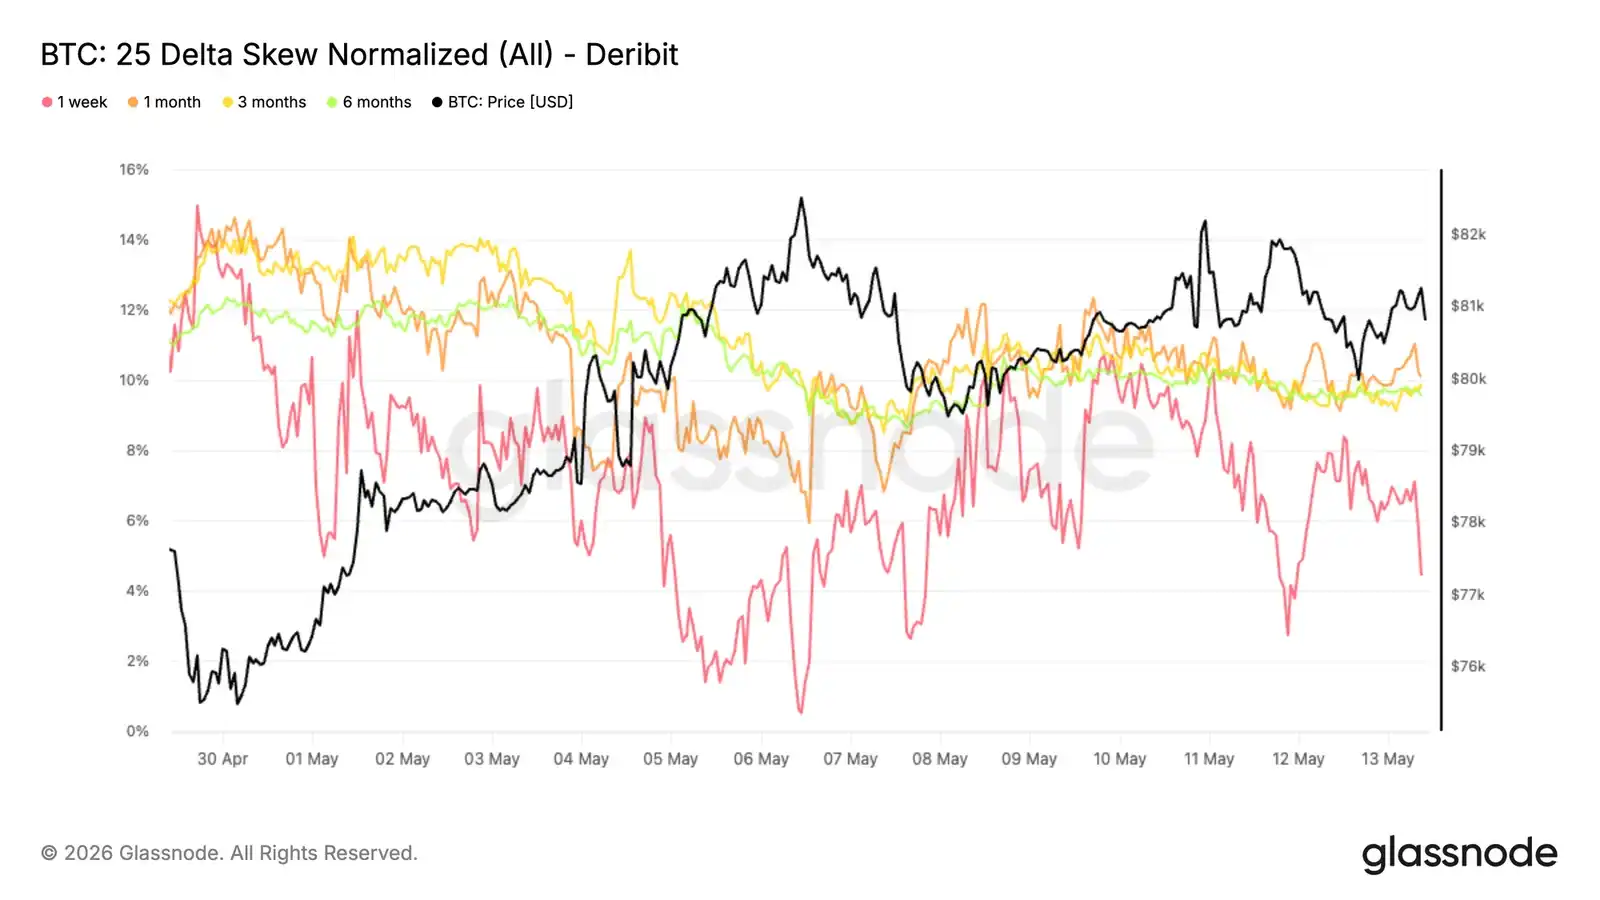
Сжатие перекоса указывает на ослабление спроса на хеджирование от падений
По мере того как ожидания волатильности продолжают пересматриваться в сторону понижения, перекос (скив) также нормализуется по всем срокам кривой. Это движение наиболее заметно на коротком конце: за последнюю неделю 1-недельный 25-дельта скив сжался примерно с -10% до -4%. Более долгосрочные сроки также смягчились: сроки 1, 3 и 6 месяцев потеряли около 1-2 пунктов медвежьей премии.
Примечательно, что это сжатие происходит на фоне консолидации биткоина в диапазоне вокруг 80 000 долларов и менее поддерживающего макроконтекста. Поверхность опционов не показывает увеличения спроса на защиту от падений, а продолжает переназначаться в сторону более сбалансированной структуры.
Это восходящее движение отражает устойчивое снижение премии путов по сравнению с коллами, что указывает на постепенное ослабление, а не усиление спроса на защиту от падений по всем срокам кривой.
Хотя перекос по всем срокам остаётся в медвежьей зоне, устойчивое сжатие указывает на постепенное ослабление, а не на обострение спроса на хеджирование от падений.
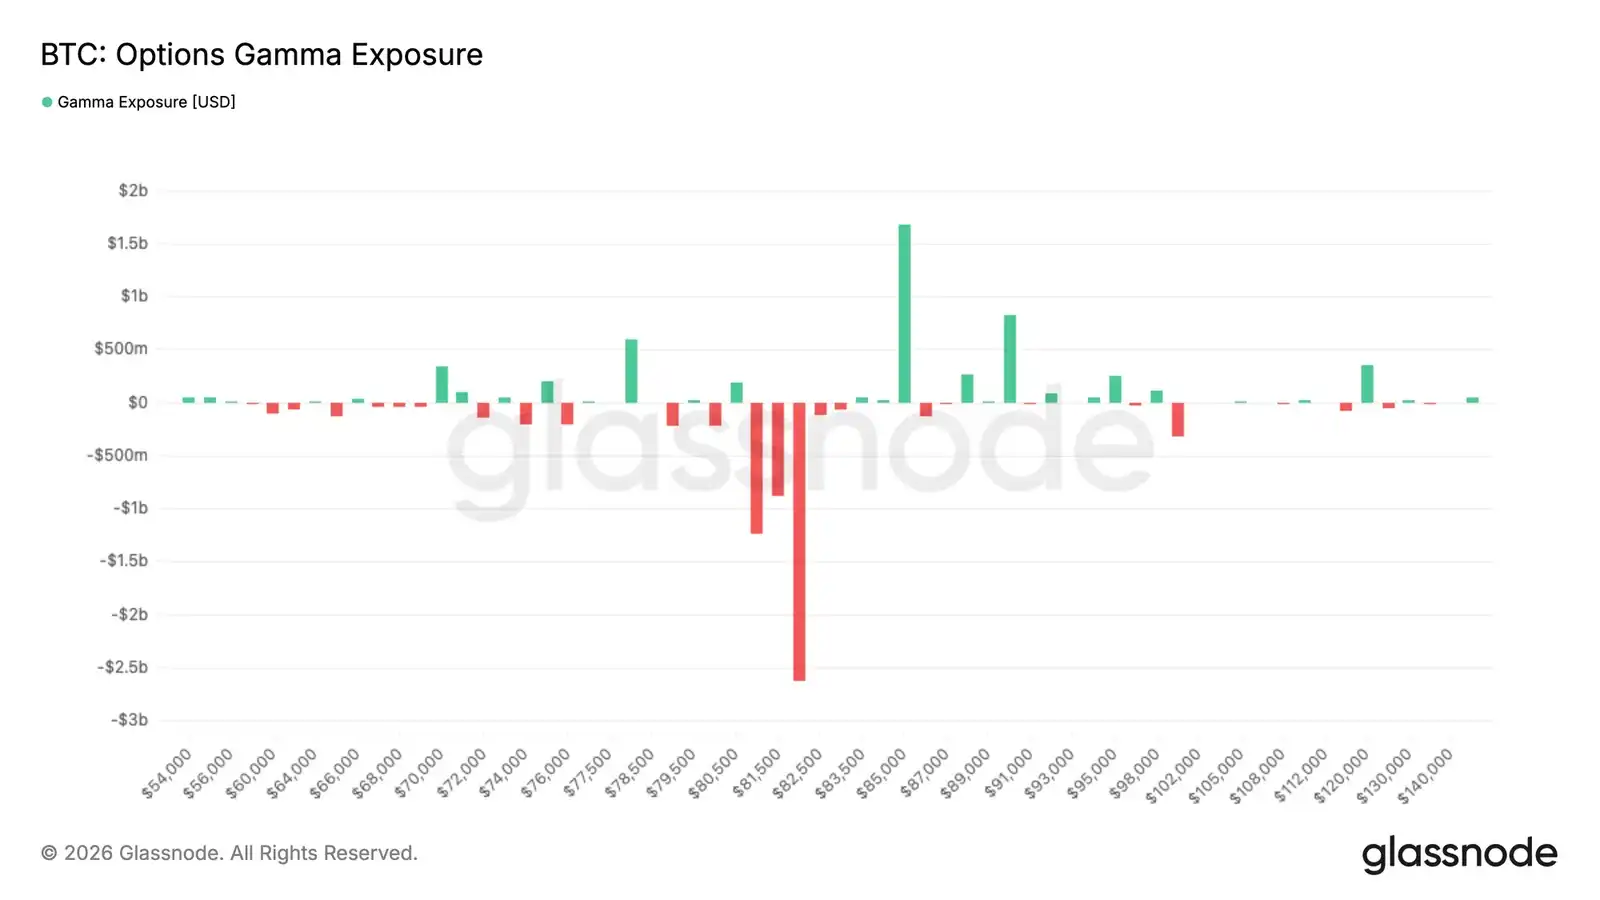
Гамма маркет-мейкеров сохраняет чувствительность спота вокруг 82 000 долларов
Позиции маркет-мейкеров продолжают создавать реактивную структуру вокруг текущих ценовых уровней. Максимальная концентрация отрицательной гаммы находится на страйке 82 000 долларов с экспоуром около 2,6 млрд долларов, в то время как положительная гамма накапливается вокруг 85 000 долларов, приближаясь к 1,8 млрд долларов.
Поскольку спот остаётся ниже скопления отрицательной гаммы на уровне 82 000 долларов, если цена вернётся в эту зону, это может спровоцировать реактивные хеджевые потоки маркет-мейкеров, усиливающие импульс и увеличивающие ценовые движения. Выше, концентрация положительной гаммы вокруг 85 000 долларов может подавлять волатильность.
Потоки также отражают сдвиг в позициях. За последние 7 дней покупки путов составили 71% от премиального потока, что отражает высокий спрос на защиту от падений в период недавней консолидации. За последние 24 часа 58% потока пришлось на продажу путов, что указывает на закрытие части хеджей.
Эта структура повышает чувствительность рынка к усилению хеджевых потоков, если спот снова войдёт в значительное скопление отрицательной гаммы вокруг 82 000 долларов.
Заключение
Подводя итог, восстановление биткоина продолжает укрепляться под поверхностью: спрос, основанный на споте, возобновление притока в ETF и улучшение спекулятивных позиций вместе способствуют формированию более конструктивной рыночной структуры. Резкое сжатие относительных нереализованных убытков, а также стабилизация ключевых показателей прибыльности и ликвидности в блокчейне указывают на то, что февральское падение всё больше рассматривается как циклический сброс, а не начало более глубокого медвежьего рынка.
В то же время характеристики этого отскока заметно отличаются от агрессивного расширения в период 2023-2025 годов. Приток капитала восстанавливается, но всё ещё значительно ниже предыдущих пороговых значений прорыва, а сжатие волатильности и более спокойные позиции на деривативном рынке указывают на то, что рынок постепенно восстанавливает уверенность, а не вступает в фазу ажиотажа. Это делает текущий рост больше похожим на восстановление со структурной поддержкой, а не на полностью подтверждённый прорыв импульса.
Поскольку биткоин теперь снова входит в плотную зону предложения сверху в диапазоне 82 000–87 000 долларов, рынок приближается к области, где ценовое открытие становится всё более важным. Для устойчивого удержания в этой зоне, вероятно, потребуется более сильное участие спота и более глубокий оборот капитала для поглощения оставшегося предложения сверху. До этого общая структура продолжает улучшаться, но уверенность, по-видимому, всё ещё восстанавливается, а не вернулась полностью.


