
Упоминаемые в отчете рынки, проекты, монеты и другая информация, мнения и суждения носят исключительно информационный характер и не являются инвестиционной рекомендацией.
На этой неделе BTC открылся на отметке $91 499.04 и закрылся на $90 872.01, снизившись на 0.68% с амплитудой колебаний 6.15%. Объем торгов по сравнению с прошлой неделей значительно увеличился.
Как и прогнозировалось в предыдущих отчетах, на этой неделе BTC снова достиг уровня $94 000. Движущей силой стало продолжающееся улучшение ликвидности ФРС и ожидания «мягкой посадки» на фоне соответствующих ожиданиям данных по занятости в США.
Однако, поскольку снижение ставок в январе маловероятно, аппетит к риску на рынке продолжает ухудшаться. После подъема до уровня сопротивления $94 000, BTC ETF и долгосрочные инвесторы увеличили продажи, в результате чего отскок не увенчался успехом, и цена снова отступила к уровню $90 000.
В настоящее время BTC и рынок криптовалют по-прежнему находятся в困境: покупательская способность поддерживает, но не подталкивает цену вверх, а продавцы усиливают давление при росте. Новый покупательский настрой или общее улучшение аппетита к риску, возможно, позволят BTC преодолеть сопротивление на уровне $94 000 и further расширить пространство для отскока.
По техническим индикаторам, BTC находится в благоприятной ситуации с повышающимися минимумами отката и показывает признаки закрепления выше 60-дневной скользящей средней. При отсутствии негативных внешних потрясений цена в краткосрочной перспективе может пробить уровень $94 000 и бросить вызов 90-дневной скользящей средней, указывающей на $95 000.
Политика, макрофинансы и экономические данные
Учитывая остановку работы правительства, опубликованные на этой неделе месячные экономические данные США стали первыми с момента нормализации и поэтому были очень важны, но конечные результаты не вышли за рамки рыночных ожиданий.
8 января опубликованные данные о первичных заявках на пособие по безработице показали, что количество заявок за неделю составило 208 тыс., что немного ниже ожиданий и предыдущих значений. Это легкий позитивный сигнал для рисковых активов, но, соответствуя ожиданиям «мягкой посадки», скорее указывает на resilience экономики.
class="ql-align-justify">9 января были опубликованы данные по изменению численности занятых в несельскохозяйственном секторе США за декабрь: 50 тыс., что ниже ожидаемых 60 тыс. и предыдущего значения 56 тыс., но уровень безработицы составил лишь 4.4%, немного ниже ожидаемого значения 4.5%. Рост почасовой заработной платы составил 3.8%, превысив ожидаемые 3.6%. Эти, казалось бы, «противоречивые» данные о занятости указывают на то, что кризис на рынке труда менее серьезен, чем ожидалось, что привело к падению вероятности снижения ставки в январе, отображаемой FedWatch, до однозначных цифр.Данные этой недели укрепили консенсус о том, что экономика движется к мягкой посадке, занятость постепенно охлаждается, но не настолько плохо. Основная мировая арена для капитала, фондовый рынок США, сохраняет силу: индексы S&P 500 и Dow Jones обновили исторические максимумы, а Nasdaq, подвергавшийся сомнениям из-за больших вложений в ИИ, также вырос на 1.88%, приблизившись к предыдущему историческому пику. Наблюдаются признаки перетока капитала из акций технологического сектора в потребительские, value-акции и акции компаний малой и средней капитализации.
Доходность 10-летних казначейских облигаций составила 4.173%, а реальная доходность достигла 1.91%, что по-прежнему создает значительное давление на акции технологических компаний и активы с длительной дюрацией, такие как BTC.
Рынок криптовалют
Макроликвидность улучшается, но еще не достигла уровня изобилия, поэтому высокорисковые активы остаются под давлением. Если акции AI-технологий испытывают давление, то BTC и подавно.
На уровне потоков средств видно, что циклические и краткосрочные средства продолжают фиксировать прибыль на росте, а долгосрочные инвестиционные средства покупают на низких уровнях. В настоящее время установилось хрупкое равновесие.
На этой неделе, по мере роста цены к предыдущим максимумам, перед публикацией важных экономических данных и данных о занятости, снова возникла волна продаж.
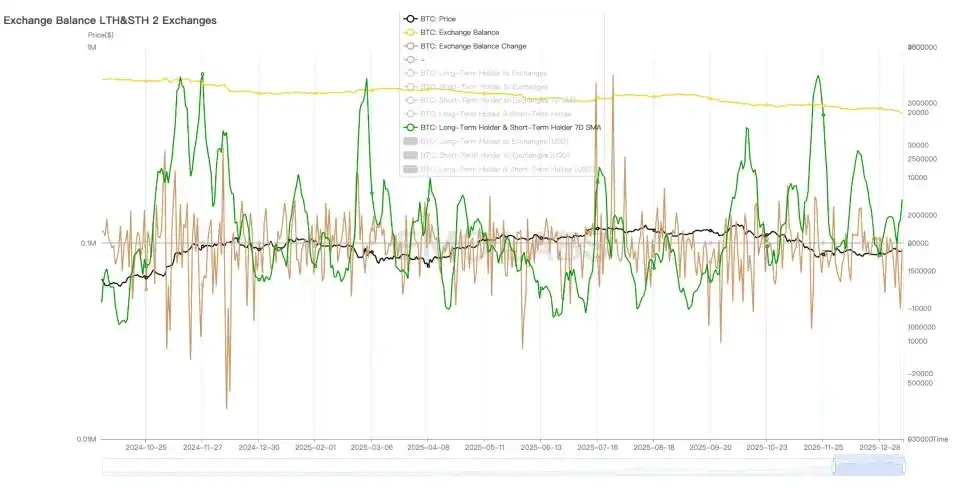
Статистика продаж долгосрочных и краткосрочных инвесторов на централизованных биржах (день)
Такие продажи, вызванные предпочтениями к риску, не носят устойчивого разрушительного характера, и их масштаб в настоящее время постепенно сокращается. Продолжающиеся продажи со стороны долгосрочных инвесторов остаются самой большой угрозой для рынка криптовалют в среднесрочной перспективе.
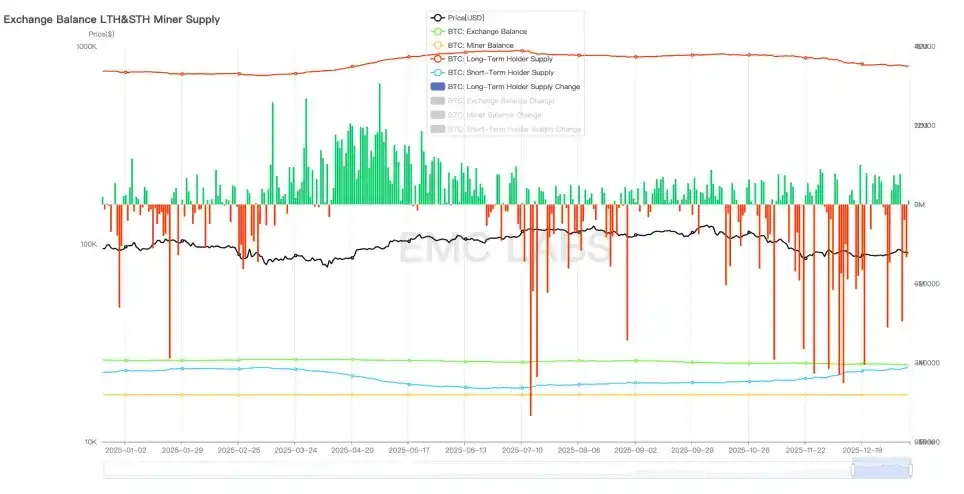
Статистика изменения持仓 долгосрочных инвесторов (день)
На прошлой неделе масштабы продолжающегося сокращения持仓 долгосрочными инвесторами несколько ослабли, но все еще продолжаются, что также привело к развороту вниз после подъема BTC до $94 000.
Это подтверждается и данными о потоках средств. Наибольший приток произошел 5 января, после чего наблюдался continued отток, в результате чего неделя закрылась с чистым оттоком: BTC ETF — $647 млн, стейблкоины — $539 млн.
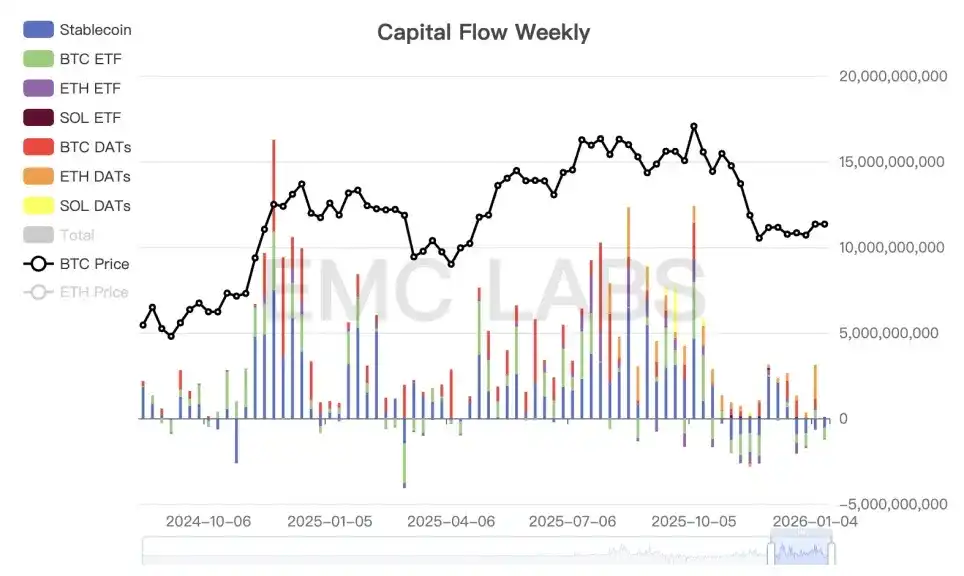
Статистика притока и оттока средств на рынке криптовалют (неделя)
На прошлой неделе с централизованных бирж наблюдался чистый отток объемом nearly 25 000 монет. Сила, поддерживающая рынок, по-прежнему исходит от «группы китов и акул», чьи holdings持续 увеличивались в течение прошлой недели. Однако эта группа currently придерживается стратегии «поддержки без подталкивания», скупая активы на низких уровнях и не создавая upward покупательского давления.
Циклические индикаторы
Согласно eMerge Engine, индикатор EMC BTC Cycle Metrics составляет 0, что означает вход в «фазу снижения» (медвежий рынок).
О нас
EMC Labs (Лаборатория Эмерджентности) была создана инвесторами в криптоактивы и data scientists в апреле 2023 года. Мы специализируемся на исследованиях blockchain индустрии и инвестициях на вторичном рынке Crypto. Нашими основными компетенциями являются отраслевой前瞻, проницательность и挖掘 данных. Мы стремимся участвовать в развитии蓬勃发展的 blockchain индустрии через исследования и инвестиции, продвигая blockchain и криптоактивы для благополучия человечества.
Более подробная информация на: https://www.emc.fund


