
Автор: Непонятный SOL
После убытков в 20 миллионов я наконец понял: при инвестировании в акции Китая самое важное — вовремя выйти с вершин; при инвестировании в американские акции самое важное — покупать на дне.
Выход с вершин на китайском рынке, особенно с больших вершин, самый простой и одновременно самый сложный. Простым он является потому, что вершины на китайском рынке — это типичные вершины при всеобщем ажиотаже, и задним числом кажется, что слова «большая вершина» написаны прямо на графике;
Сложным он является потому, что на китайском рынке заработать можно только на росте, а рынок акций в долгосрочной перспективе всё равно растёт, выход с вершины равносилен фиксации прибыли, сам по себе он не приносит денег, а человеческая природа жадная.
В сравнении с этим, на американском рынке самое важное — покупать на дне, если смотреть на рынок за последние 20 лет, то главным железным правилом инвестирования является покупка при любом падении.
Можно сказать, что если уже вложенные деньги просто держать, то ключевой вопрос — когда вкладывать новые деньги на дне? А при инвестировании в американские акции самым простым и сложным также является покупка на дне.
Почему это просто: покупка на дне на американском рынке — это «при маленьком падении — покупать немного, при большом падении — покупать много, при отсутствии падения — не покупать»
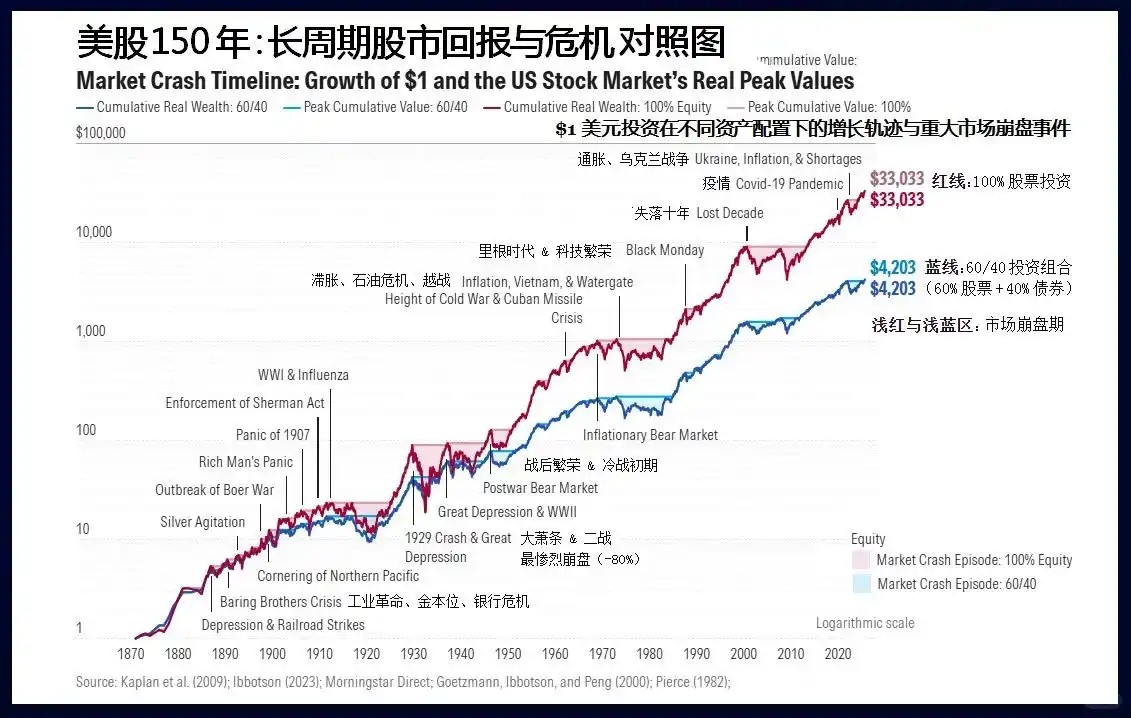
С 1776 года все, кто ставил против Америки, в конечном итоге терпели сокрушительное поражение.
Почему это сложно: потому что большинство людей перешли с китайского рынка, где «покупали на дне на полпути», страдают «посттравматическим синдромом покупки на дне» и всегда хотят купить ещё дешевле, чтобы обезопасить себя, в результате при падении боятся покупать на дне, а при отскоке бегут догонять.
Поэтому, когда появляется возможность купить на дне на американском рынке, всем обязательно нужно разобраться с двумя вопросами:
1. При нормальных условиях, на сколько обычно падает американский рынок за один цикл корректировки?
2. Если произойдёт событие «чёрного лебедя» и падение будет бесконечным? Что тогда делать?
1. Насколько глубока коррекция на американском рынке? Сначала нужно определиться с понятием: что такое «коррекция»?
Обычно коррекции делят на три уровня: дневной, недельный и месячный, а при одном цикле падения должно выполняться одно из двух условий: величина или время (определение у каждого может быть разным, в данной статье представлен только мой стандарт).
- Дневной уровень: падение с最高шей точки на 5% и более, либо продолжительность более двух недель (имеется в виду промежуток времени от максимума до минимума);
- Недельный уровень: падение с最高шей точки на 10% и более, либо продолжительность более 4 недель;
- Месячный уровень: падение с最高шей точки на 15% и более, либо продолжительность более 4 месяцев.
Достаточно выполнения одного из двух условий. Некоторые коррекции неглубоки по величине, но затянуты по времени, другие — наоборот. После определения понятия, покупка на дне сводится к двум целям:
- Цель первая: купить желаемый объём позиций
- Цель вторая: купить как можно дешевле,
Ситуация всегда понятна задним числом, а в момент происходящего цикла коррекции мы можем определить только две вещи — на сколько упало с предыдущего максимума до сегодняшнего дня и сколько дней длится падение?
В дальнейшем оно может продолжиться, может стабилизироваться или снова пойти в рост.
Поэтому эти две цели противоречат друг другу: если покупать слишком быстро,很可能 выполнишь первую цель, но купишь дорого;
但如果一心想要买得便宜,很可能最后买不到就涨上去了
Это требует от нас некоторого вероятностного понимания исторической глубины коррекций на американском рынке, чтобы поставить разумную цель.
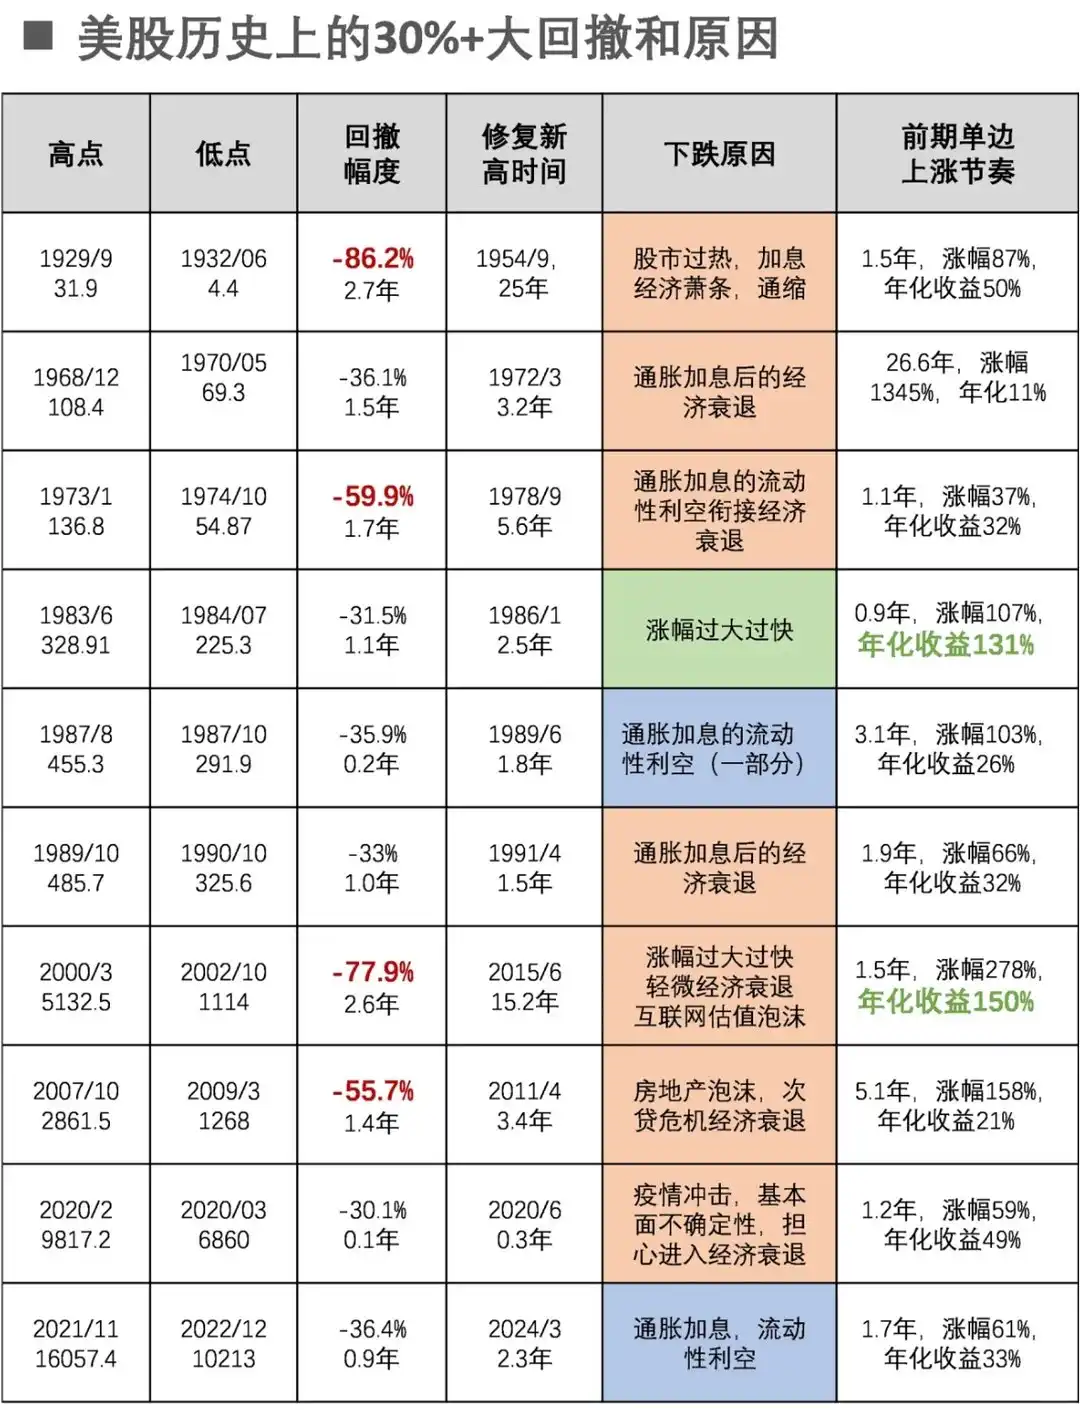
Крупные отказы на 30%+ в истории США и их причины
Возьмём для примера индекс S&P 500, за 20 лет с 2004 года по настоящее время месячных коррекций было всего 7, их причины соответственно:
- Январь-октябрь 2022: самый резкий цикл повышения процентных ставок за 40 лет
- Февраль-март 2020: глобальное событие в области общественного здравоохранения
- Сентябрь-декабрь 2018: торговая война в сочетании с повышением ставок
- Июль 2015 - февраль 2016: рецессия в Китае в сочетании с ожиданиями повышения ставок
- Апрель-сентябрь 2011: углубление долгового кризиса в Европе
- Апрель-июнь 2010: долговой кризис в Европе и дело о мошенничестве Goldman Sachs
- Октябрь 2007 - март 2009: ипотечный кризис
Таким образом, коррекции месячного уровня на американском рынке还是非常 редки, в среднем раз в 3 года, и у каждой есть причины на макроэкономическом уровне, даже с сентября 2011 по июль 2015 года за 44 месяца их не было, что является признаком длинного бычьего рынка.
А коррекций недельного уровня больше, 2-3 раза в год, и для них не нужны фундаментальные причины, достаточно просто сильного роста.
Поэтому, покупая на дне,首先要判断, это коррекция недельного или месячного уровня?
Но движение акций подвержено влиянию различных новостей, и его трудно точно предсказать, ФРС не принадлежит вам, негативные и позитивные новости не будут появляться по вашему плану — к счастью, вы还能决定自己的目标。
Вам нужно подумать над一个问题, представьте, что это торг с продавцом, если из целей «купить» и «купить дёшево» можно выбрать только одну, что вы выберете?
Если первую, то вам следует предположить, что коррекция недельного уровня, и строить план исходя из этого, так даже если на самом деле произойдёт коррекция месячного уровня, вы всё равно выполните свою первую цель; аналогично, если ваша цель — «купить дёшево», то следует подготовить план покупки на дне для коррекции месячного уровня.
Но в一般情况下, я рекомендую ставить «купить» в качестве первой цели, особенно если у вас есть свободные деньги, во-первых, потому что коррекции месячного уровня случаются раз в три года, вероятность действительно невысока, во-вторых, имея свободные деньги, если не купите американские акции, вы, скорее всего, купите другие高风险的产品。
Имея цель, план становится намного проще.
2. Временной план и позиционный план: первый вопрос при покупке на дне на американском рынке — когда начинать?
На примере покупки на дне при коррекции недельного уровня: достаточно двух недель без обновления максимумов, и实际上 уже происходит дневная коррекция, нужно готовить план покупки на дне при коррекции недельного уровня.
Ключ к покупке на дне на американском рынке — два слова: партиями.
Есть два типа плана покупки партиями: первый — временными партиями, покупать через определённые промежутки времени; второй — позиционными партиями, покупать при достижении определённых уровней. Согласно данным движения за последние 20 лет, среднее время коррекции недельного уровня (исключая коррекции месячного уровня) от вершины до дна составляет 10 недель, тогда временной план можно разделить на три партии: от вершины往后, покупать на дне каждые три недели, интервал между второй и первой можно сделать побольше;
Позиционный план также можно разделить на три партии, купить первую партию при падении на 3% от вершины, если максимальное падение составит 10%, то можно выполнить весь план покупки на дне.
Вероятность выполнения этих двух планов разная, временной план обычно выполним,除非 это只是 дневная коррекция, и很快 снова обновляются максимумы, что тоже не жалко, по крайней мере, удалось воспользоваться возможностью дневной коррекции для увеличения позиции.
Но позиционный план может не выполниться, многие коррекции недельного уровня на американском рынке只是 затянуты по времени, но幅度 не достигают 10%.
А при коррекции недельного уровня, если первой целью является «выполнить покупку на дне», то следует отдавать приоритет «временному плану партиями», даже если跌幅 не достигнут, как только истечёт время коррекции, нужно выполнять план покупки партиями.
Теперь рассмотрим план покупки на дне, рассчитанный на коррекцию месячного уровня, средняя продолжительность до дна каждый раз составляет 6,5 месяцев, но差异很大, поэтому следует исходить из принципа «скорее всего не купишь всё», сколько купишь, столько и купишь.
По объёму позиции不必 делить поровну, а делать убывающими: первые партии — 1/2, 1/3 и 1/6 от всего плана.
Временной план можно разделить на: первый месяц, третий месяц, шестой месяц. Позиционный план можно разделить на: падение на 3%, падение на 8%, падение на 15%. Таким образом, часто, ставя целью коррекцию «месячного уровня», вы в итоге выполняете план покупки на дне при коррекции недельного уровня, но объём не достигает, поэтому я一开始还是建议 по возможности ориентироваться на план для недельной коррекции。
Покупку на дне на американском рынке можно кратко总结为 три делать и три не делать:
1、Делать план покупки партиями, не принимать случайных решений в течение trading day、не совершать эмоциональные сделки;
2、Ориентироваться на «купить достаточно», а «купить дёшево»作为辅助;
3、Ориентироваться на «временные партии», а «позиционные партии»作为辅助。Покупка на дне на американском рынке — это очень механистический план, а前提条件 этого плана — долгосрочный восходящий и относительно низковолатильный тренд американского рынка.
Но акции — это всё же поле человеческих博弈, и экономическое развитие также имеет不可预测性, события «чёрного лебедя» могут произойти в любой момент, и они必然 произойдут。
Если время или глубина коррекции превысят план, как следует应对? Если произойдёт событие «чёрного лебедя», что тогда делать?
3. События «чёрного лебедя»
Приведённое выше деление коррекций на месячный и недельный уровни хорошо тем, что标准比较清晰, но даже коррекции одного месячного уровня сильно отличаются, среди них кризисы 2008 и 2020 годов实际上 были экономическими кризисами, а не просто коррекциями рынка。
Поэтому还可以按原因 разделить рыночные коррекции на три типа:
1、Естественная коррекция, вызванная значительным cumulative ростом, при基本上 благоприятной макроэкономической ситуации — большинство дневных и недельных коррекций таковы
2、Коррекция, вызванная завышенной оценкой в сочетании с экономическим спадом или ужесточением денежно-кредитной политики —少数 недельных и большинство месячных коррекций относятся к этому типу
3、Экономический кризис или крупная рецессия, вызванная системными рисками —少数 месячных коррекций или длительные медвежьи рынки относятся к этому типу。
За последние 20 лет ипотечный кризис 2008 года и事件 глобального здравоохранения 2020 года относятся к третьему типу, первый за год с лишним упал на 58%, второй за два месяца упал на 35%, поэтому третья ситуация превышает наш план покупки на дне и требует отдельного анализа。
Однако, кризис и коррекция вначале не отличаются, когда американский рынок только начал падать в 2007 году, рынок считал это экономическим спадом, после начала снижения ставок ФРС рынок отскочил, и в начале 2008 года инвесторы уже массово пошли покупать на дне.
Поэтому, в процессе покупки на дне во время коррекции, 也需要不断观察, не произошло ли чего-то, чего не было вначале падения, или не ухудшились ли факторы, вызвавшие первоначальное падение.
На примере недавних глубоких падений: такие стандартные медвежьи рынки, как падение на 27% за год в 2022 году,反而最好判断, они движимы стандартной макрологикой, все обсуждают повышение ставок, все цены растут, каждый месяц есть данные, говорящие, что этот месяц хуже предыдущего, покупка на дне顶多 вначале确认时 принесёт убытки, потом自然 станет ясно, что это затяжная война, и нужно растянуть время покупки на дне。
Такие «редко виданные» обвалы, как падение на 36% за месяц в 2020 году из-за事件 общественного здравоохранения, являются следствием непредсказуемых событий «чёрного лебедя» внеэкономического характера, краткосрочно确实 вызывают панику, но после падения всё заканчивается, в这种情况下,只能 терпеть。
Самым сложным было падение на 58% во время финансового кризиса 2008 года, это смесь двух вышеупомянутых ситуаций: в обычной рецессии произошло кризисное событие, вызвавшее глубокий медвежий рынок рецессии, его также нельзя предсказать, можно только реагировать.
Если вернуться ещё раньше, к лопнувшему пузырю доткомов 2000 года, это редкое падение, вызванное завышенной оценкой, которое, в свою очередь, потянуло экономику вниз, но тогда уровень оценок确实 был намного выше, чем сейчас, это было предсказуемое событие «серого носорога», но никто не хотел «сходить первым».
Обобщая эти типы падений на американском рынке, вы обнаружите, что не стоит提前 предсказывать падения, самое важное — смотреть правде в глаза, реагировать после того, как это произошло, небо не упадёт.
Конечно, отсутствие прогнозов и принятие своевременных и правильных мер после события требует от вас внимания к рынку, нельзя像 управлять капиталом那样只 распределять активы而不 управлять ими, вам всё равно需要在 определённой фазе падения оценить, не может ли ситуация развиться в кризис.