Ethereum продолжает испытывать трудности ниже уровня в $2000, поскольку постоянное давление продаж и повышенная неопределенность оказывают влияние на настроения на более широком криптовалютном рынке. Несмотря на периодические попытки восстановления, движение цены остается неустойчивым, а волатильность остается повышенной после месяцев коррекционного импульса. Неспособность решительно вернуть этот психологический порог усилила осторожность среди трейдеров, особенно в условиях ужесточения ликвидности и продолжающегося влияния макроэкономической неопределенности на аппетит к риску в отношении цифровых активов.
Недавний анализ от Darkfost добавляет дополнительный контекст к текущей структуре рынка. Согласно данным, текущая коррекция теперь затрагивает все группы инвесторов, включая крупнейших держателей Ethereum. Примечательно, что коэффициент нереализованной прибыли для групп китов повсеместно перешел в отрицательную территорию. Кошельки, содержащие от 1000 до 10 000 ETH, показывают коэффициент нереализованной прибыли приблизительно -0,21, в то время как те, у которых от 10 000 до 100 000 ETH, находятся на уровне около -0,18. Даже самая крупная группа — адреса, содержащие более 100 000 ETH — опустилась в отрицательную территорию около -0,08.
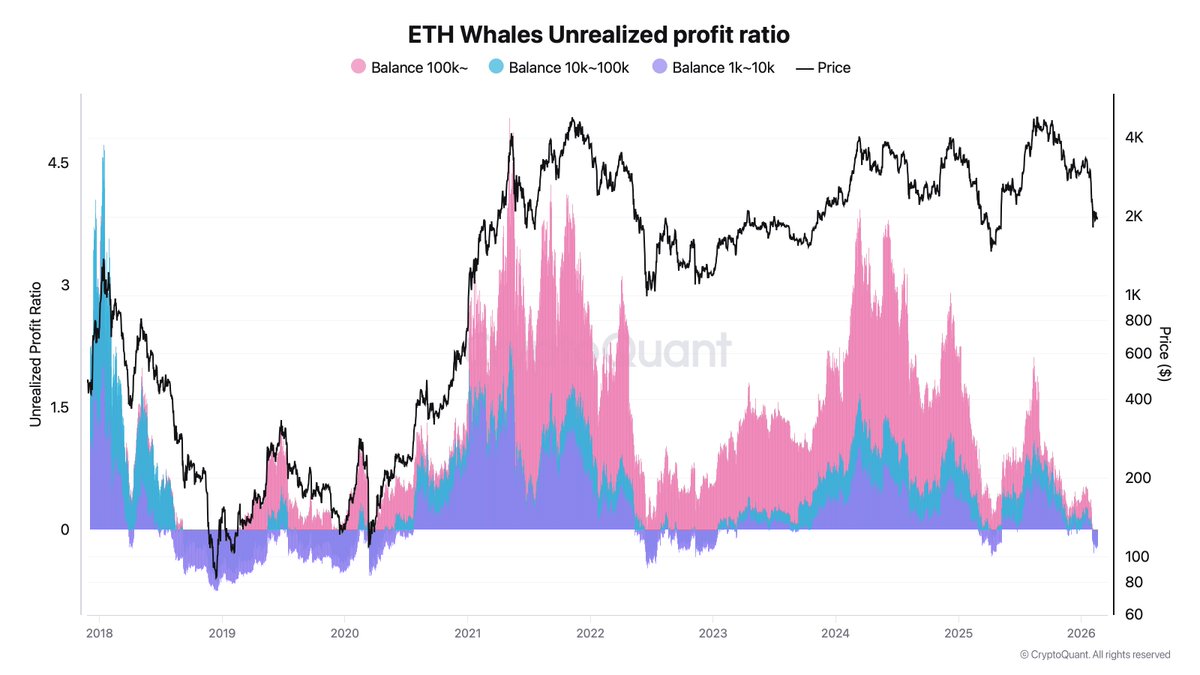
Это развитие событий примечательно, поскольку Ethereum еще не вернулся к своим апрельским минимумам, что говорит о том, что глубина нереализованных убытков расширяется раньше, чем в некоторые предыдущие коррекционные фазы. Такие условия могут повысить чувствительность рынка, поскольку даже традиционно устойчивые держатели могут пересмотреть свои позиции на фоне продолжительной волатильности.
Стресс у китов повышает риск капитуляции, в то время как появляются сигналы формирования дна
Darkfost далее отмечает, что если Ethereum продолжит снижение, крупные держатели могут столкнуться с растущим финансовым давлением. Устойчивое снижение углубило бы нереализованные убытки по всем когортам китов, потенциально вынуждая некоторых участников сокращать экспозицию или ликвидировать часть своих активов. Исторически подобные события капитуляции среди крупных инвесторов tend to усиливают краткосрочную волатильность, особенно когда условия ликвидности уже хрупкие.
Однако, несмотря на отрицательные коэффициенты прибыли, теперь видимые среди групп китов, Ethereum до сих пор удавалось стабилизироваться выше недавних локальных зон поддержки. Эта относительная устойчивость suggests that, хотя настроения остаются осторожными, немедленного крупномасштабного распределения со стороны китов еще не произошло. Это различие важно, потому что одни только нереализованные убытки не обязательно провоцируют продажи, если только они не сопровождаются стрессом ликвидности, давлением leverage или более широкими рыночными потрясениями.
Периоды, когда крупные держатели испытывают стресс, часто совпадали с фазами формирования среднесрочного дна в предыдущих циклах. По мере того как слабые руки выходят, а leverage сокращается, рынки иногда переходят в режимы накопления, характеризующиеся более низкой волатильностью и постепенной стабилизацией.
Тем не менее, к этой интерпретации следует подходить с осторожностью. Позиционирование китов — лишь один элемент структуры рынка, и для подтверждения обычно требуется улучшение ликвидности, более сильный спот-спрос и поддерживающие макроэкономические условия, прежде чем может начаться устойчивое восстановление.
Структура цены Ethereum остается хрупкой ниже ключевых средних
Ethereum продолжает торговаться под явным техническим давлением, причем недельный график показывает устойчивую неспособность решительно вернуть регион $2000. После резкого отскока от максимумов 2025 года near зоны $4800, движение цены перешло в последовательность более низких максимумов и ослабевающих восстановлений, что обычно ассоциируется с коррекционными фазами рынка, а не с восстановлениями, движимыми накоплением.
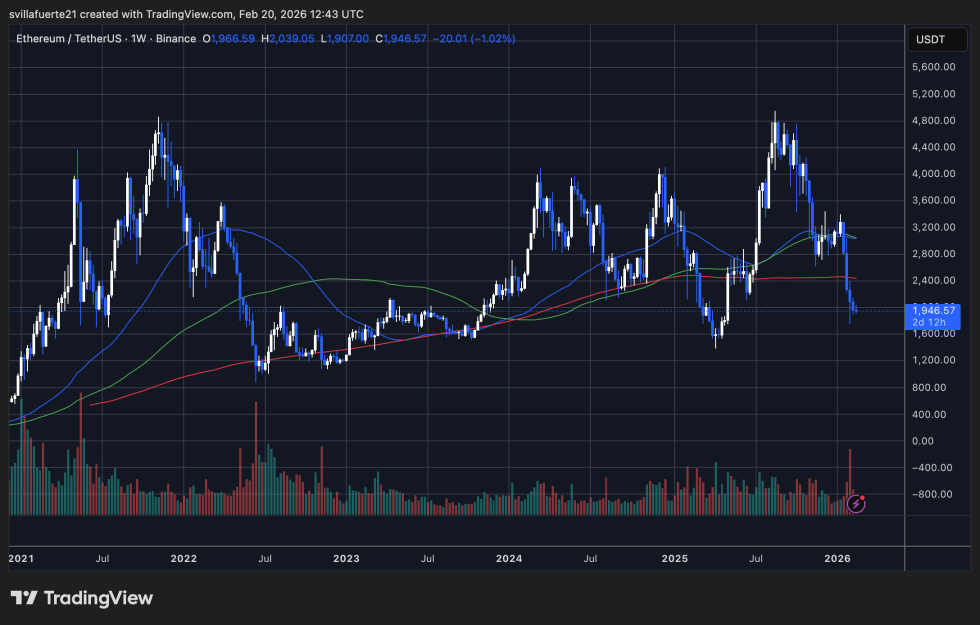
Технически, ETH в настоящее время находится ниже нескольких основных скользящих средних, которые ранее действовали как динамическая поддержка. Эти уровни теперь функционируют как сопротивление, ограничивая попытки роста, если только не произойдет сильное восстановление с расширяющимся объемом. Недавнее снижение к области $1900 отражает сохраняющееся давление продаж, в то время как repeated неудачи near диапазона середины $2000 подкрепляют осторожные рыночные настроения.
Активность объема снизилась по сравнению с фазой импульсного ралли, что указывает на снижение спекулятивного участия. Хотя снижение объема во время коррекций can sometimes сигнализировать об истощении продавцов, подтверждение стабилизации обычно requires устойчивый интерес покупателей, а не временные восстановления.
С структурной точки зрения, ближайшая поддержка, по-видимому, сосредоточена near недавних локальных минимумов around региона $1800, в то время как сопротивление остается сгруппированным между примерно $2200 и $2600. Пока Ethereum не вернет эти уровни убедительно, более широкий технический outlook остается уязвимым, причем консолидация или дальнейшее снижение все еще plausible.
Featured image from ChatGPT, chart from TradingView.com