Measuring Market Asymmetry: The Glassnode Skew Index

insights.glassnodeDipublikasikan tanggal 2025-12-11Terakhir diperbarui pada 2025-12-11

Abstrak

The Glassnode Skew Index is a new metric designed to measure market asymmetry by aggregating information across the entire volatility smile, rather than relying on the traditional 25-delta skew which only samples two points. It condenses the volatility curve into two components: DownVol (volatility from OTM puts, indicating downside protection and fear) and UpVol (volatility from OTM calls, reflecting bullish sentiment and upside speculation). The index is calculated as UpVol minus DownVol. Positive values suggest optimism and call buying dominance, while negative values indicate hedging and risk aversion. It helps identify sentiment regimes, confirm or contradict price movements, and analyze different tenors for layered market outlooks. Available for multiple assets and tenors, it provides a standardized, cross-exchange view of options market sentiment.

When assessing options markets, one of the most powerful signals is skew: how the market prices risk on the upside versus the downside. The standard approach for traders is to look at the 25-delta skew: a simple comparison between the implied volatility of a 25-delta call and a 25-delta put. This method is effective, simple and familiar, but it samples only two points on the volatility curve. As a result, it often misses structure embedded in the rest of the surface.

The Glassnode Skew Index addresses this by aggregating information across the full smile, producing a more robust signal of where risk is being priced. We explain the purpose of the new metric, how it is constructed, and how it can fit into the broader toolkit of options analysis.

To access the new metrics visit Glassnode Studio. Available to Professional plan users.

View metric

Introducing the Glassnode Skew Index

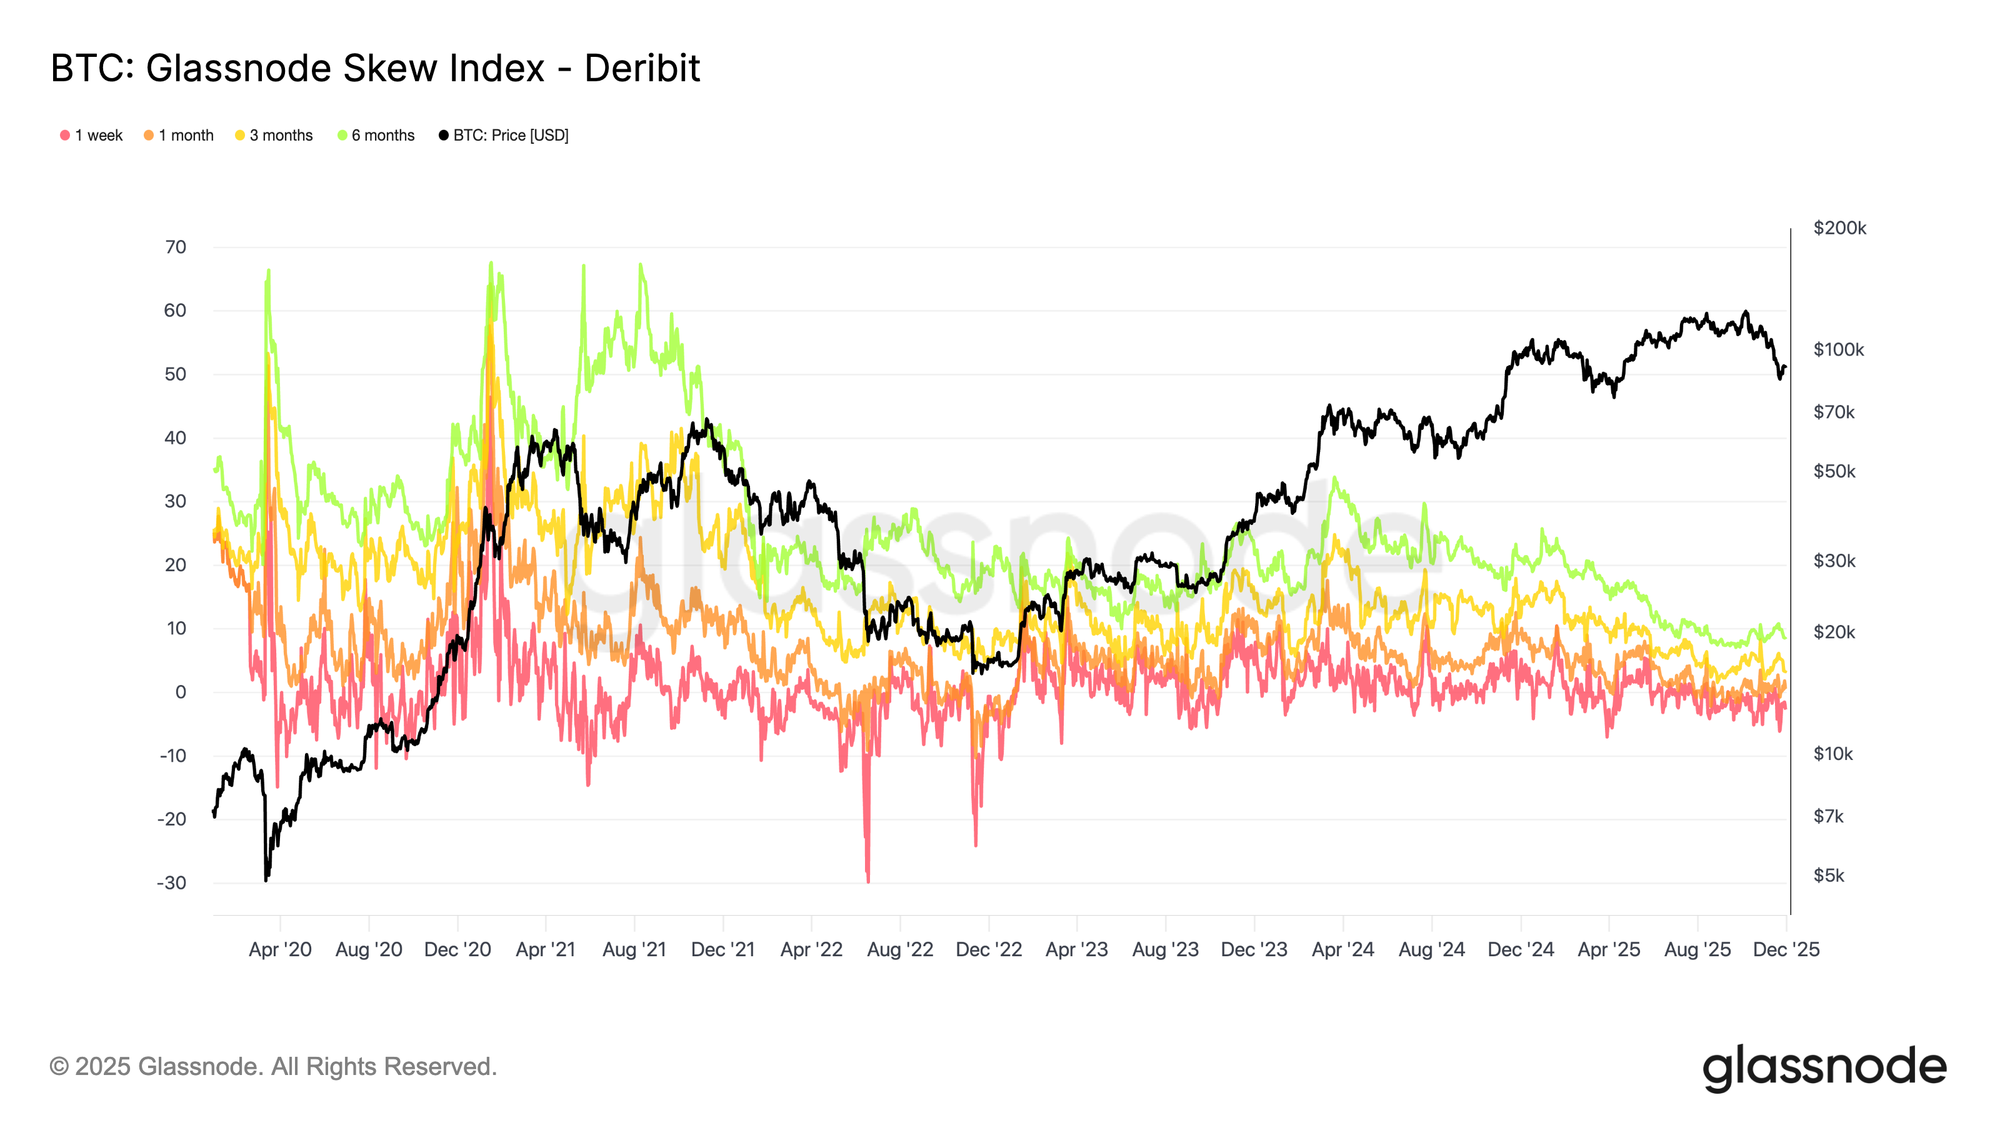
Instead of focusing on two isolated strikes, the Glassnode Skew Index condenses the entire shape of the volatility smile into a single, intuitive measure of market asymmetry.

We divide the curve into two regions: one representing downside risk, and one representing upside potential. Each region is transformed into a standardized volatility measure as we calculate how much volatility the market is pricing into that segment.

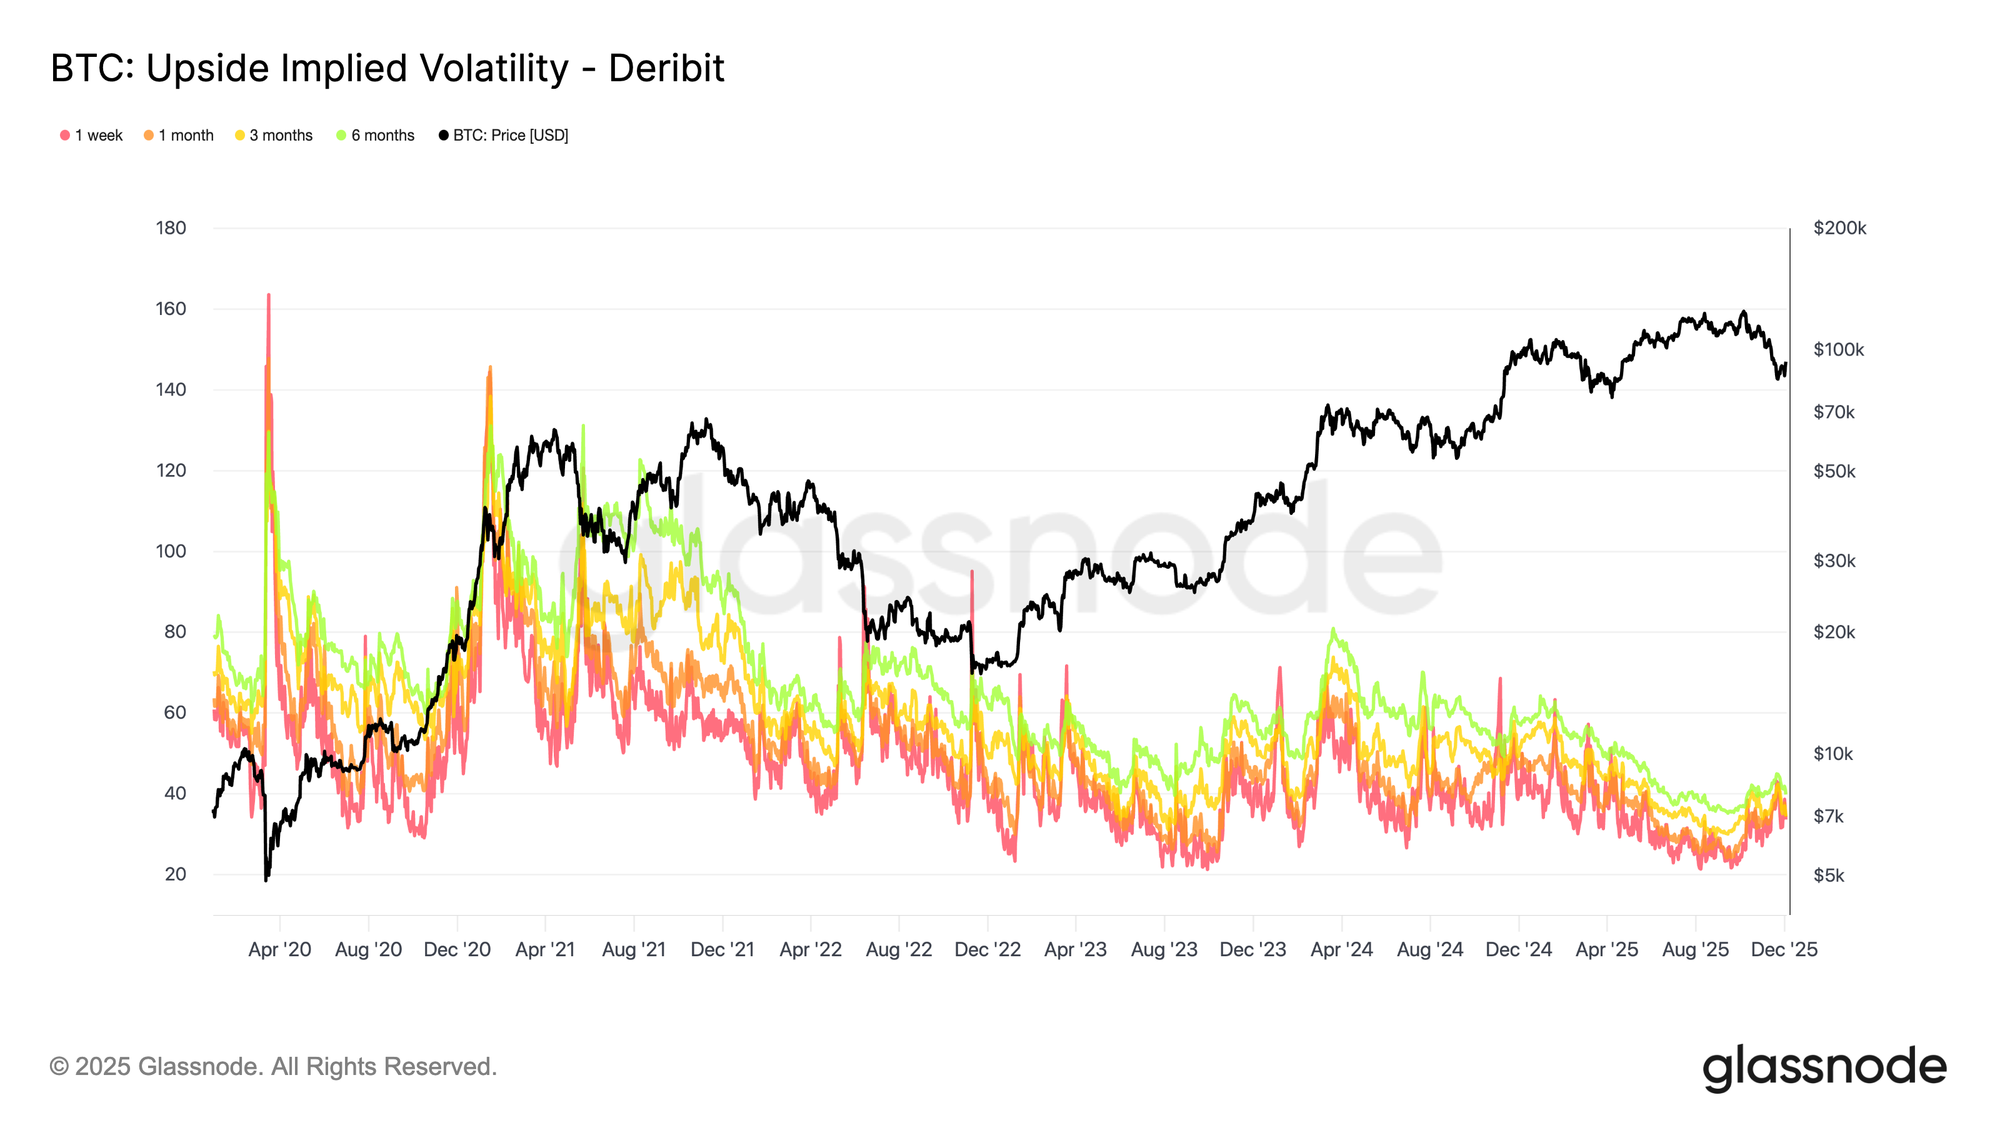
  • DownVol represents the total implied volatility from out-of-the-money put options — protection against falling prices. When traders rush to buy puts, DownVol rises, signalling fear or a desire to hedge.
  • UpVol captures the opposite: the total volatility priced into out-of-the-money call options. This reflects how much traders are willing to pay for upside exposure or potential short-squeeze gains. When call demand increases, UpVol rises, often alongside strong bullish sentiment.

The difference between these two components gives us the skew index: Glassnode Skew Index = UpVol - DownVol

  • Positive values indicate a market that’s paying more for upside volatility – typically driven by optimism, momentum, or speculative call buying.
  • Negative values mean downside protection dominates, as investors prioritize safety and hedging over chasing upside.

In practical terms, The Glassnode Skew Index shows whether option traders are more concerned about a crash down, or more excited about a breakout up – and by how much.
How to Use the Skew Index

The Skew Index can be applied in several ways to interpret options market positioning, identify sentiment regimes, and understand how traders are distributing risk across upside and downside scenarios.

Map the Current Sentiment Regime

The index can help contextualize prevailing market conditions:

  • Deeply negative values indicate a market that is paying a premium for downside protection, consistent with defensive positioning.
  • Strongly positive values indicate that investors are paying more for upside participation, often in the context of strong trends and speculative call activity.

Monitoring these extremes helps identify when fear or euphoria dominates the options market.

Use it as a Confirmation or Divergence Tool

The index can complement movements in spot price:

  • A rising Skew Index alongside a rising spot price suggests that the options market is reinforcing the move through increased demand for upside volatility.
  • A rally in spot with a Skew Index that stays sharply negative points to a distrusted move, where traders remain hedged and cautious.
  • A falling market with a heavily negative Skew Index confirms a classic risk-off environment with significant demand for protection.
  • A falling market with a positive Skew Index can indicate that traders are already looking through the weakness and positioning for a recovery.

This makes the index useful for evaluating whether options flows validate or contradict price action.

Interpreting Tenor Combinations

Different tenors can convey different layers of sentiment:

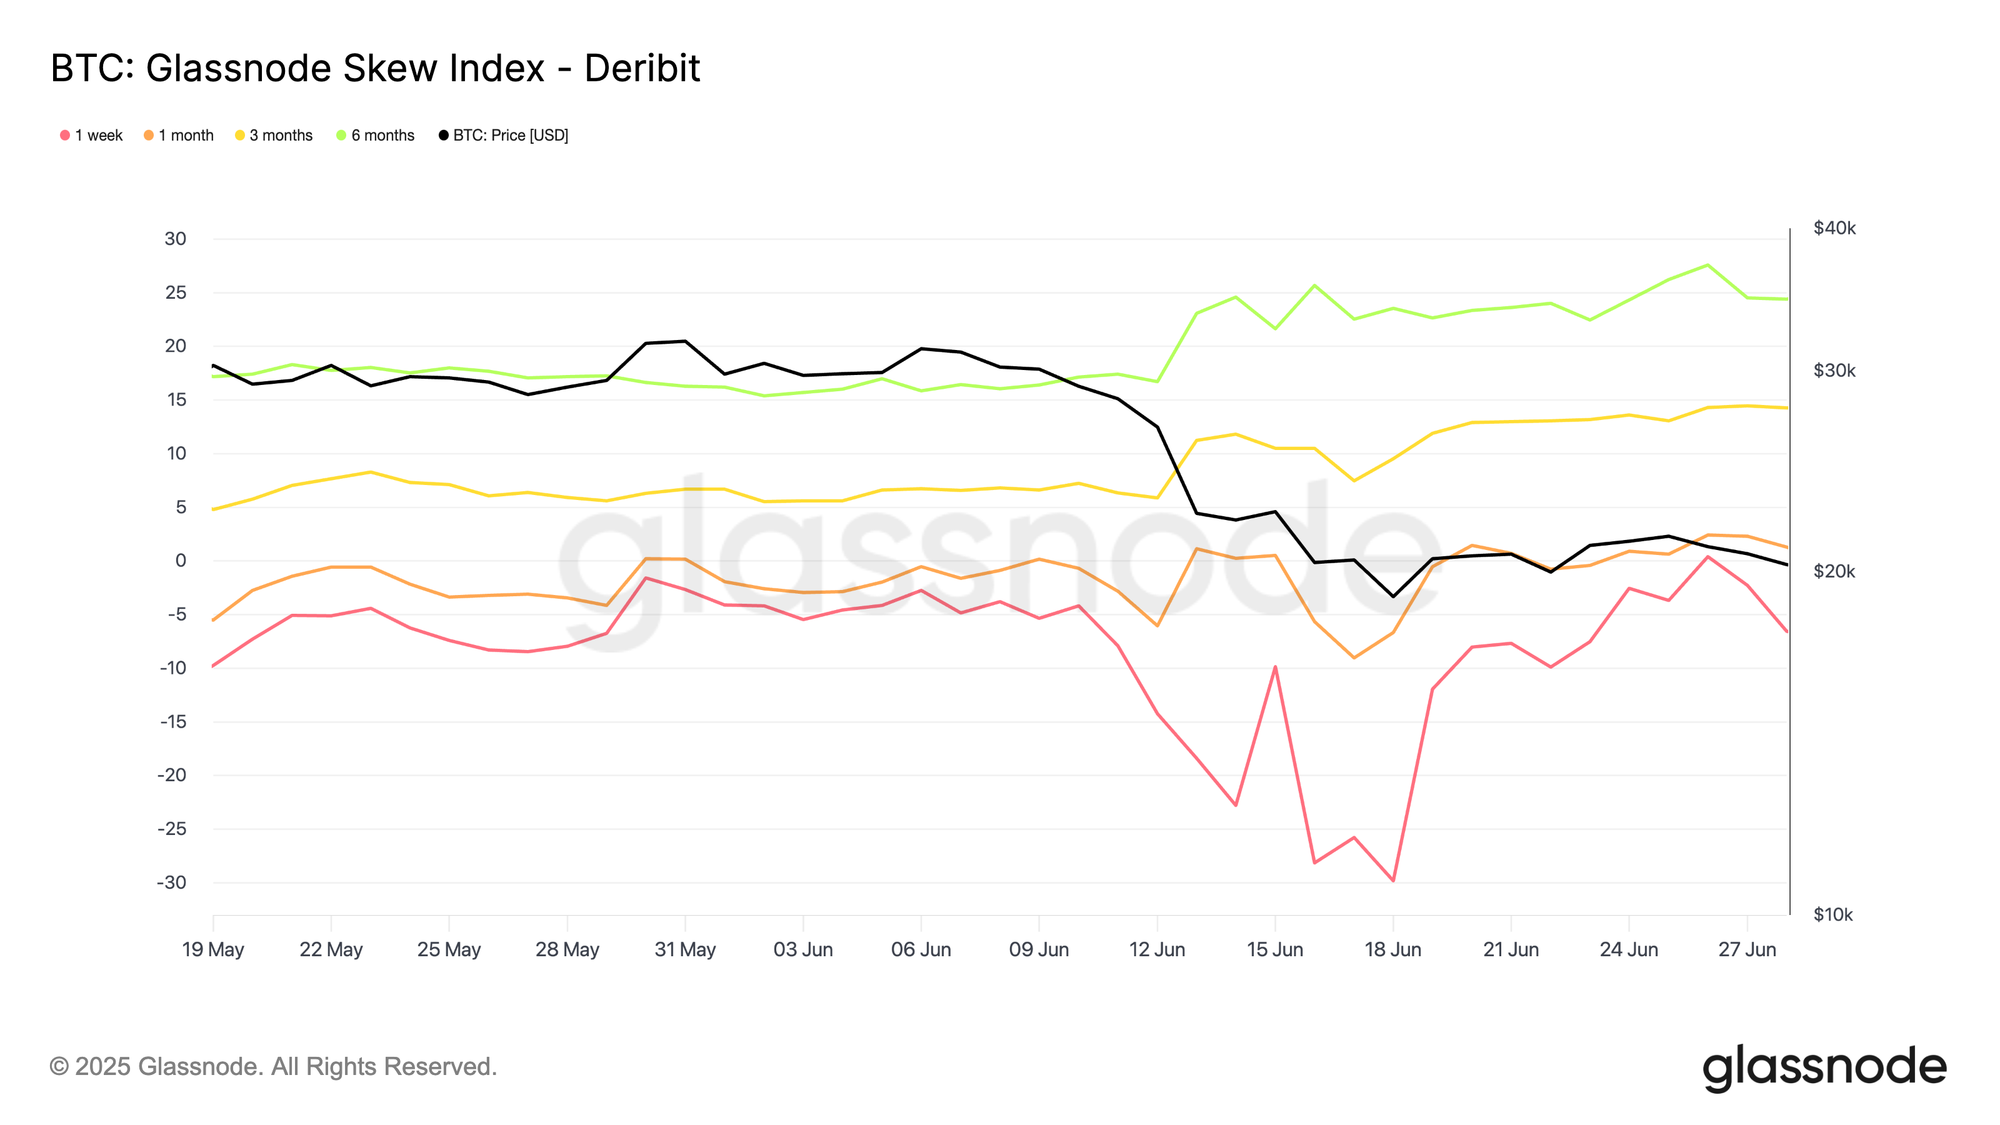
  • A negative 1-week skew with neutral or positive 3- and 6-month values often indicates temporary stress overlaying a constructive medium- and long-term outlook.
  • A very positive 1-week skew with subdued longer tenors suggests that traders are enthusiastic about the near-term, but reluctant to extend risk far into the future.
  • When skew is consistently elevated or depressed across all tenors, it points to a stable, regime-like sentiment environment rather than a short-lived spike.

For example, in June 2022, we saw a clear tenor divergence: the 1-week Skew Index (red) plunged into deeply negative territory, signalling aggressive demand for short-dated puts over calls. Meanwhile, the 3-month (yellow) and 6-month (green) skews moved higher, indicating that investors were still willing to pay relatively more for upside exposure further out the curve.

In other words, the fear was mainly short-term, and longer-dated options continued to lean towards upside scenarios, implying that many participants expect better prices further out on the horizon.
How it works under the hood

We calculate the Glassnode Skew Index by aggregating option prices across many strikes on both sides of the distribution. These prices are transformed into standardized measures of upside and downside implied volatility, aligned to fixed maturities such as 1 week, 1 month, 3 months, and 6 months.

We then combine data across major venues so traders can compare BTC, ETH, SOL, XRP, or PAXG on consistent terms. This standardization removes the distortions that arise from strike irregularities, liquidity gaps, or exchange-specific conventions.

The result is a cross-asset, cross-tenor gauge of options market sentiment that captures the full structure of the volatility smile rather than relying on a single-point skew measure.

Available for:

  • Resolutions: 10 minutes, hourly, daily
  • Tenors: 1 week, 1 month, 3 months, 6 months
  • Assets: BTC, ETH, SOL, XRP, PAXG
  • Exchanges: Deribit, OKX

  • Follow us on X for timely market updates and analysis
  • Join our Telegram channel for regular market insights
  • For on-chain metrics, dashboards, and alerts, visit Glassnode Studio

Disclaimer: This report is for informational and educational purposes only. The analysis represents a limited case study with significant constraints and should not be interpreted as investment advice or definitive trading signals. Past performance patterns do not guarantee future results. Always conduct thorough due diligence and consider multiple factors before making investment decisions.


Kripto yang Sedang Tren

Bacaan Terkait

Iran Sebut "Saat Ini Tidak Ada Negosiasi Apapun Antara Iran dan AS", Trump Ungkap "Sedang Ditangani Secara Diam-diam"

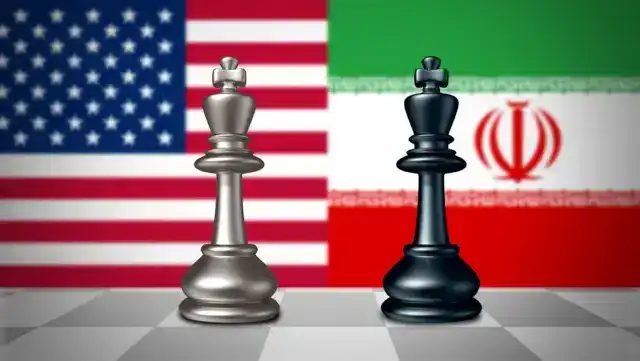
Presiden AS Donald Trump menyatakan pihaknya sedang menangani masalah Iran dengan "pendekatan tenang", sementara Menteri Luar Negeri Iran Hossein Amirabdollahian menegaskan tidak ada negosiasi langsung yang sedang berlangsung antara kedua negara. Kedua pihak memberikan pernyataan yang bertolak belakang mengenai status pembicaraan. Trump menyebut AS sedang melakukan "negosiasi setengah" dengan Iran, menekankan tekanan ekonomi sebagai alat untuk memaksa perubahan perilaku Tehran. Ia menggambarkan situasi saat ini seperti "permainan catur" dan menyarankan preferensi untuk memperketat sanksi ekonomi daripada eskalasi militer lebih lanjut. Di sisi lain, Iran menuduh AS melanggar memorandum penghentian permusuhan yang disepakati Juni lalu, dan menuntut perbaikan pelanggaran tersebut sebagai prasyarat untuk kembali bernegosiasi. Iran juga mengajukan enam syarat keras untuk membuka kembali Selat Hormuz, termasuk penghentian semua ancaman, penarikan pasukan AS dari wilayah sekitar, pencabutan sanksi, dan kompensasi kerusakan perang. Meski demikian, Iran melaporkan kemajuan dalam pembicaraan teknis dengan Oman untuk menetapkan jalur pelayaran baru di Selat Hormuz, meski menekankan bahwa kesepakatan tersebut tidak berarti pembukaan kembali selat secara penuh. Ketegangan regional terus berlanjut dengan serangan Houthi ke fasilitas minyak Arab Saudi, sementara di internal AS, tekanan mulai muncul dari kalangan militer yang mencari jalan keluar dari konflik yang telah menguras persediaan rudal pertahanan.

marsbit3m yang lalu

Iran Sebut "Saat Ini Tidak Ada Negosiasi Apapun Antara Iran dan AS", Trump Ungkap "Sedang Ditangani Secara Diam-diam"

marsbit3m yang lalu

Setelah Tiga Tahun Berturut-turut Mengurangi Saham, Buffett Akhirnya Bertindak

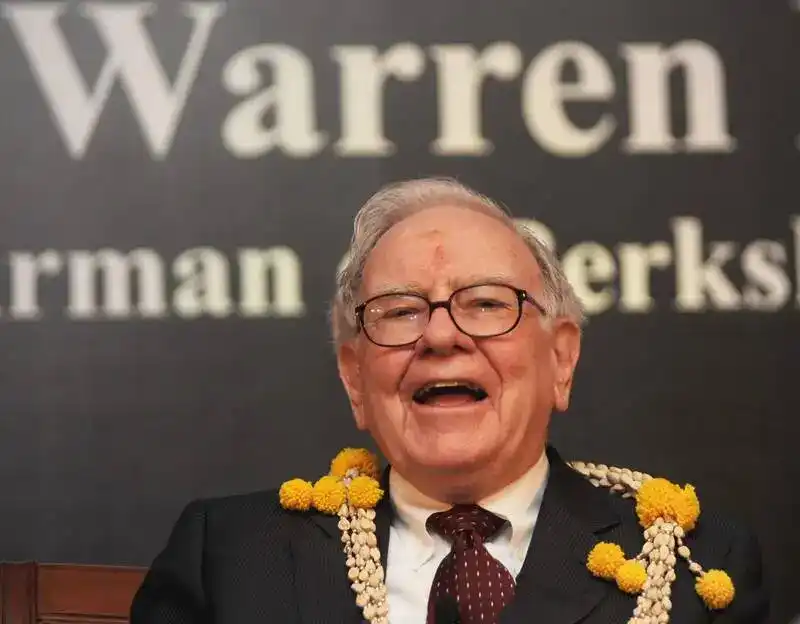
Setelah tiga tahun mengurangi posisi saham, Warren Buffett akhirnya kembali bertindak. Berkshire Hathaway mengumumkan laporan kuartal II 2026, menunjukkan peralihan dari penjualan bersih saham selama 14 kuartal menjadi pembelian bersih sebesar hampir $19,8 miliar. Investasi utama kuartal ini adalah penambahan sekitar $10 miliar ke Alphabet (Google), menjadikannya salah satu dari lima saham terbesar Berkshire. Keputusan ini, dibuat di bawah CEO baru Greg Abel, menandakan peningkatan toleransi terhadap sektor teknologi. Berkshire juga melakukan pembelian kembali saham senilai $4,527 miliar setelah dua tahun. Cadangan kas dan obligasi pemerintah AS jangka pendek Berkshire turun menjadi sekitar $364,7 miliar dari rekor hampir $400 miliar, karena aktivitas investasi dan akuisisi. Selama beberapa tahun terakhir, Berkshire dikritik karena "ketinggalan zaman" dan tidak ikut tren AI dan semikonduktor. Namun, perusahaan mempertahankan disiplin nilai investasinya, menunggu dengan sabar sambil mengumpulkan kas. Strategi ini terbukti ketika gejolak pasar mereda dan harga aset kembali wajar, memungkinkan Berkshire membeli dengan keyakinan saat orang lain panik. Laporan tersebut menegaskan kembali filosofi Buffett: kinerja investasi kuartalan seringkali tidak berarti, dan kesuksesan jangka panjang bergantung pada disiplin, kesabaran, dan kemampuan untuk bertindak ketika peluang muncul.

marsbit14m yang lalu

Setelah Tiga Tahun Berturut-turut Mengurangi Saham, Buffett Akhirnya Bertindak

marsbit14m yang lalu

Setelah Tiga Tahun Berturut-turut Mengurangi Posisi Saham, Akhirnya Buffett Bertindak

Setelah tiga tahun terus mengurangi portofolio saham, Berkshire Hathaway akhirnya beralih ke pembelian bersih pada kuartal II 2026. Perusahaan melaporkan pembelian saham senilai $234,7 miliar dan penjualan $36,9 miliar, menghasilkan pembelian bersih sekitar $198 miliar. Langkah terbesar kuartal ini adalah investasi tambahan $10 miliar melalui penempatan privat ke Alphabet (induk perusahaan Google), menjadikannya salah satu dari lima saham utama dalam portofolio Berkshire. Investasi ini, diputuskan bersama CEO Greg Abel, menandakan peningkatan toleransi terhadap sektor teknologi di bawah kepemimpinan baru. Berkshire juga melakukan buyback saham senilai $4,527 miliar pada kuartal ini, yang pertama dalam dua tahun, dan melanjutkannya dengan tambahan $3,3 miliar di bulan Juli. Aktivitas investasi dan buyback ini mulai mengurangi cadangan kas perusahaan yang sebelumnya mencapai rekor hampir $4 triliun, menjadi sekitar $364,7 miliar per 30 Juni. Selama beberapa tahun terakhir, Berkshire dikritik karena tampak melewatkan demam AI dan boom semikonduktor, mempertahankan kas dalam jumlah besar sambil menunggu. Laporan kuartalan menegaskan prinsipnya bahwa keuntungan atau kerugian investasi dalam satu kuartal seringkali tidak berarti. Strategi menunggu ini memberinya margin keamanan dan kemampuan untuk berinvestasi ketika aset berkualitas kembali ke harga wajar setelah koreksi pasar, mengonfirmasi disiplin investasi jangka panjang Warren Buffett.

Odaily星球日报21m yang lalu

Setelah Tiga Tahun Berturut-turut Mengurangi Posisi Saham, Akhirnya Buffett Bertindak

Odaily星球日报21m yang lalu

Trading

Spot

Artikel Populer

Cara Membeli ONE

Selamat datang di HTX.com! Kami telah membuat pembelian Harmony (ONE) menjadi mudah dan nyaman. Ikuti panduan langkah demi langkah kami untuk memulai perjalanan kripto Anda.Langkah 1: Buat Akun HTX AndaGunakan alamat email atau nomor ponsel Anda untuk mendaftar akun gratis di HTX. Rasakan perjalanan pendaftaran yang mudah dan buka semua fitur.Dapatkan Akun SayaLangkah 2: Buka Beli Kripto, lalu Pilih Metode Pembayaran AndaKartu Kredit/Debit: Gunakan Visa atau Mastercard Anda untuk membeli Harmony (ONE) secara instan.Saldo: Gunakan dana dari saldo akun HTX Anda untuk melakukan trading dengan lancar.Pihak Ketiga: Kami telah menambahkan metode pembayaran populer seperti Google Pay dan Apple Pay untuk meningkatkan kenyamanan.P2P: Lakukan trading langsung dengan pengguna lain di HTX.Over-the-Counter (OTC): Kami menawarkan layanan yang dibuat khusus dan kurs yang kompetitif bagi para trader.Langkah 3: Simpan Harmony (ONE) AndaSetelah melakukan pembelian, simpan Harmony (ONE) di akun HTX Anda. Selain itu, Anda dapat mengirimkannya ke tempat lain melalui transfer blockchain atau menggunakannya untuk memperdagangkan mata uang kripto lainnya.Langkah 4: Lakukan trading Harmony (ONE)Lakukan trading Harmony (ONE) dengan mudah di pasar spot HTX. Cukup akses akun Anda, pilih pasangan perdagangan, jalankan trading, lalu pantau secara real-time. Kami menawarkan pengalaman yang ramah pengguna baik untuk pemula maupun trader berpengalaman.

759 Total TayanganDipublikasikan pada 2024.12.12Diperbarui pada 2026.06.02

Cara Membeli ONE

Diskusi

Selamat datang di Komunitas HTX. Di sini, Anda bisa terus mendapatkan informasi terbaru tentang perkembangan platform terkini dan mendapatkan akses ke wawasan pasar profesional. Pendapat pengguna mengenai harga ONE (ONE) disajikan di bawah ini.

活动图片