Solana vs. Ethereum: Assessing if SOL/ETH could reclaim 0.05 in Q2

ambcrypto发布于2026-03-29更新于2026-03-29

文章摘要

Solana has surpassed Ethereum in all-time unique developers, with 10,864 developers—nearly 20% more than Ethereum. This strong developer engagement is driving on-chain activity, as reflected in Solana’s leading DEX volumes across all timeframes. Stablecoin adoption is also accelerating, with USD1 supply surging from $160 million to $850 million in 60 days. Technically, the SOL/ETH ratio has held key consolidation around 0.04, maintaining a critical support level on weekly timeframes. With Solana’s expanding network fundamentals—including high liquidity and developer growth—a breakout above the 0.05 resistance could position SOL to outperform ETH in Q2.

A blockchain network’s long-term growth is closely tied to the size of its developer ecosystem.

The logic is simple: the more developers building on a network, the faster it churns out infrastructure upgrades. That, in turn, brings more users to the L1, boosts on-chain activity, and drives up the network’s overall value. In other words, developer engagement is the engine that powers sustainable growth.

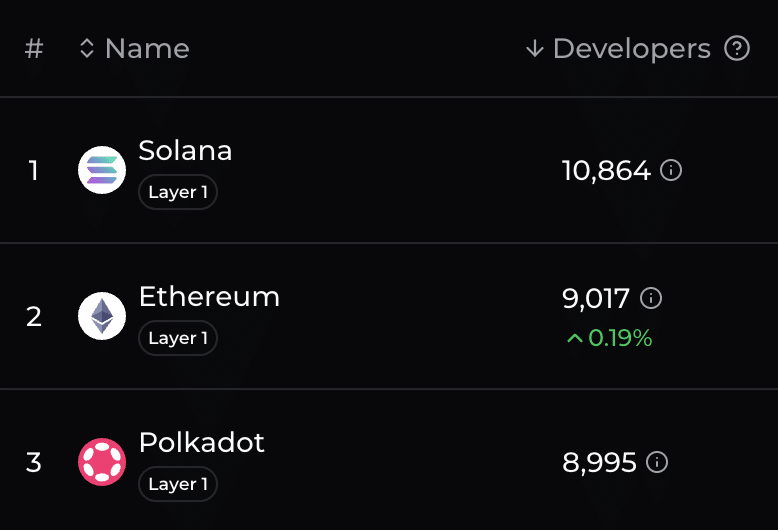
In this context, Solana’s [SOL] recent milestone is noteworthy. As the chart below shows, Solana has now surpassed Ethereum [ETH] in all-time unique developers, leading all chains with 10,864 developers, almost 20% more than Ethereum. Notably, the effects of this growth seem to be playing out in real time.
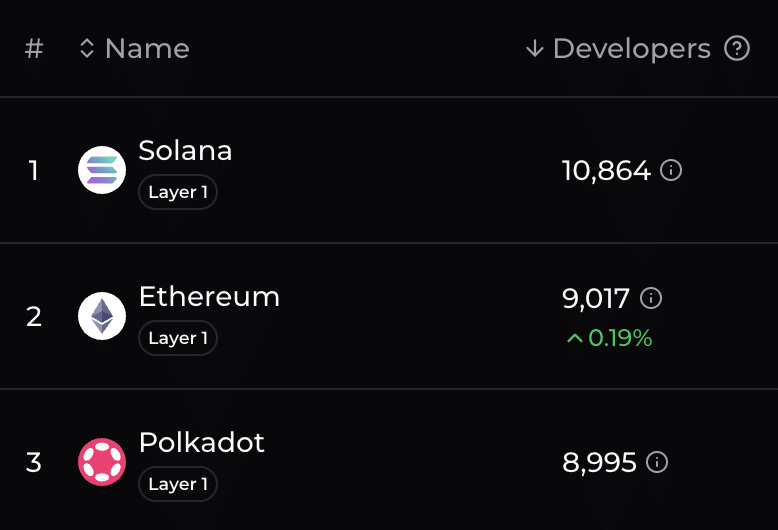
Source: Chainspect

One way to see this is through decentralized exchange (DEX) volume, a key indicator of on-chain activity. For context, DEX volume measures how actively users are transacting within the network, giving a direct view of adoption and liquidity. Higher volumes, therefore, signal that the network is being actively used.

According to DeFiLlama, Solana’s DEX volume now outpaces all other blockchains across every timeframe. When you combine this with the surge in developer activity, it’s clear that this isn’t happening by chance. Strong developer engagement reflects solid network fundamentals, which in turn drives more on-chain usage, creating a reinforcing cycle of growth and adoption.

Against this backdrop, stablecoin adoption on Solana is starting to carry real weight. USD1 supply on the network jumped from $160 million to $850 million in just 60 days, consistently seeing $200-$300 million in daily volume. At the same time, USDC continues its minting spree on the network, fueling on-chain activity and directly complementing Solana’s rising developer engagement.

SOL/ETH under the spotlight

A high stablecoin supply and strong DEX volume together reinforce Solana’s network fundamentals.

The logic is straightforward: High on-chain liquidity enables smoother transactions, supports new applications, and attracts both developers and users, creating a feedback loop that strengthens the overall ecosystem. In this context, SOL’s undervaluation versus ETH comes back into focus.

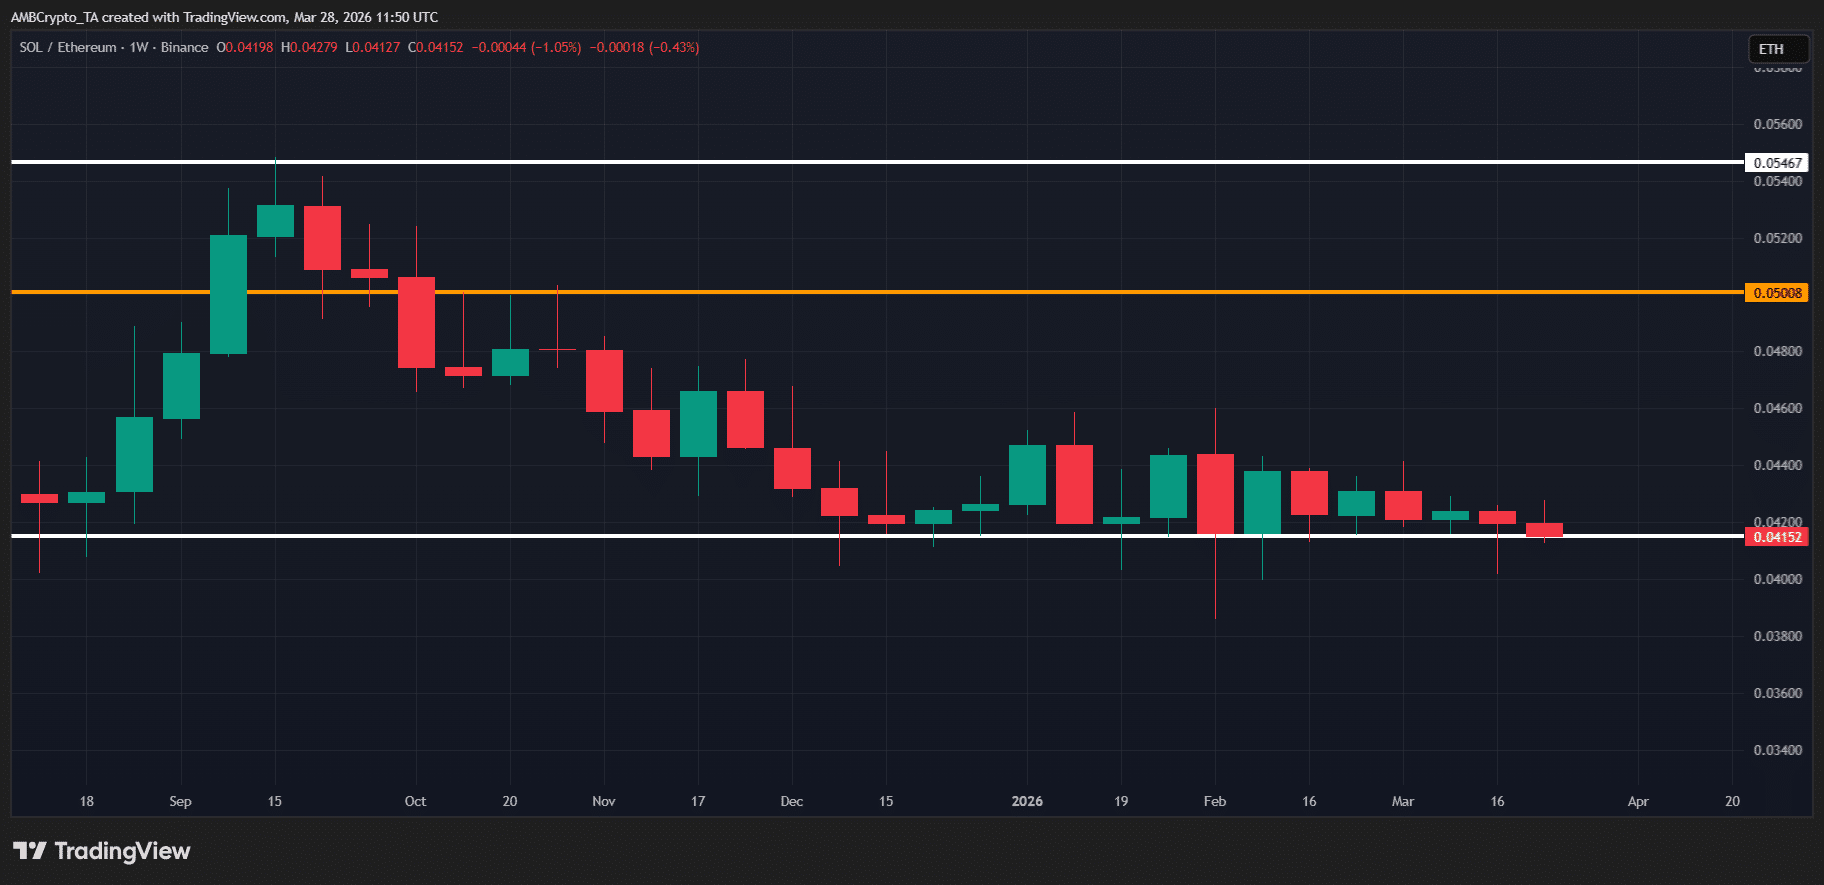
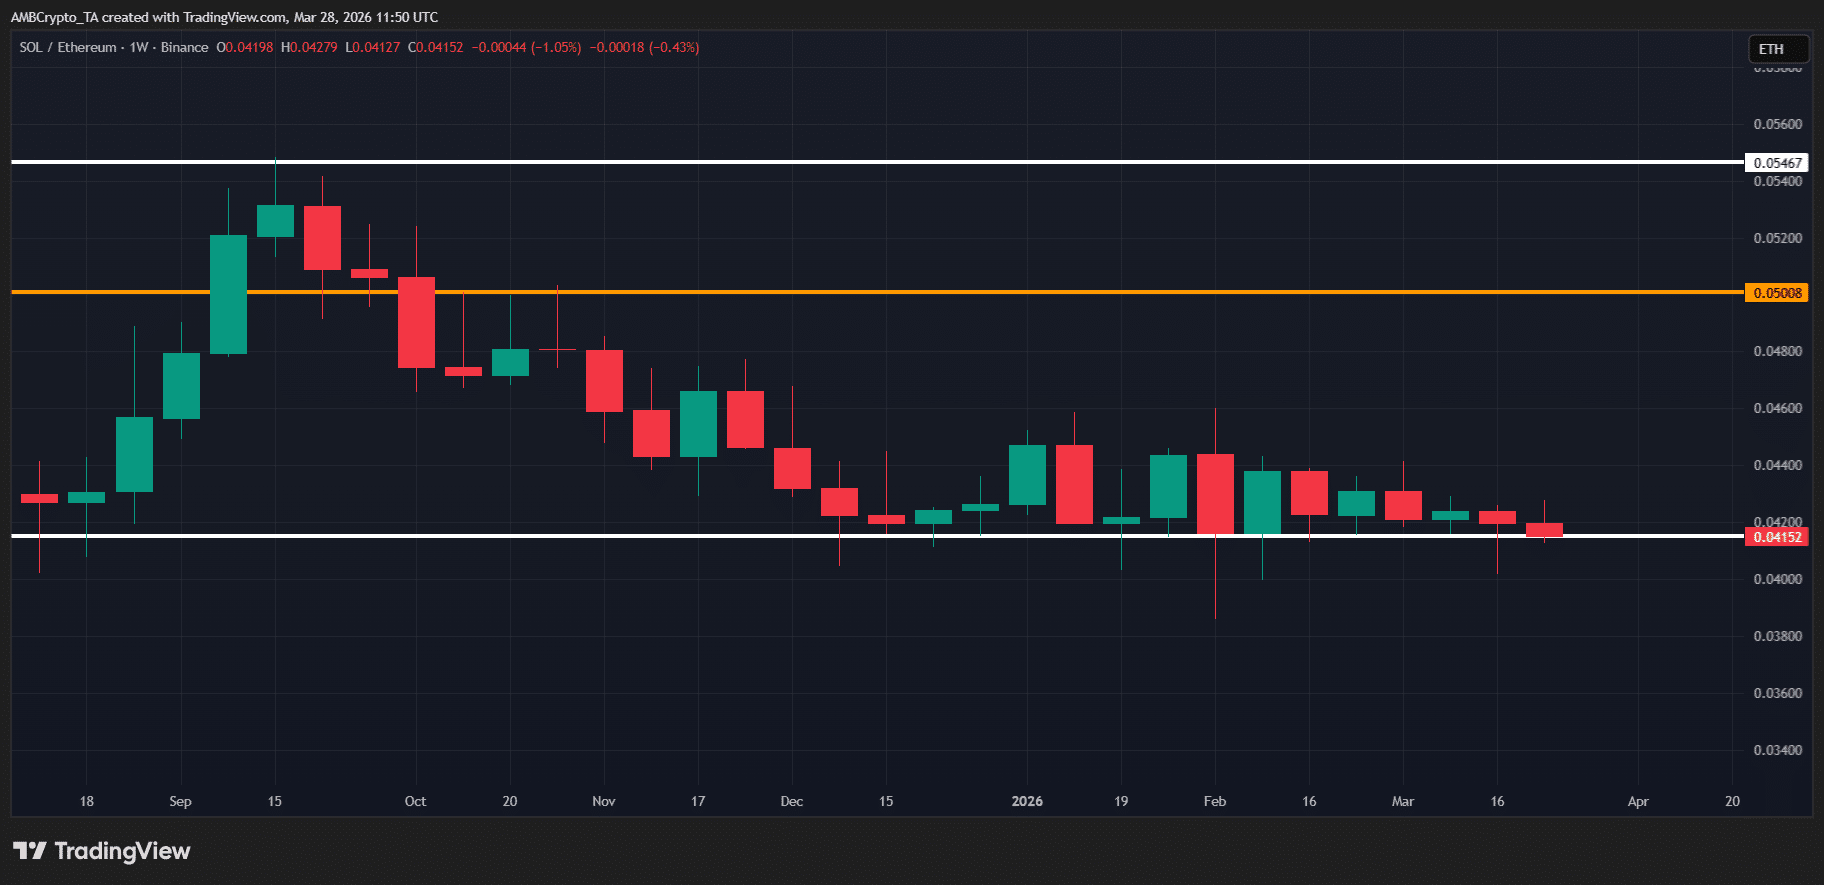
From a technical perspective, this aligns with price action. Since dropping below 0.05 after last October’s crash, the SOL/ETH ratio has struggled to reclaim that level. With network activity continuing to expand, a breakout past this key resistance zone could set the stage for Solana’s technical outperformance.
Source: TradingView (SOL/ETH)

On the bullish note, the ratio has been consolidating around 0.04.

Why does this matter? On the weekly timeframe, the SOL/ETH ratio hasn’t once closed below this range, reinforcing the strength of this support zone. According to AMBCrypto, this is where Solana’s edge over Ethereum in developer count comes into play, as this advantage is directly feeding into SOL’s network strength relative to ETH.

If this trend holds, it could pave the way for a breakout, positioning SOL to outperform ETH in Q2.


Final Summary

  • Solana now leads Ethereum in all-time unique developers, driving on-chain activity, DEX volume, and stablecoin adoption.
  • The SOL/ETH ratio is holding key support around 0.40, and combined with Solana’s growing network activity, a breakout could position SOL to outperform ETH.


热门币种推荐

相关问答

QWhat key metric does Solana now lead Ethereum in, according to the article?

ASolana now leads Ethereum in all-time unique developers, with 10,864 developers, which is almost 20% more than Ethereum.

QWhat is the significance of high DEX volume and stablecoin supply for a blockchain network?

AHigh DEX volume indicates active user transactions and on-chain activity, while a high stablecoin supply provides liquidity. Together, they reinforce network fundamentals by enabling smoother transactions, supporting new applications, and attracting developers and users, creating a positive feedback loop for ecosystem growth.

QWhat is the critical support level for the SOL/ETH ratio mentioned in the analysis?

AThe critical support level for the SOL/ETH ratio is around 0.04, as it has not closed below this range on the weekly timeframe, indicating a strong support zone.

QWhat recent milestone in stablecoin adoption on Solana is highlighted as evidence of its growing network strength?

AThe supply of USD1 on Solana jumped from $160 million to $850 million in just 60 days, with daily volumes consistently ranging between $200-$300 million, demonstrating significant growth in stablecoin adoption.

QBased on the article's analysis, what could a breakout above the key resistance zone mean for SOL's performance against ETH?

AA breakout past the key resistance zone (reclaiming the 0.05 level) could set the stage for Solana's technical outperformance, potentially positioning SOL to outperform ETH in Q2, especially given its strong developer engagement and network activity.

你可能也喜欢

意大利央行未发现稳定币在汇款中存在系统性优势

意大利银行的一项研究显示,稳定币在跨境汇款中并未展现出持续的成本与速度优势。其潜在优势被法币出入金手续费以及本地支付基础设施的处理流程所抵消。 研究比较了通过200 USDC在意大利与巴西、阿根廷、日本、阿联酋和南非等10条双向通道进行汇款的成本与结算时间,并与标准汇款服务进行对比。 结果显示,稳定币转账的总成本在0.3%到近9%之间波动,具体取决于汇款方向。在具备即时支付系统的通道中,结算可在20分钟内完成;若缺乏此类基础设施,则需一至两个工作日。 主要成本和延迟源于货币兑换以及当地基础设施的质量。区块链网络手续费并非主要因素。 尽管在大多数研究通道中,稳定币成本低于世界银行统计的全球平均汇款成本(6.65%),但与传统汇款服务商Wise相比,仅在七条可比通道中的三条具备成本优势。 研究者认为,若稳定币能直接用于商品服务消费而无需兑换成当地货币,其优势将更为明显。同时指出,禁令性监管无法消除市场对稳定币的需求,而过严的规则只会增加零售用户的使用难度。 此外,报告提及,稳定币总市值在7月已从5月峰值下跌超100亿美元,至约3100亿美元,创下自2022年5月Terra崩溃以来的最大月度跌幅。

cryptonews.ru1小时前

意大利央行未发现稳定币在汇款中存在系统性优势

cryptonews.ru1小时前

比特币热潮正酣:塞勒尔新声明引发关于购买的猜测

纳斯达克上市公司MicroStrategy(代码:MSTR)的执行董事长迈克尔·塞勒于8月2日发布信息“Bitcoin Drive engaged”(比特币驱动已启动),再次引发市场对于该公司将在周一宣布新一轮比特币购买的猜测。其周日的帖子附带了该公司惯用的购买追踪图表,这符合塞勒通常在每周财报发布前暗示其金库变动的做法。 塞勒的附图报告显示,MicroStrategy的比特币储备为843,775枚BTC,市值约532.5亿美元。平均购买成本为每枚75,653美元,未实现亏损为105.8亿美元(-16.58%)。截至8月2日,累计进行了113次购买操作。 此前在7月27日,类似的周日信号曾预告了公司的公告,当时塞勒发文称“我们还需要一种颜色”,随后MicroStrategy披露了其更大的现金储备。这种时间上的巧合强化了市场对周一将发布新金库状况公告的预期。 然而,该公司实时账本显示,在最近两次共计出售3,588枚BTC(包括1,363枚和2,225枚)后,其比特币储备已从847,363枚降至843,775枚。根据提交给美国证券交易委员会(SEC)的文件,这些出售是为了资助优先股支付并补充美元储备。最近的报告还显示,在截至7月26日的一周内,MicroStrategy没有购买任何比特币,同时将其美元储备增加至约37.5亿美元,这使其优先股股息和债务利息的预计覆盖期限延长至约2.1年。 财务风险依然高企,该公司报告2026年第二季度运营亏损83.3亿美元,与上年同期140.3亿美元的运营利润形成急剧逆转。这些业绩包含了公司数字资产方面83.2亿美元的未实现亏损,而2025年第二季度为未实现利润140.5亿美元。 管理层还可能通过额外出售比特币获得高达12.5亿美元,以补充用于支付优先股股息和债务利息的美元储备。因此,预计周一的披露将揭示“Bitcoin Drive”信息是否标志着资产积累的恢复,因为MicroStrategy需要在平衡其843,775枚BTC自有储备与不断增长的现金负债和积极的资本管理之间做出抉择。

cryptonews.ru1小时前

比特币热潮正酣:塞勒尔新声明引发关于购买的猜测

cryptonews.ru1小时前

交易

现货

热门文章

加密市场宏观研报:美国“加密货币周”来袭,ETH开启机构军备赛高潮

本周,加密市场迎来两股重磅催化——华盛顿“加密货币周”的立法攻势与以太坊机构布局的密集爆发,共同构成加密行业2025年下半年的“政策拐点”与“资金拐点”。这一轮加密周期的深层逻辑,正从比特币转向以太坊、稳定币及链上金融基础设施。我们认为:美国的政策明朗化+以太坊的机构化扩展,标志着加密行业正进入结构性转正阶段,市场配置的重心亦应逐步从“价格博弈”过渡至“规则+基础设施的制度红利捕捉”。

2.0k人学过发布于 2025.07.17更新于 2025.07.17

加密市场宏观研报:美国“加密货币周”来袭,ETH开启机构军备赛高潮

相关讨论

欢迎来到HTX社区。在这里,您可以了解最新的平台发展动态并获得专业的市场意见。以下是用户对ETH(ETH)币价的意见。

活动图片