Bitcoin Market Structure Points To ‘Ongoing Stress’, Not Final Capitulation – Analyst

bitcoinist发布于2026-02-06更新于2026-02-06

文章摘要

Bitcoin has fallen below the $70,000 threshold, signaling increased selling pressure and market anxiety. Analysts emphasize that price action alone doesn’t define a market bottom; instead, the behavior of long-term holders (LTHs) is a more reliable indicator. Historically, when a significant portion of LTHs face unrealized losses—such as the 95% in 2015, 83% in 2019, 85% in 2022—it often marks late-stage bear markets and potential capitulation. Currently, the LTH risk metric sits at only 37%, well below historical stress levels, suggesting ongoing market strain but not yet full-scale exhaustion. Technically, Bitcoin broke below key support levels, including the 50-week and 100-week moving averages, indicating a structural downtrend rather than a temporary correction. The $70,000 zone has now turned into resistance. If the price fails to reclaim this level, further downside toward the $60,000 region is possible. While the 200-week moving average remains supportive, recent bearish momentum and high-volume sell-offs point to continued distribution and liquidations. The market shows stress but lacks the extreme LTH capitulation typically associated with cycle bottoms.

Trusted Editorial content, reviewed by leading industry experts and seasoned editors. Ad Disclosure

Bitcoin has slipped below the $70,000 level, a move that reflects growing selling pressure and rising market anxiety. The break of this psychological threshold has intensified volatility, with short-term participants reacting quickly to downside momentum. Analysts note that the current environment is defined less by macro headlines and more by internal market structure, particularly the behavior of long-term holders.

According to insights shared by On-chain Mind, Bitcoin price alone rarely defines a market bottom. Instead, the key signal tends to come from holder behavior — specifically, whether long-term investors begin to show signs of stress. Historically, these participants are the least reactive cohort, often absorbing volatility rather than amplifying it through rapid selling.

When long-term holders move into widespread unrealized losses, however, the dynamic changes. Such conditions have frequently coincided with the late stages of bear markets, when conviction weakens and broader capitulation becomes possible. This phase does not guarantee an immediate reversal, but it often signals that structural exhaustion is developing.

Long-Term Holder Risk Still Below Historical Capitulation Levels

On-chain Mind further highlights that long-term holder risk has historically played a decisive role in identifying late-stage bear market conditions. Previous cycles show clear peaks in this metric: roughly 95% in 2015, about 83% in 2019, near 70% during the COVID crash, and around 85% in the 2022 downturn. These spikes typically reflected widespread unrealized losses among long-term investors, signaling deep structural stress across the network.

Bitcoin LTH Risk Metric | Source: On-chain Mind

Historically, once this indicator rises above the 55–60% range, the bottoming process tends to accelerate. At those levels, even the most patient holders begin to experience meaningful pressure, often coinciding with the final phases of capitulation. This does not necessarily mark the exact price low, but it has frequently preceded stabilization and eventual recovery.

Currently, however, the metric sits closer to 37%, well below prior capitulation thresholds. This suggests that while market stress is evident, conditions may not yet reflect the full-scale exhaustion typically associated with durable cycle bottoms. If the pattern of diminishing peaks continues, a move toward the 70% region would indicate that even strong hands are under substantial pressure — historically a prerequisite for a more structural and lasting market low.

Bitcoin Breaks Key Weekly Supports As Downtrend Accelerates

Bitcoin’s weekly structure shows a clear deterioration in momentum after the rejection from the $120K–$125K region, with price now trading near the $69K zone. The latest breakdown pushed Bitcoin decisively below the 50-week moving average (blue) and the 100-week average (green), levels that had previously acted as dynamic support throughout the prior uptrend. Losing both signals a shift from a corrective pullback to a more structural downtrend phase.

BTC consolidates around key level | Source: BTCUSDt chart on TradingView

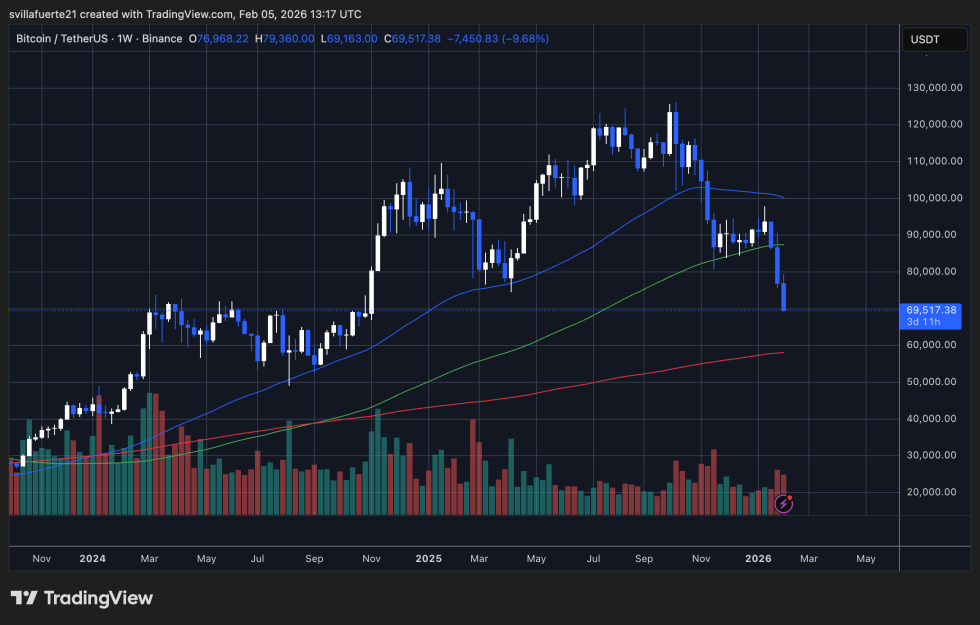
The 200-week moving average (red) remains well below the current price, suggesting the broader macro trend is not yet in deep bear-market territory. However, the speed of the decline and expanding bearish candles indicate aggressive distribution rather than orderly consolidation. Volume spikes accompanying recent downside moves reinforce the interpretation of forced selling and liquidation activity.

From a technical standpoint, the $70K region has transitioned from support into resistance after the breakdown. Failure to quickly reclaim this level would increase the probability of further downside exploration, potentially toward historical demand zones in the low-$60K area. Conversely, stabilization above this region with declining sell volume could signal exhaustion among sellers.

Featured image from ChatGPT, chart from TradingView.com 

Editorial Process for bitcoinist is centered on delivering thoroughly researched, accurate, and unbiased content. We uphold strict sourcing standards, and each page undergoes diligent review by our team of top technology experts and seasoned editors. This process ensures the integrity, relevance, and value of our content for our readers.

Sebastian Villafuerte

Follow

Sebastian's journey into the world of crypto began four years ago, driven by a fascination with the potential of blockchain technology to revolutionize financial systems. His initial exploration focused on understanding the intricacies of various crypto projects, particularly those focused on building innovative financial solutions. Through countless hours of research and learning, Sebastian developed a deep understanding of the underlying technologies, market dynamics, and potential applications of cryptocurrencies. As his knowledge grew, Sebastian felt compelled to share his insights with others. He began actively contributing to online discussions on platforms like X and LinkedIn, focusing on fintech and crypto-related content. His goal was to expose valuable trends and insights to a wider audience, fostering a deeper understanding of the rapidly evolving crypto landscape. Sebastian's contributions quickly gained recognition, and he became a trusted voice in the online crypto community. To further enhance his expertise, Sebastian pursued a UC Berkeley Fintech: Frameworks, Applications, and Strategies certification. This rigorous program equipped him with valuable skills and knowledge regarding Financial Technology, bridging the gap between traditional finance (TradFi) and decentralized finance (DeFi). The certification deepened his understanding of the broader financial landscape and its intersection with blockchain technology. Sebastian's passion for finance and writing is evident in his work. He enjoys delving into financial research, analyzing market trends, and exploring the latest developments in the crypto space. In his spare time, Sebastian can often be found immersed in charts, studying 10-K forms, or engaging in thought-provoking discussions about the future of finance. Sebastian's journey as a crypto analyst and investor has been marked by a relentless pursuit of knowledge and a dedication to sharing his insights. His ability to navigate the complex world of crypto, combined with his passion for financial research and communication, makes him a valuable asset to the industry. As the crypto landscape continues to evolve, Sebastian remains at the forefront, providing valuable insights and contributing to the growth of this revolutionary technology.

Full Profile

Related Posts

$9 Billion Bitcoin Dump Sparks Talk, But Galaxy Digital Dismisses Quantum Link

Bitcoin Set To Test Resistance At $80,600 After Bottoming At $74,000

Bitcoin Mining Takes New Turn With Tether’s Open-Source Software

Bitcoin Holds $78K Amid Signs Of Economic Recovery: Analysts

Billionaire Entrepreneur Says Bitcoin Price Crash Is A Gift, Here’s Why

Russian Crypto Mining Firm BitRiver Hit As CEO Arrested In Tax Case

相关问答

QWhat does the current Bitcoin market structure indicate according to the analyst?

AThe current Bitcoin market structure points to 'ongoing stress' rather than final capitulation, as long-term holder risk metrics remain below historical capitulation thresholds.

QWhat is the key signal for identifying a Bitcoin market bottom based on historical patterns?

AThe key signal for identifying a market bottom is holder behavior, specifically whether long-term investors show signs of stress through widespread unrealized losses, not just price action.

QWhat is the current level of Bitcoin's long-term holder risk metric, and how does it compare to historical capitulation levels?

AThe current long-term holder risk metric is around 37%, which is well below historical capitulation thresholds of 55-60% or higher seen in previous cycles like 2015 (95%), 2019 (83%), COVID crash (70%), and 2022 (85%).

QWhat technical support levels has Bitcoin broken recently according to the weekly chart analysis?

ABitcoin has broken below both the 50-week moving average (blue) and the 100-week moving average (green), which had previously acted as dynamic support, signaling a shift from a corrective pullback to a more structural downtrend phase.

QWhat does the analyst suggest would indicate that 'strong hands' are under substantial pressure in the Bitcoin market?

AA move of the long-term holder risk metric toward the 70% region would indicate that even strong hands (long-term holders) are under substantial pressure, which has historically been a prerequisite for a more structural and lasting market low.

你可能也喜欢

BTC 市场脉搏:第17周

尽管比特币价格上涨势头略有减弱,但市场仍显示出强烈的买方兴趣,可能缓冲价格大幅下跌。然而,现货CVD由正转负表明卖压增加,市场情绪转向看跌。中心化交易所交易活动上升,显示市场参与活跃。 期货市场未平仓合约增加,表明风险偏好增强和对价格波动的敏感性提高。但多头资金费率显著下降和永续合约CVD急剧下跌,暗示看跌情绪升温,交易员愿意支付溢价进行空头操作,买方积极性降低。 期权市场对下行保护的需求减少,表明看跌情绪可能软化。但未平仓合约收缩可能意味着获利了结或平仓,影响市场波动性和价格动态。波动率利差显示市场情绪可能趋于稳定,从定价更多风险转向更中性立场。 ETF领域,美国现货ETF的MVRV比率和净流入增加,表明盈利增强和投资者兴趣强劲。结合交易活动显著上升,指向谨慎乐观情绪和通过受监管渠道对比特币的参与度提高。 流动性方面,热资本份额下降和实现市值变化为负但改善,表明资本更趋休眠,净流出缓解,与谨慎状况一致。短期持有者与长期持有者供应比率稳定,显示结构平衡和长期持有者信心持续。 NUPL和盈利供应百分比改善,信号市场可能进入稳定阶段,悲观情绪减少,即时卖压降低。但实现盈亏比率下降表明恐惧驱动的抛售持续,凸显市场背景复杂且不断演变。

insights.glassnode12分钟前

BTC 市场脉搏:第17周

insights.glassnode12分钟前

交易

现货
合约

热门文章

加密市场宏观研报:《GENIUS Act》法案取得重大进展,BTC突破历史新高,后市全新展望

2025年5月22日,比特币价格正式突破11万美元大关,创下历史新高。在政策面、宏观经济、资金面与投资者结构共同作用下,一场结构性牛市浪潮正在展开。而此轮上涨背后的核心驱动,是美国《GENIUS稳定币法案》的实质性进展以及多项利好的叠加。本文将从政策端突破、宏观环境转向、链上与ETF资金结构、交易行为演化,以及重点受益赛道五大维度,全面解析此轮BTC再创新高的深层逻辑,并前瞻下半年市场的潜在趋势。

1.3k人学过发布于 2025.05.22更新于 2025.05.22

加密市场宏观研报:《GENIUS Act》法案取得重大进展,BTC突破历史新高,后市全新展望

相关讨论

欢迎来到HTX社区。在这里,您可以了解最新的平台发展动态并获得专业的市场意见。以下是用户对BTC(BTC)币价的意见。

活动图片