Semiconductor Mid-Game Check-in: How Much Left in the Tail-End Rally?

marsbit发布于2026-08-20更新于2026-08-20

文章摘要

Semiconductor Mid-Game Review: How Much is Left in the Rally? This analysis compares the current semiconductor market trend to NVIDIA's trajectory in 2024, drawing lessons on identifying market tops and bottoms. In July-August 2024, NVIDIA's stock fell 33%, triggered by a combination of "fundamental rumors" (Blackwell delays, antitrust probes) and "macro-driven asset selling" (BOJ rate hike leading to carry-trade unwinding). The low was marked by extreme panic selling across global markets. Key characteristics of a TOP include: Technical patterns like double tops or failure to break highs; Overcrowded and leveraged positioning (e.g., excessive retail and ETF inflows into a single stock like NVDA); High fragility where even a minor fundamental disappointment (e.g., a slight margin dip in stellar earnings) triggers a sharp correction. The practical action is to reduce exposure upon seeing technical warning signs combined with crowded trades. Key characteristics of a BOTTOM include: Technical reversal signals like a high-volume bullish engulfing pattern after a steep drop; Panic indicators hitting extremes (e.g., record VIX, major index crashes) signaling selling exhaustion; The downturn being driven by macro or systemic shocks unrelated to the company's core business fundamentals, creating a mispricing that quality companies eventually recover from. The conclusion is that while the current semiconductor rally may be in its later stages ("fish tail"), understanding these pa...

Author: XinGPT

The current semiconductor market trend somewhat resembles the script from Nvidia in 2024. Let's review what happened then:

From July 11 to August 5, 2024, Nvidia fell from around $134 to $90.94, a drop of 33%.
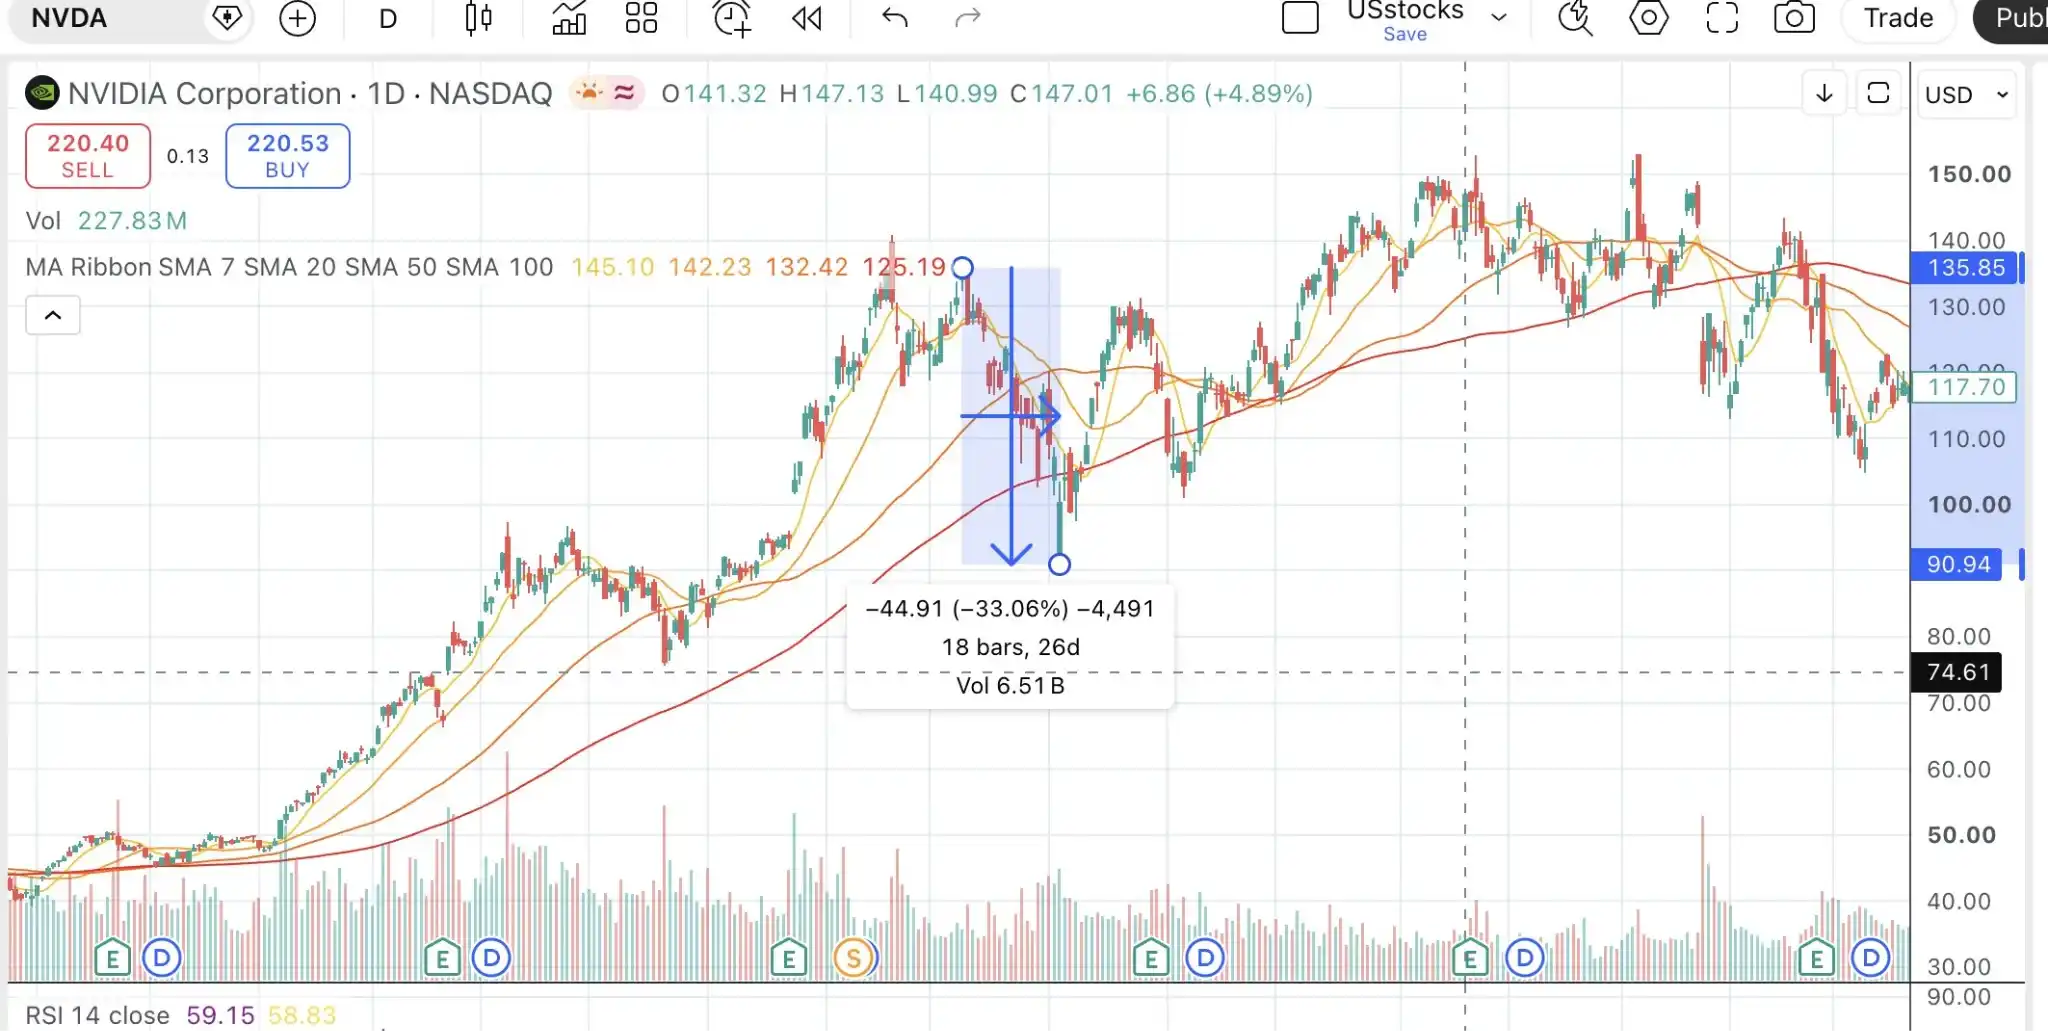
On the news front, triggers for the decline included rumors of Blackwell delays starting in July, reports of a US Department of Justice antitrust investigation, and finally, the Bank of Japan's interest rate hike on August 5th, which triggered carry trade unwinding and a panic sell-off in global risk assets, hitting the low. In other words, "a mix of fundamental rumors/small stories + macro-driven asset sell-off."

From August 8th to September 6th, over the course of a month, the stock rebounded from being oversold, coupled with some policy easing on the macro front; but it didn't surpass the previous high. Nvidia's "good but not perfect" earnings report triggered another decline.

Subsequently, on September 11th, Nvidia announced that Blackwell had entered full production and shipments would begin in Q4. Nvidia's stock rose 8% that day. Coupled with the Fed's first 50bp rate cut in 4 years, Nvidia's stock price broke to a new all-time high again on November 8th.

What can we learn from history?

1. What are the characteristics of a阶段性 (stage-wise) top?

Technical: Double top or failure to break through the previous high resistance level; simultaneously, candlestick patterns show bearish engulfing patterns;

Crowded positioning + high leverage: In June 2024, 70% of fund managers believed being long the Mag7 was the most crowded trade, while small-cap short interest approached historical records. The entire market was crowded on one side of the boat;

In the five trading days leading up to August 27, 2024, during another top interval for Nvidia's stock price, retail investors net bought $1.4 billion worth of NVDA. In the same period, the second-place, Tesla, was only at the $100-200 million level, a nearly tenfold difference. NVDL (the 2x Long NVDA ETF) had net inflows of $3.5 billion for the year and repeatedly became the most actively traded instrument intraday.

Fundamentals: On August 28th, Nvidia's earnings report showed revenue and guidance exceeding expectations, but because gross margin fell by 3%, the stock dropped nearly 7% after hours.

So, it's not hard to see that the characteristics of a stage-wise top are the emergence of topping patterns on the technical side, coupled with increased fragility in positioning (high concentration, high leverage). Once there's any hint of trouble in fundamentals or news, the stock price will immediately plummet.

The practical approach is: once technical characteristics appear for identification, and if positioning shows excessive leverage and concentration, one should immediately reduce holdings to hedge risks. Once the downtrend is confirmed, sell.

2. Bottom characteristics

Technical: On August 5th, a long-bodied candlestick after a gap down open, with sufficient volume — 553 million shares was the highest single-day trading volume in that period, exceeding all surrounding trading days. On August 6th, it closed above the previous day's body, confirming an engulfing pattern. On the 7th, a pullback did not break the previous low.

These three days formed the technical signal for a bottom.
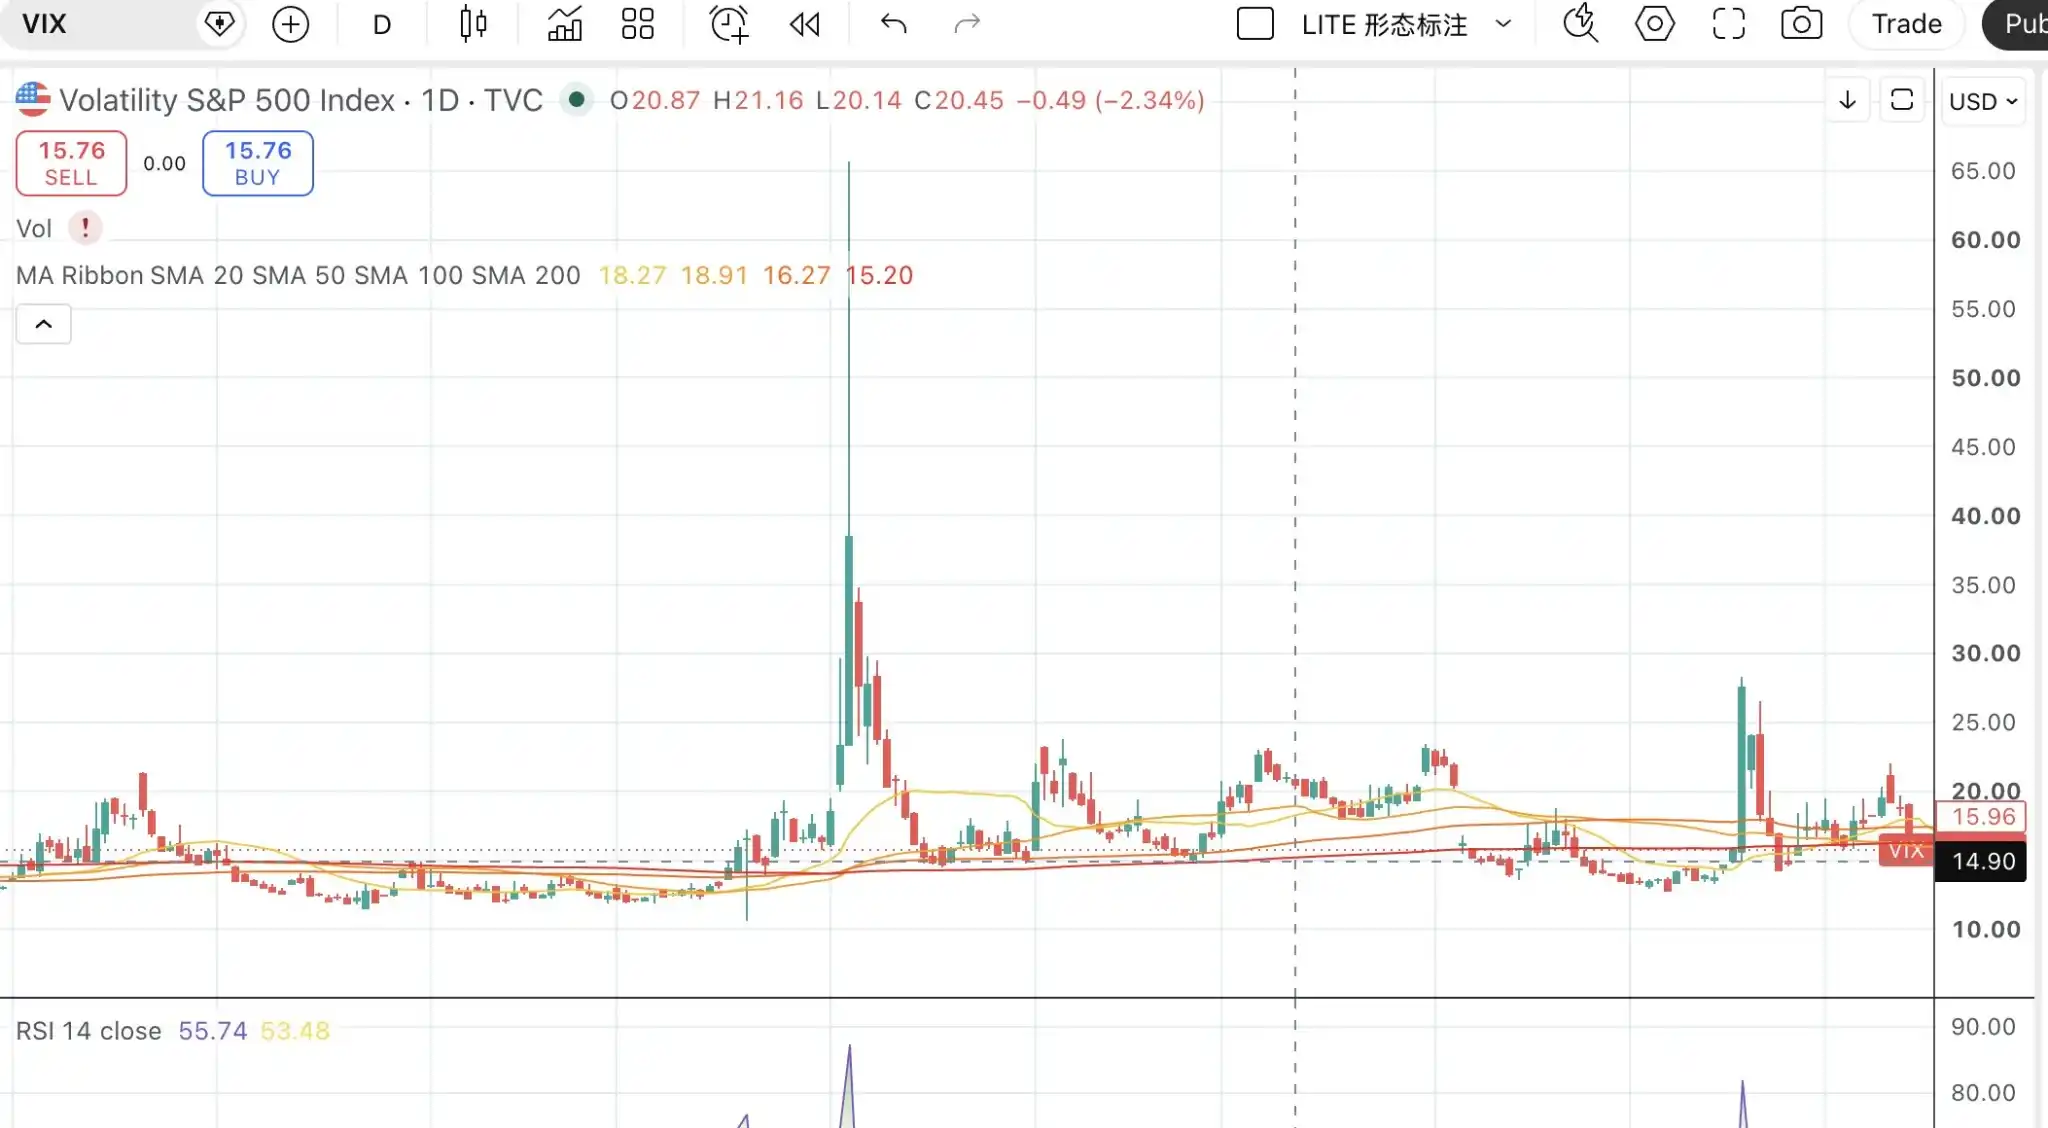
We further confirm with positioning: The VIX指数 (VIX index) hit a record that day, reaching 65 intraday (the third highest in history);外围市场 (peripheral markets) like the Nikkei were down -12.4% (largest since 1987), KOSPI down -9% triggering a circuit breaker. All market-level恐慌指标 (panic indicators) were off the charts, also meaning selling pressure reached an extreme;

Fundamentally, the main bearish trigger chain was the BoJ's rate hike on July 31st, yen carry trade unwinding, and the US July non-farm payrolls at 114k, far below expectations. This was a macro-driven sell-off for the broader market, unrelated to Nvidia's fundamentals.

The rebound on September 6th followed similar logic, just not as extreme as on August 5th.

We can also identify bottom characteristics: first, technical patterns begin to show bottoming formations, especially confirmed by volume; second, the logic of the decline does not touch the core business fundamentals of the enterprise. It's more often a one-off macro event or short-term shock for the broader market. Ultimately, quality companies will see their prices修复 (recover from) the erroneous sell-off.
热门币种推荐

相关问答

QWhat is the main analogy the author draws to analyze the current semiconductor market situation?

AThe author analogizes the current semiconductor market situation to the script of Nvidia in 2024, specifically comparing the potential phase of the semiconductor cycle ('fish tail' phase) to Nvidia's price action pattern from mid-2024.

QWhat were the combined factors that led to Nvidia's sharp decline in July-August 2024 according to the article?

AThe sharp decline was triggered by a combination of factors: fundamental rumors (like Blackwell delay), regulatory news (DOJ antitrust investigation), and a macro event (the Bank of Japan's rate hike leading to carry trade unwinding and a panic sell-off in global risk assets).

QAccording to the article, what are the key characteristics of a 'stage top' (díng) in a stock's price movement?

AThe key characteristics are: technical chart patterns showing a top (like a double top or failure to break previous highs), crowded and highly leveraged capital inflows which increase fragility, and a subsequent negative catalyst from fundamentals or news that triggers a sharp price drop.

QWhat technical and market signals indicated the formation of a bottom for Nvidia on August 5, 2024?

AThe bottom was indicated by technical signals: a long-bodied bullish candlestick on high volume (the highest in that period) on August 5th, followed by a confirming pattern in the next two days. Market signals included extreme fear indicators like a spike in the VIX index and major sell-offs in other global markets, suggesting selling pressure had peaked.

QWhat practical trading advice does the article suggest once signs of a potential top appear?

AThe article suggests that once technical top signals appear, especially if accompanied by signs of excessive leverage and crowded positioning, an investor should immediately reduce position size to hedge risk. If a confirmed downtrend begins, one should sell the position.

你可能也喜欢

Hyperliquid的合规之路:从无需许可到许可制HIP-3

Hyperliquid(基于HyperCore的去中心化交易基础设施)因其无需许可、用户自托管的特点,与美国针对期货交易的严格市场结构法律(涉及注册交易平台DCM、清算所DCO和经纪商FCM)存在根本冲突,因此一直对美国市场进行地理封锁。 为了解决此困境,Hyperliquid成立了政策中心(HPC),积极游说美国监管机构(CFTC、SEC),主张将Hyperliquid视为“中立基础设施”。其核心提议是:允许已受监管的实体(如经纪商、交易平台)在履行其原有KYC、市场监控等合规义务的前提下,利用Hyperliquid的底层技术(如HyperCore)来构建和运营产品,而非要求协议本身改变其无需许可的特性。 作为这一合规路径的实例,Hyperliquid已在测试网推出具备许可权限的HIP-3部署者功能。此类部署允许受监管实体创建仅对白名单用户(即已完成KYC的合规用户)开放的市场,并拥有对用户账户执行特定操作(如强制平仓)的权限,从而模仿传统金融中FCM的职责。尽管这些合规市场会形成独立的订单簿,但通过白名单做市商的桥梁作用,它们仍能共享Hyperliquid主市场的流动性。 总之,Hyperliquid的战略目标并非直接向美国用户开放其原生免KYC前端,而是通过提供工具,让合规机构能在其底层上构建符合美国法规的产品,从而为美国投资者提供间接参与其生态的合规通道,同时保持协议本身的中立性与开放性。

marsbit1小时前

Hyperliquid的合规之路:从无需许可到许可制HIP-3

marsbit1小时前

交易

现货

热门文章

如何购买CHECK

欢迎来到HTX.com!我们已经让购买Checkmate(CHECK)变得简单而便捷。跟随我们的逐步指南,放心开始您的加密货币之旅。第一步:创建您的HTX账户使用您的电子邮件、手机号码注册一个免费账户在HTX上。体验无忧的注册过程并解锁所有平台功能。立即注册第二步:前往买币页面,选择您的支付方式信用卡/借记卡购买:使用您的Visa或Mastercard即时购买Checkmate(CHECK)。余额购买:使用您HTX账户余额中的资金进行无缝交易。第三方购买:探索诸如Google Pay或Apple Pay等流行支付方法以增加便利性。C2C购买:在HTX平台上直接与其他用户交易。HTX场外交易台(OTC)购买:为大量交易者提供个性化服务和竞争性汇率。第三步:存储您的Checkmate(CHECK)购买完您的Checkmate(CHECK)后,将其存储在您的HTX账户钱包中。您也可以通过区块链转账将其发送到其他地方或者用于交易其他加密货币。第四步:交易Checkmate(CHECK)在HTX的现货市场轻松交易Checkmate(CHECK)。访问您的账户,选择您的交易对,执行您的交易,并实时监控。HTX为初学者和经验丰富的交易者提供了友好的用户体验。

2.0k人学过发布于 2026.01.19更新于 2026.06.02

如何购买CHECK

相关讨论

欢迎来到HTX社区。在这里,您可以了解最新的平台发展动态并获得专业的市场意见。以下是用户对CHECK(CHECK)币价的意见。

活动图片