Analyzing RENDER’s 11% surge: Is the momentum sustainable?

ambcrypto发布于2026-04-03更新于2026-04-03

文章摘要

Render (RENDER) surged 11.23% to $1.91, reaching a three-week high, with trading volume rising 48% to $81.5 million. Derivatives data showed strong bullish sentiment, as Open Interest increased by 21% to $60 million and the Long/Short Ratio rose to 1.28, indicating dominant long positions. However, spot netflow turned positive at $460k, suggesting increased selling pressure as profit-taking resumed. Technical indicators like the RSI at 64 and positive DMI signal strong upward momentum, but if profit-taking intensifies, RENDER could retrace to the $1.6 support level. Breaking the $2 resistance is possible if bullish conditions persist.

Render [RENDER] continued with its bullish streak, breaking out of the recent downtrend and summiting a three-week high of $1.92.

As of this writing, RENDER traded at $1.91, up 11.23% on the daily charts, adding to its 6% weekly gains. Over the same period, the altcoin’s volume rose 48% to $81.5 million, reflecting increased market participation.

RENDER speculators take hold of the market

While the market continued to suffer from reduced liquidity, RENDER has shown solid strength, consistent with active market participation.

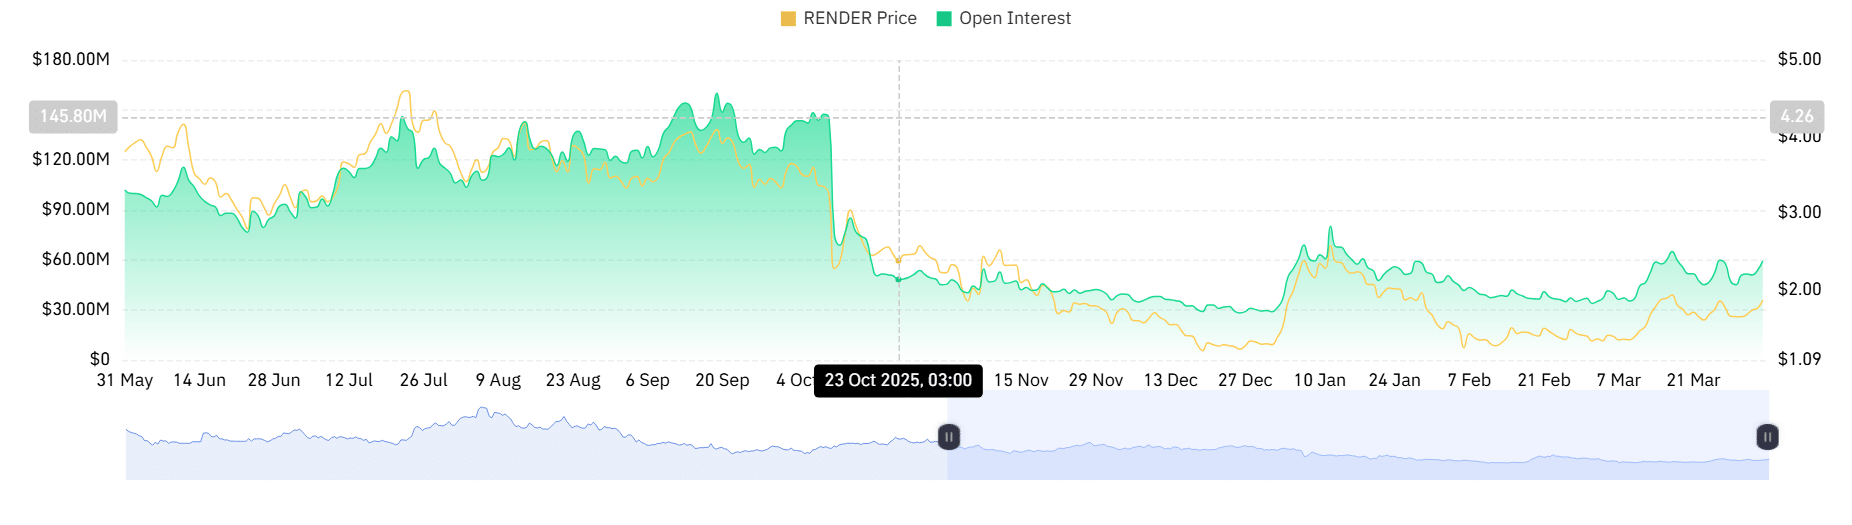
On the derivatives side in particular, RENDER has experienced sustained demand for Futures positions. CoinGlass data showed that altcoin Open Interest rose 21% to $60 million, while derivatives volume climbed 35% to $128 million.
Source: CoinGlass

Such a jump in OI and Volume showed increased Futures market participation and steady capital inflows. In fact, over $9 million flowed into the futures positions over the past eight hours as of the 3rd of April.

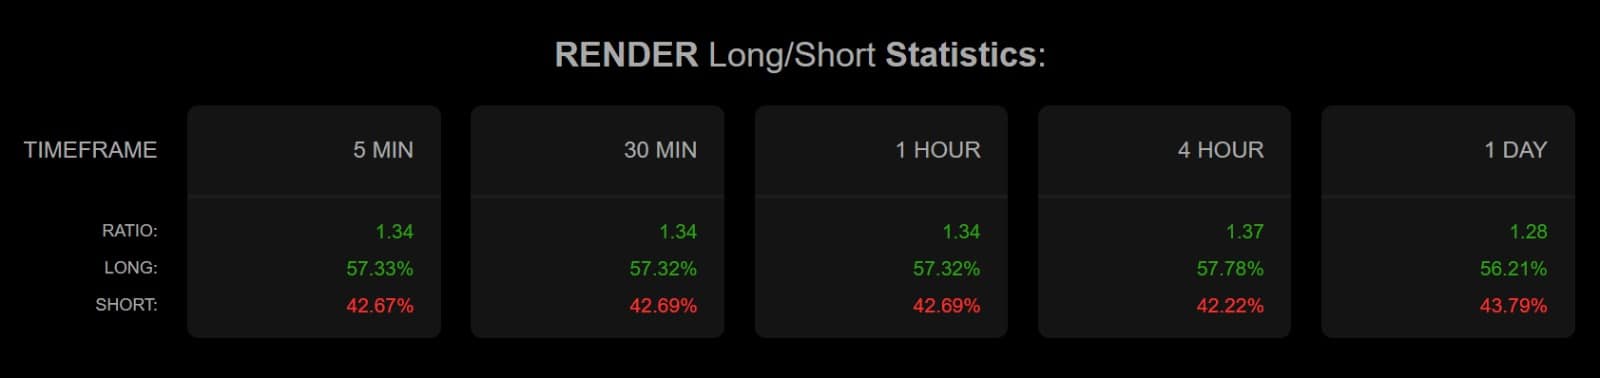
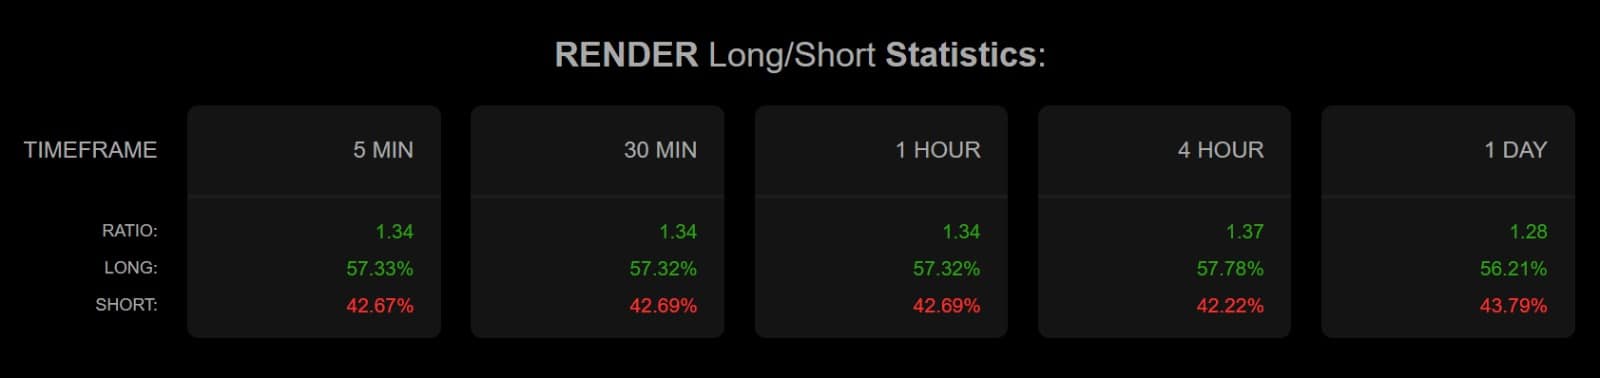
Meanwhile, the altcoin’s Long/Short Ratio rose to 1.28, signaling a higher demand for long positions. As such, longs accounted for 56%, while shorts accounted for 43% of the total Futures positions.
Source: Coinalyze

When longs dominate, it suggests that most participants were bullish and aggressively positioned for more gains.

Profit takers return to the market

With RENDER reaching a three-week high, holders who have been underwater rushed to cash out.

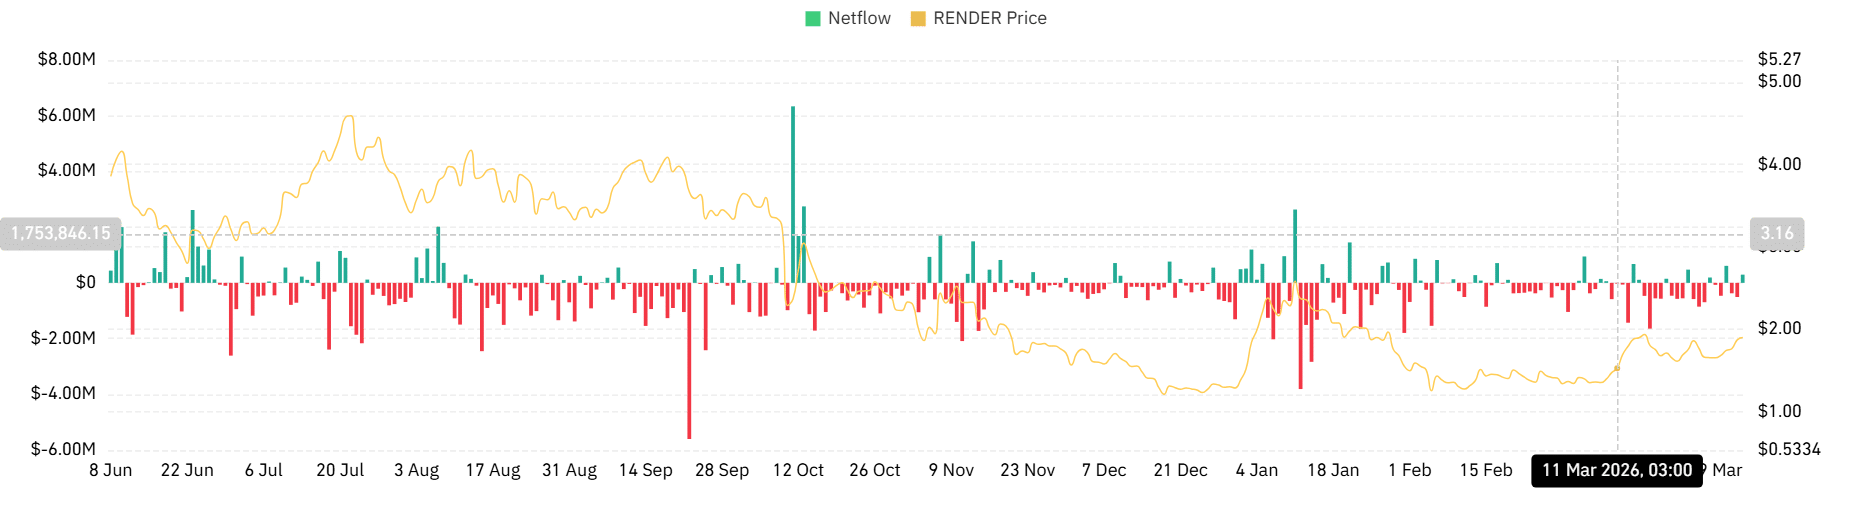
Looking at exchange activity, Spot Netflow turned positive after being negative for two consecutive days. At press time, Netflow was $460k, a significant reversal from -$507 the previous day.
Source: CoinGlass

A positive netflow implied that the market saw more sellers than buyers. Such a shift in market behavior has historically weakened the market and led to pullbacks. Thus, extended profit realization could threaten recent gains and cause another slip.

Can the upside momentum hold?

RENDER has recorded a sustained week-long bullish momentum since it held the $1.6 support level. Buyers continually stepped in and defended higher price levels.

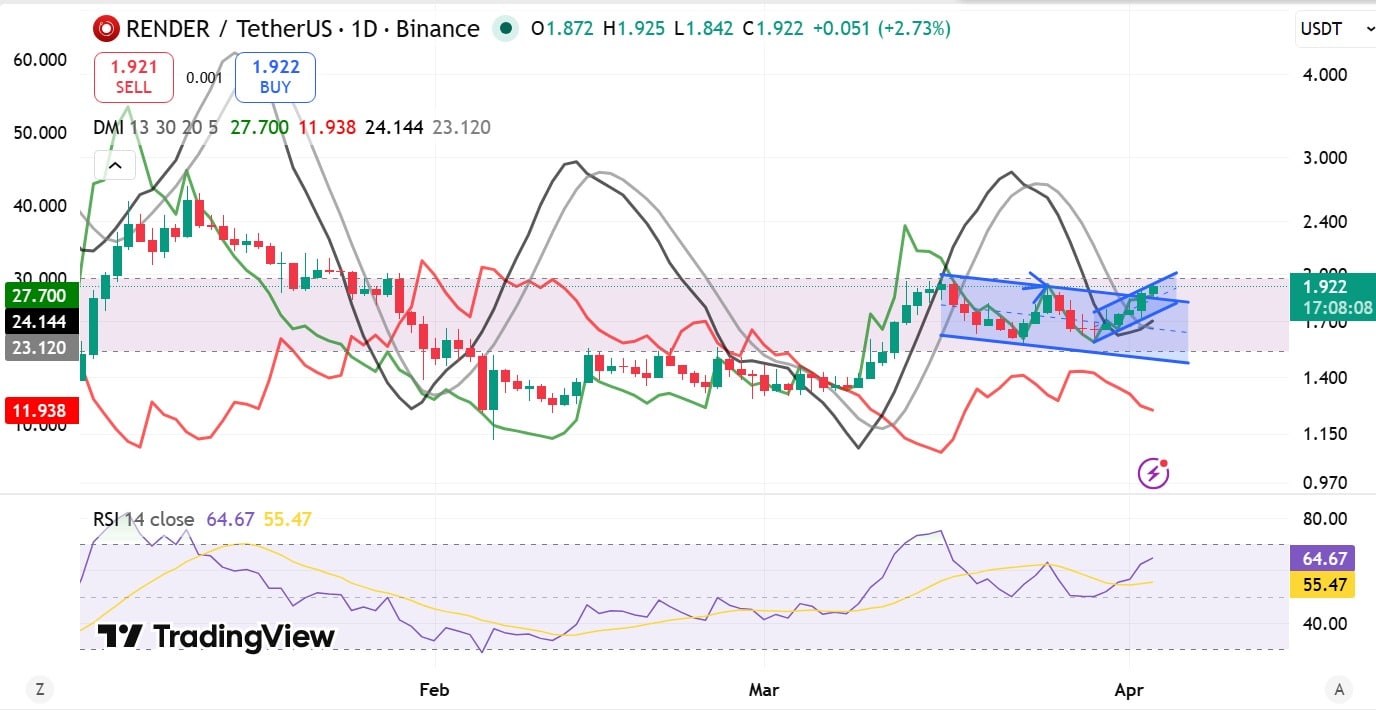
The altcoin’s Relative Strength Index (RSI) rose to 64, signaling strong upside momentum and buyer control of the market.

At the same time, the positive index of the Directional Movement Index (DMI) climbed to 27 while the negative index fell to 11. The rise in these two momentum indicators indicated strong upside momentum and confirmed the trend’s strength.
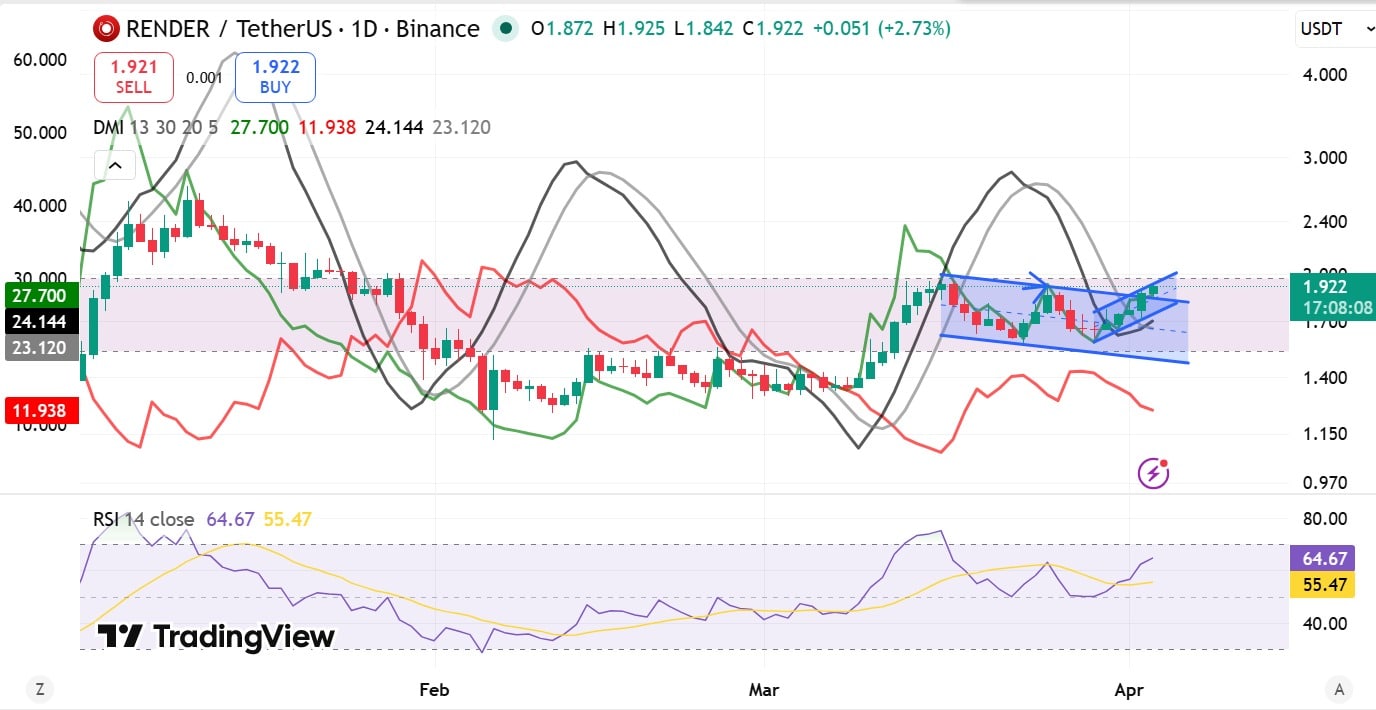
Source: Tradingview

Therefore, the two signals indicate a potential continuation of the market demand trend. While profit takers remain active, their positioning is still not strong enough.

If the prevailing market conditions hold, RENDER could flip its immediate resistance at $2. However, if profit-taking accelerates and overwhelms demand, the altcoin could retrace to $1.6.


Final Summary

  • RENDER surges 11%, touching a three-week high of $1.92 amid sustained demand.
  • RENDER has shown strong upside momentum amid sustained short-term demand, but profit-takers’ return risks capping market gains.


热门币种推荐

相关问答

QWhat was the price of RENDER and its percentage gain as mentioned in the article?

ARENDER traded at $1.91, up 11.23% on the daily charts.

QWhat does the Long/Short Ratio of 1.28 for RENDER indicate about market sentiment?

AA Long/Short Ratio of 1.28 signals a higher demand for long positions, with longs accounting for 56% of total Futures positions, indicating that most participants were bullish and positioned for more gains.

QWhat does a positive Spot Netflow value imply for the RENDER market?

AA positive Spot Netflow value of $460k implies that there were more sellers than buyers, which historically weakens the market and can lead to pullbacks due to profit realization.

QWhat key support level did RENDER hold to maintain its week-long bullish momentum?

ARENDER held the $1.6 support level, which allowed buyers to continually step in and defend higher price levels, sustaining the bullish momentum.

QAccording to the article, what are the two potential price scenarios for RENDER depending on market conditions?

AIf prevailing market conditions hold, RENDER could flip its immediate resistance at $2. However, if profit-taking accelerates and overwhelms demand, it could retrace to $1.6.

你可能也喜欢

富达Q3报告:BTC、ETH与SOL持续筑底,本轮加密熊市还要走多远?

富达数字资产发布了2026年第三季度加密市场信号报告。报告指出,当前加密市场整体仍处于熊市筑底阶段。 **市场总览:** * **加权NUPL(净未实现盈亏):** 已降至-0.01,表明市场整体略低于盈亏平衡线。仅比特币(BTC)仍录得未实现盈利,以太坊(ETH)和Solana(SOL)均处于亏损状态,BTC起到了市场稳定器的作用。 * **BTC主导率:** 升至68%,资金仍高度集中于BTC,尚未出现向其他数字资产的轮动迹象。 * **资产表现:** BTC、ETH、SOL过去一年及年初至今价格全线下跌,多项指标接近历史投降区间。现货ETP持续净流出,宏观环境及市场情绪构成拖累。 **比特币(BTC):** * **NUPL(0.09):** 处于“希望-恐惧”区间,情绪谨慎。 * **动能信号:** 负面,下跌形成偏空脉冲。 * **Yardstick(算力市盈率):** 正面,接近历史低位,显示BTC相对于网络能源投入可能被低估。参照历史底部周期(约300天),当前约203天的调整可能已走完三分之二,2026年10月是可观察的时间窗口。 * **相对黄金表现:** 负面,但近期跌势趋缓。 * **算力:** 负面,受价格低迷及AI算力资源竞争影响,算力从高点回落。 **以太坊(ETH):** * **NUPL(-0.43):** 处于“投降”区间,但历史显示较低NUPL往往对应较高长期回报。 * **动能信号:** 负面,上涨动能未恢复。 * **使用指标:** 中性,链上活动随价格下跌有所降温。 * **稳定币转账额:** 正面,持续创历史新高,显示真实使用需求增强。 * **网络费用:** 负面,受扩容影响持续下降。 **Solana(SOL):** * **NUPL(-0.72):** 处于“投降”区间,历史波动大。 * **动能信号:** 负面,但短期波动率已高于中期,需关注企稳可能。 * **使用指标:** 正面,链上交易活动在熊市中仍保持韧性并增长。 * **稳定币转账额:** 正面,长期上升趋势完好。 * **网络费用:** 中性,下降趋势可能接近底部。 **总结:** 报告认为,市场正处于寻找底部的修复过程中。BTC凭借其流动性优势相对抗跌,而ETH和SOL承受更大压力。虽然多项指标显示市场情绪低迷且接近历史投降区域,为长期投资者可能提供了有吸引力的入场位置,但全面复苏仍需等待更广泛的市场风险偏好恢复和基本面改善。

marsbit30分钟前

富达Q3报告:BTC、ETH与SOL持续筑底,本轮加密熊市还要走多远?

marsbit30分钟前

HIVE首席执行官:用于AI的GPU每小时收入比挖矿业务高10倍

加拿大上市公司HIVE首席执行官近期指出,人工智能(AI)计算业务的经济效益已远超比特币挖矿。据其透露,公司部署在曼尼托巴省贝尔加拿大AI基础设施中的504块NVIDIA B200 GPU集群,每小时每GPU收入约2.90美元,而比特币挖矿设备每小时仅产生约0.12美元,前者收益是后者的20倍以上。 基于此,HIVE将下半年战略重点转向更高收益的AI基础设施投资,同时维持其比特币挖矿业务。2026财年,公司比特币平均算力达22.2 EH/s,同比增长290%,占全网算力约3%,共开采2,885枚BTC。全年总收入达2.978亿美元,其中比特币挖矿收入增长164%,而专注于AI与高性能计算(HPC)的BUZZ HPC部门收入为1950万美元,同比增长94%。 HIVE的转型始于三年前对NVIDIA芯片的7000万美元投资,这使其在AI计算需求激增时占据了先机。公司近期获得了Chardan Capital的“买入”评级及7.50美元目标价,并与贝尔及AI初创公司Cohere签署了价值约2.2亿美元的GPU云服务协议,同时通过债券融资7500万美元用于进一步发展AI基础设施。 其最雄心勃勃的项目是多伦多地区在建的320兆瓦AI数据中心,预计2027年下半年全面运营后可容纳超10万块GPU,实现约3.6亿美元的年经常性收入。HIVE并非孤例,竞争对手如MARA、Hut 8和Terawulf也纷纷将有限电力资源转向利润更高的AI与HPC合约,这反映了在比特币挖矿利润缩减的背景下,上市矿企的普遍战略转移。 HIVE的近期目标是在本财年末将AI与HPC业务年收入提升至当前水平的十倍,这很大程度上取决于多伦多数据中心及后续GPU云服务合约能否按时推进。

cryptonews.ru2小时前

HIVE首席执行官:用于AI的GPU每小时收入比挖矿业务高10倍

cryptonews.ru2小时前

交易

现货

热门文章

如何购买RENDER

欢迎来到HTX.com!我们已经让购买RenderToken(RENDER)变得简单而便捷。跟随我们的逐步指南,放心开始您的加密货币之旅。第一步:创建您的HTX账户使用您的电子邮件、手机号码注册一个免费账户在HTX上。体验无忧的注册过程并解锁所有平台功能。立即注册第二步:前往买币页面,选择您的支付方式信用卡/借记卡购买:使用您的Visa或Mastercard即时购买RenderToken(RENDER)。余额购买:使用您HTX账户余额中的资金进行无缝交易。第三方购买:探索诸如Google Pay或Apple Pay等流行支付方法以增加便利性。C2C购买:在HTX平台上直接与其他用户交易。HTX场外交易台(OTC)购买:为大量交易者提供个性化服务和竞争性汇率。第三步:存储您的RenderToken(RENDER)购买完您的RenderToken(RENDER)后,将其存储在您的HTX账户钱包中。您也可以通过区块链转账将其发送到其他地方或者用于交易其他加密货币。第四步:交易RenderToken(RENDER)在HTX的现货市场轻松交易RenderToken(RENDER)。访问您的账户,选择您的交易对,执行您的交易,并实时监控。HTX为初学者和经验丰富的交易者提供了友好的用户体验。

825人学过发布于 2024.07.26更新于 2026.06.02

如何购买RENDER

相关讨论

欢迎来到HTX社区。在这里,您可以了解最新的平台发展动态并获得专业的市场意见。以下是用户对RENDER(RENDER)币价的意见。

活动图片